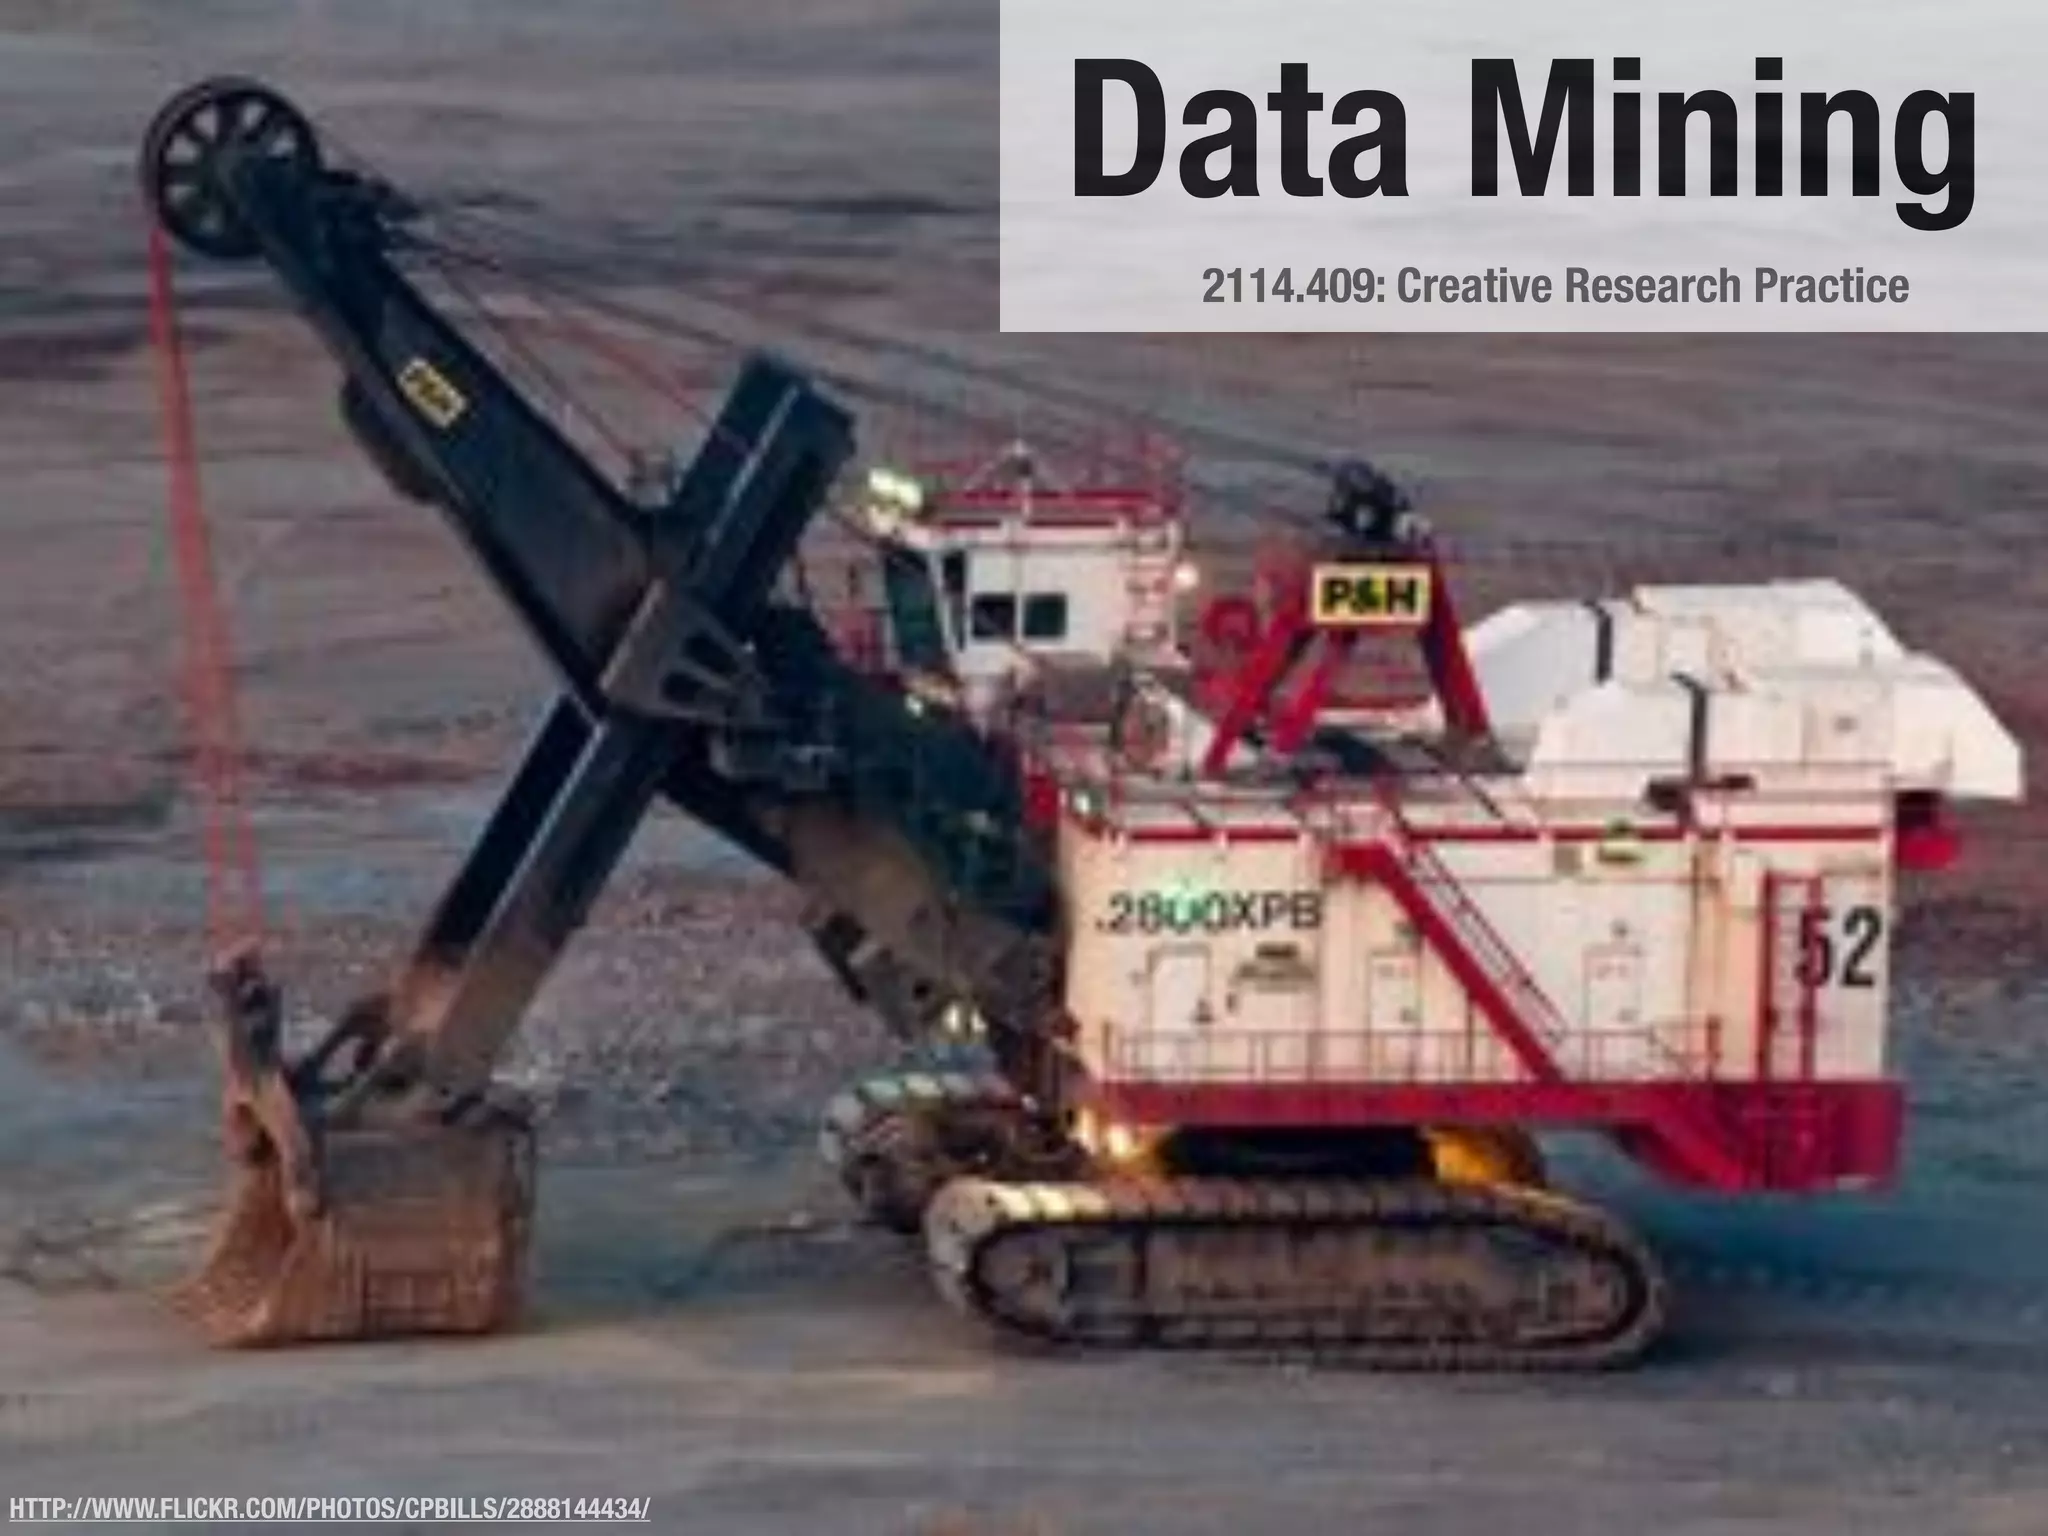
Download as PDF, PPTX


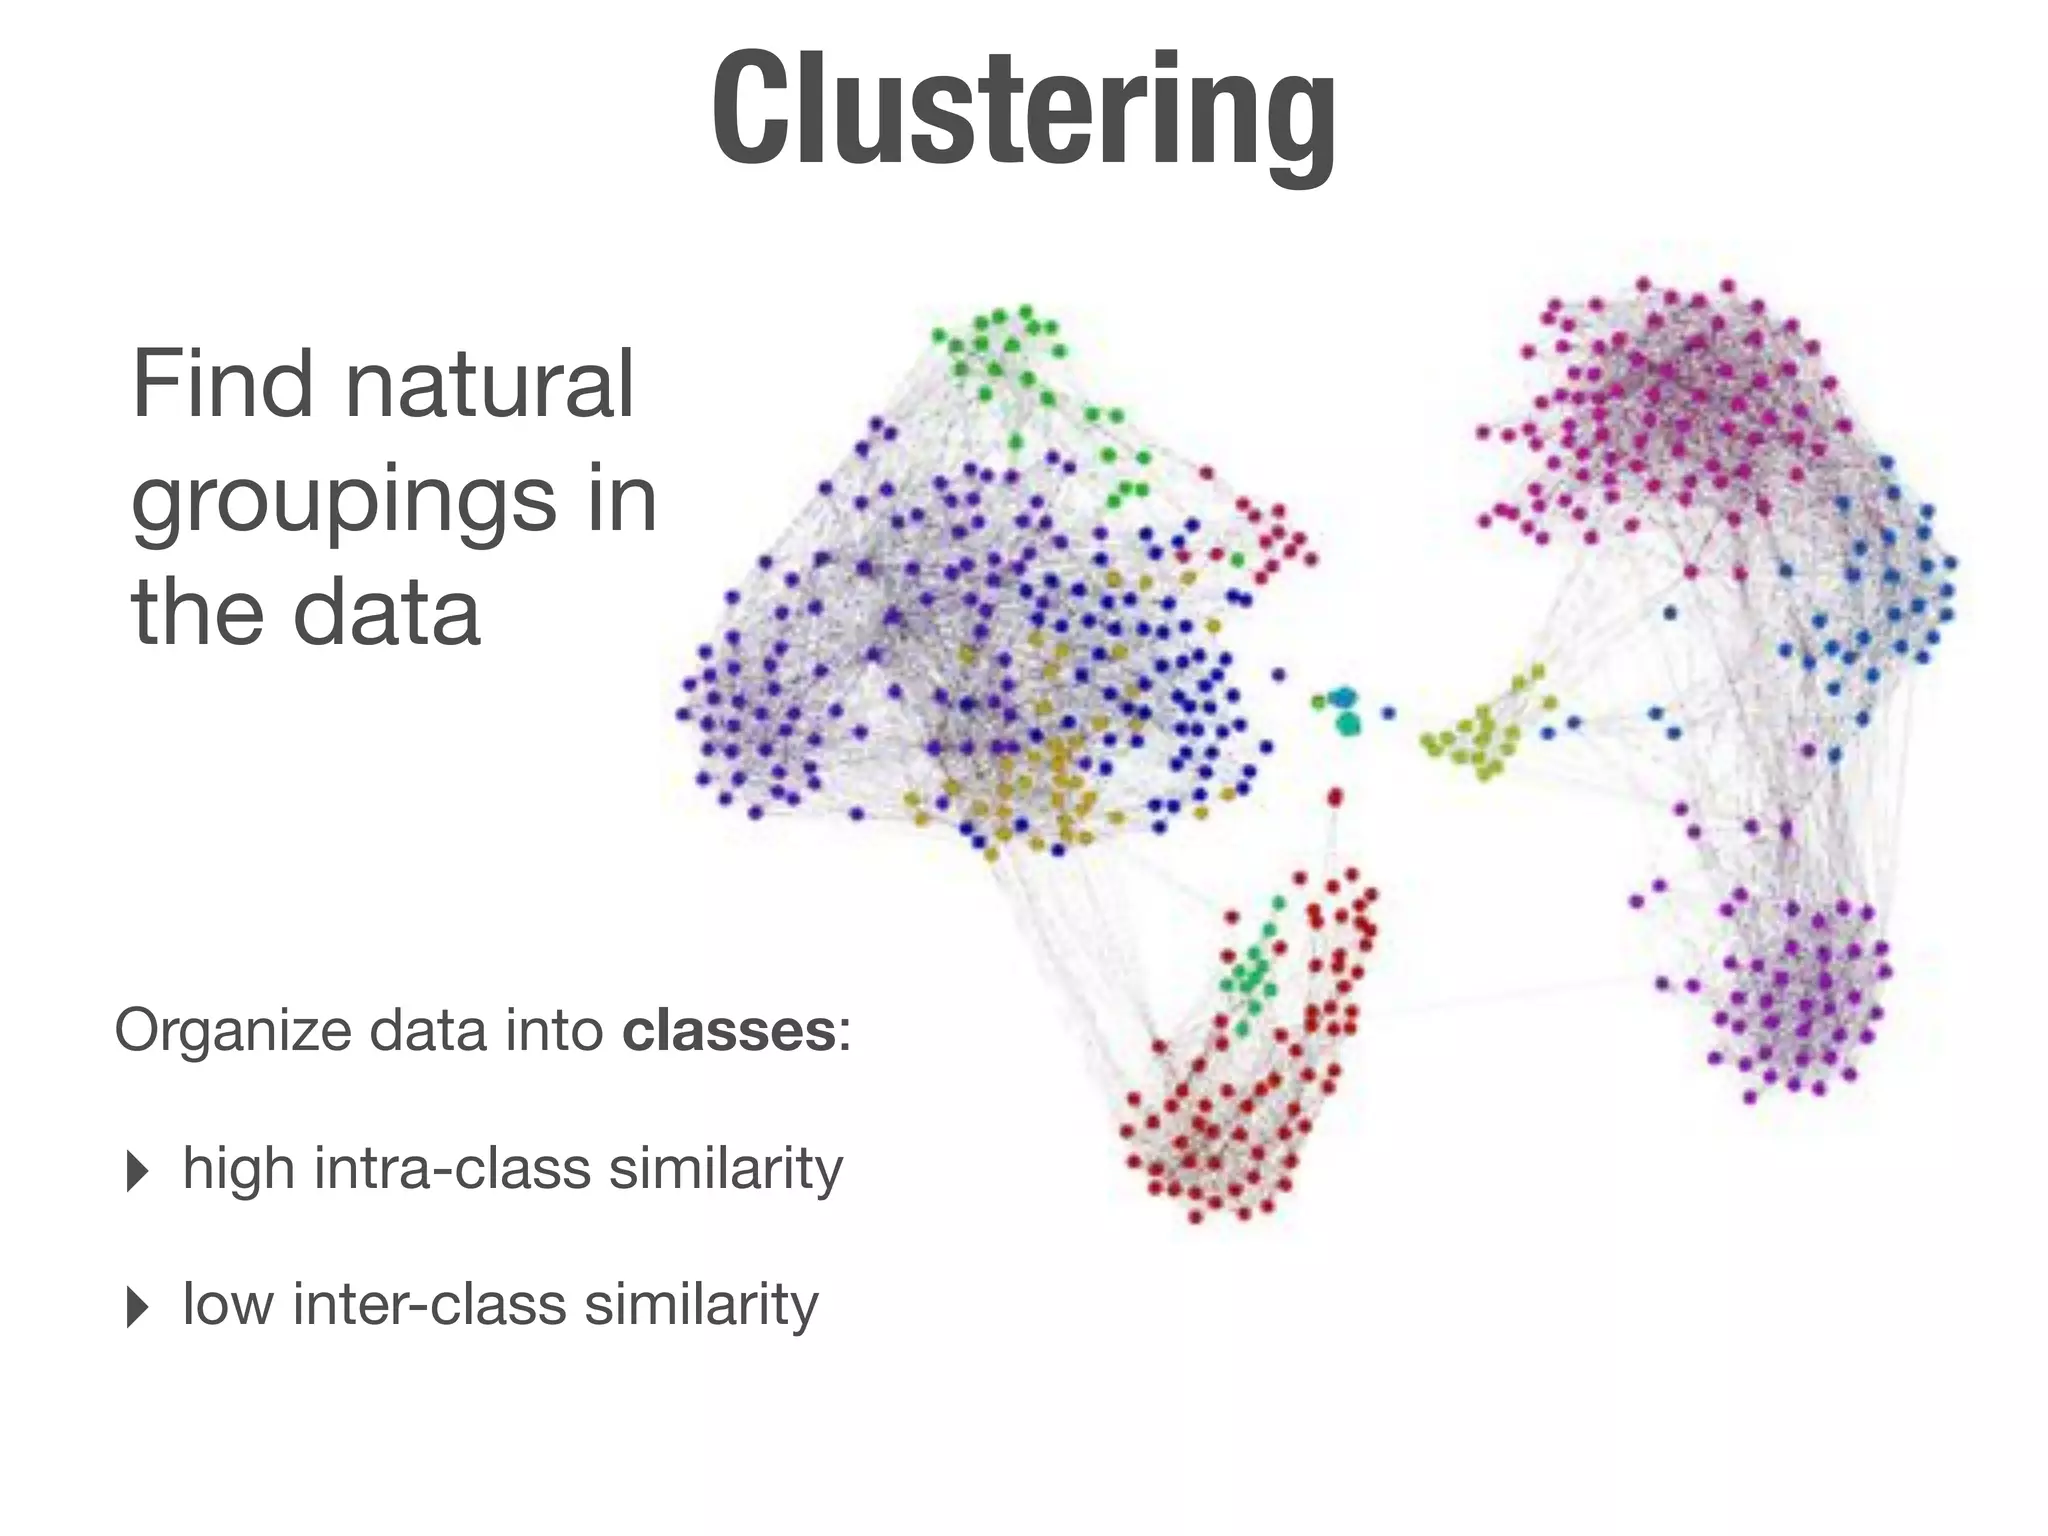
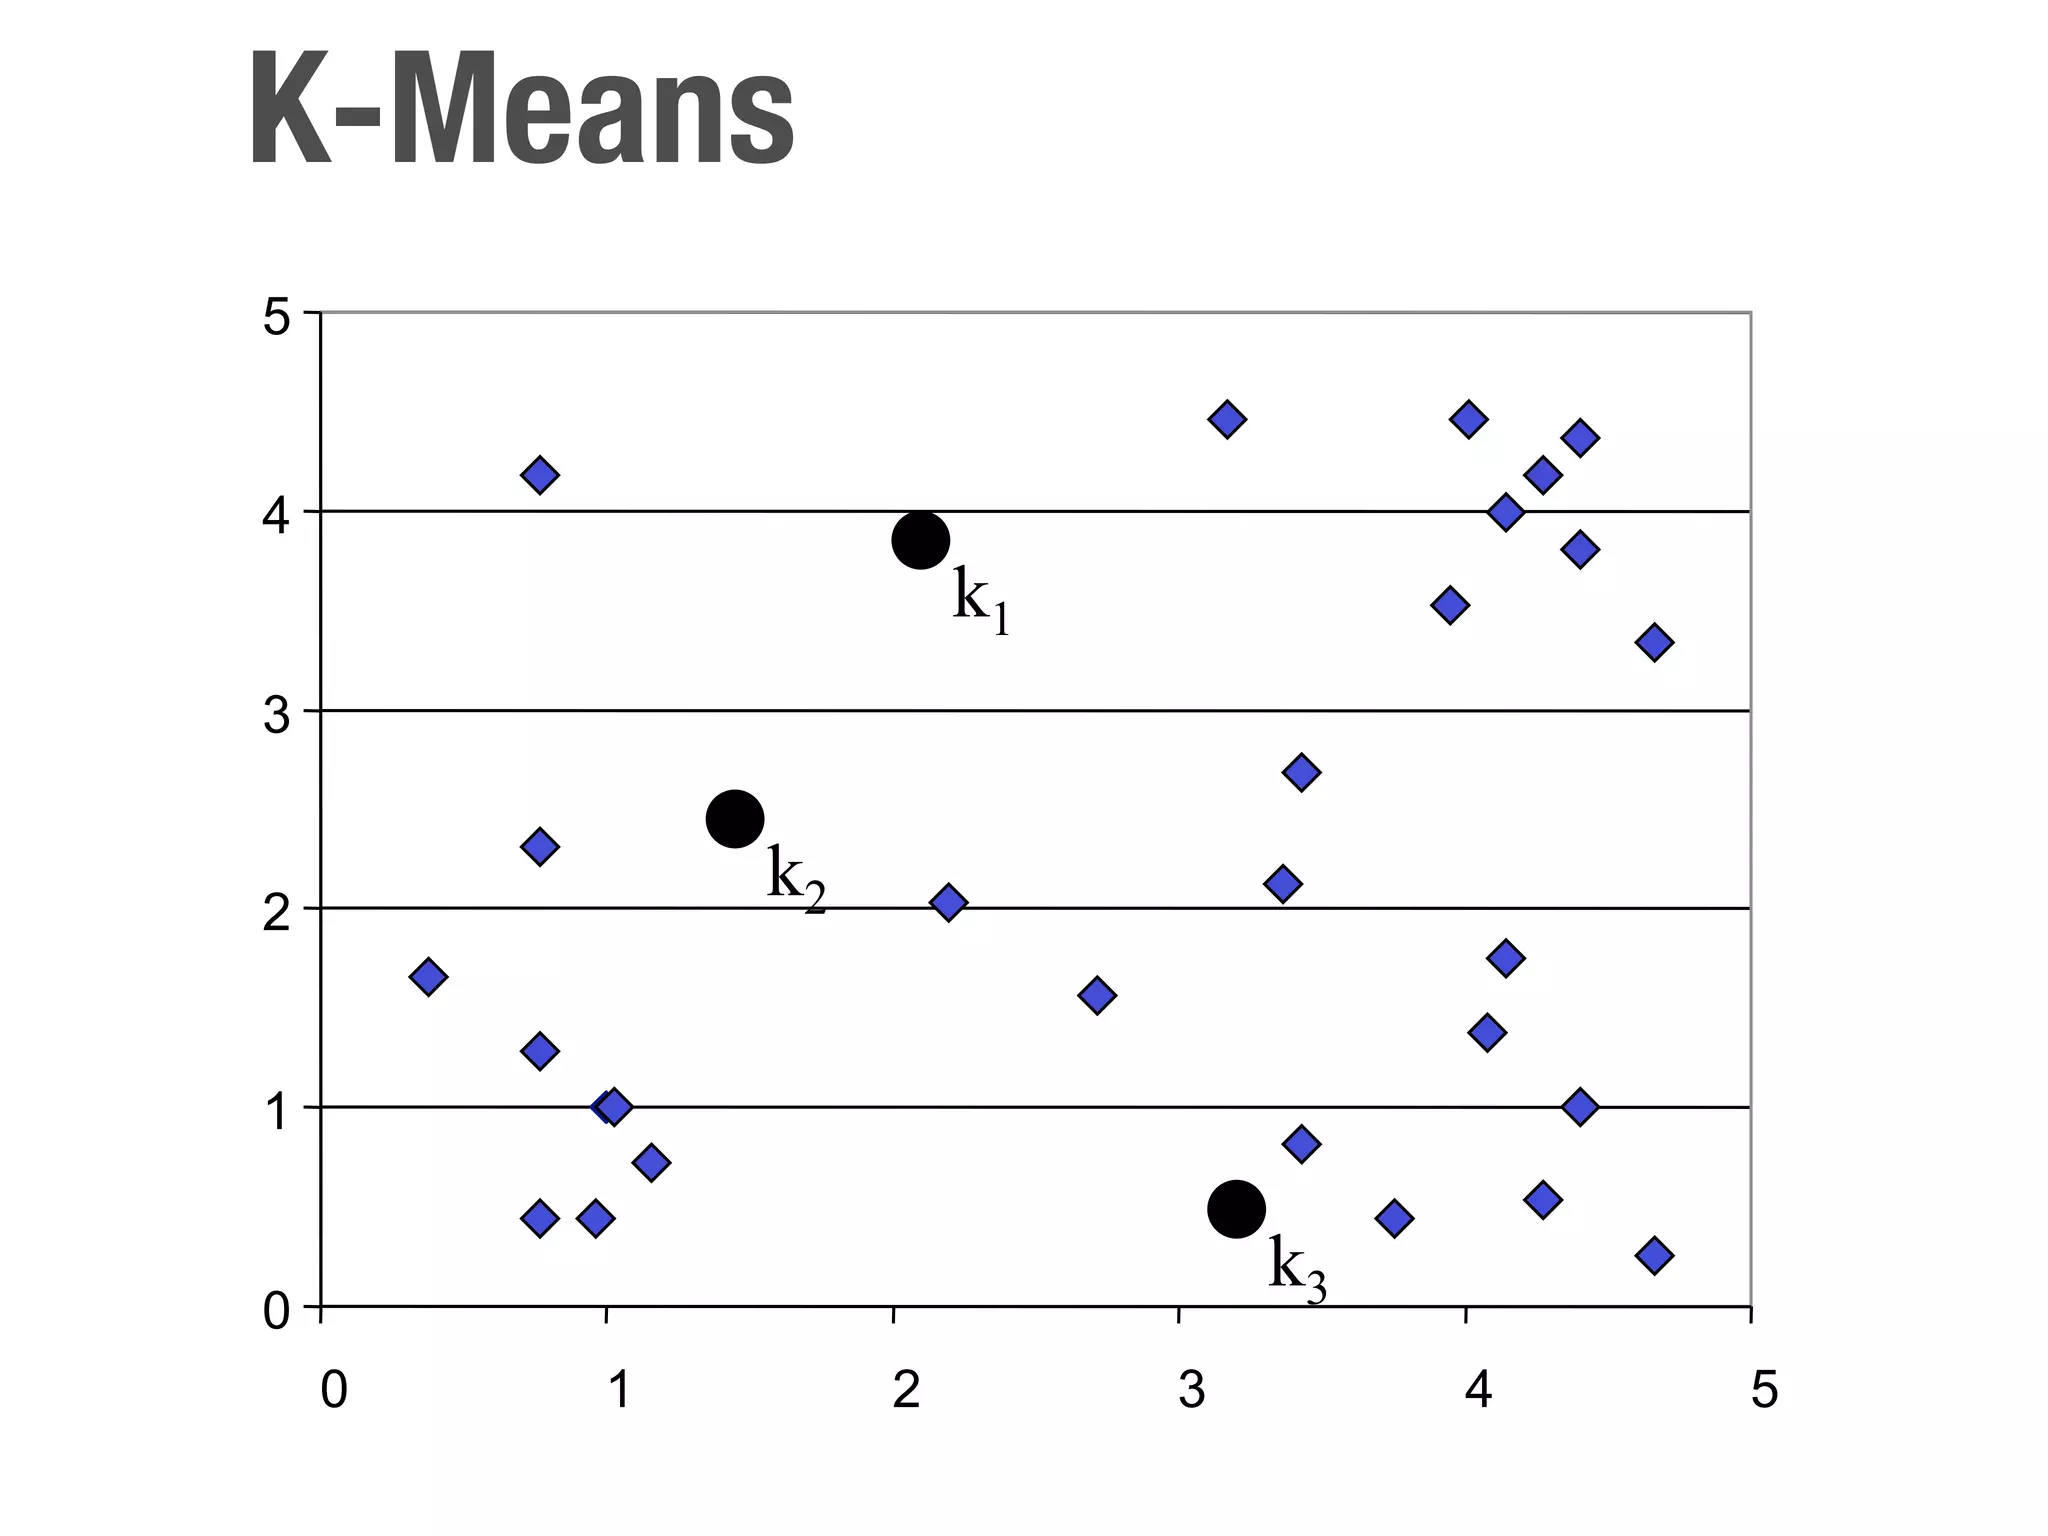
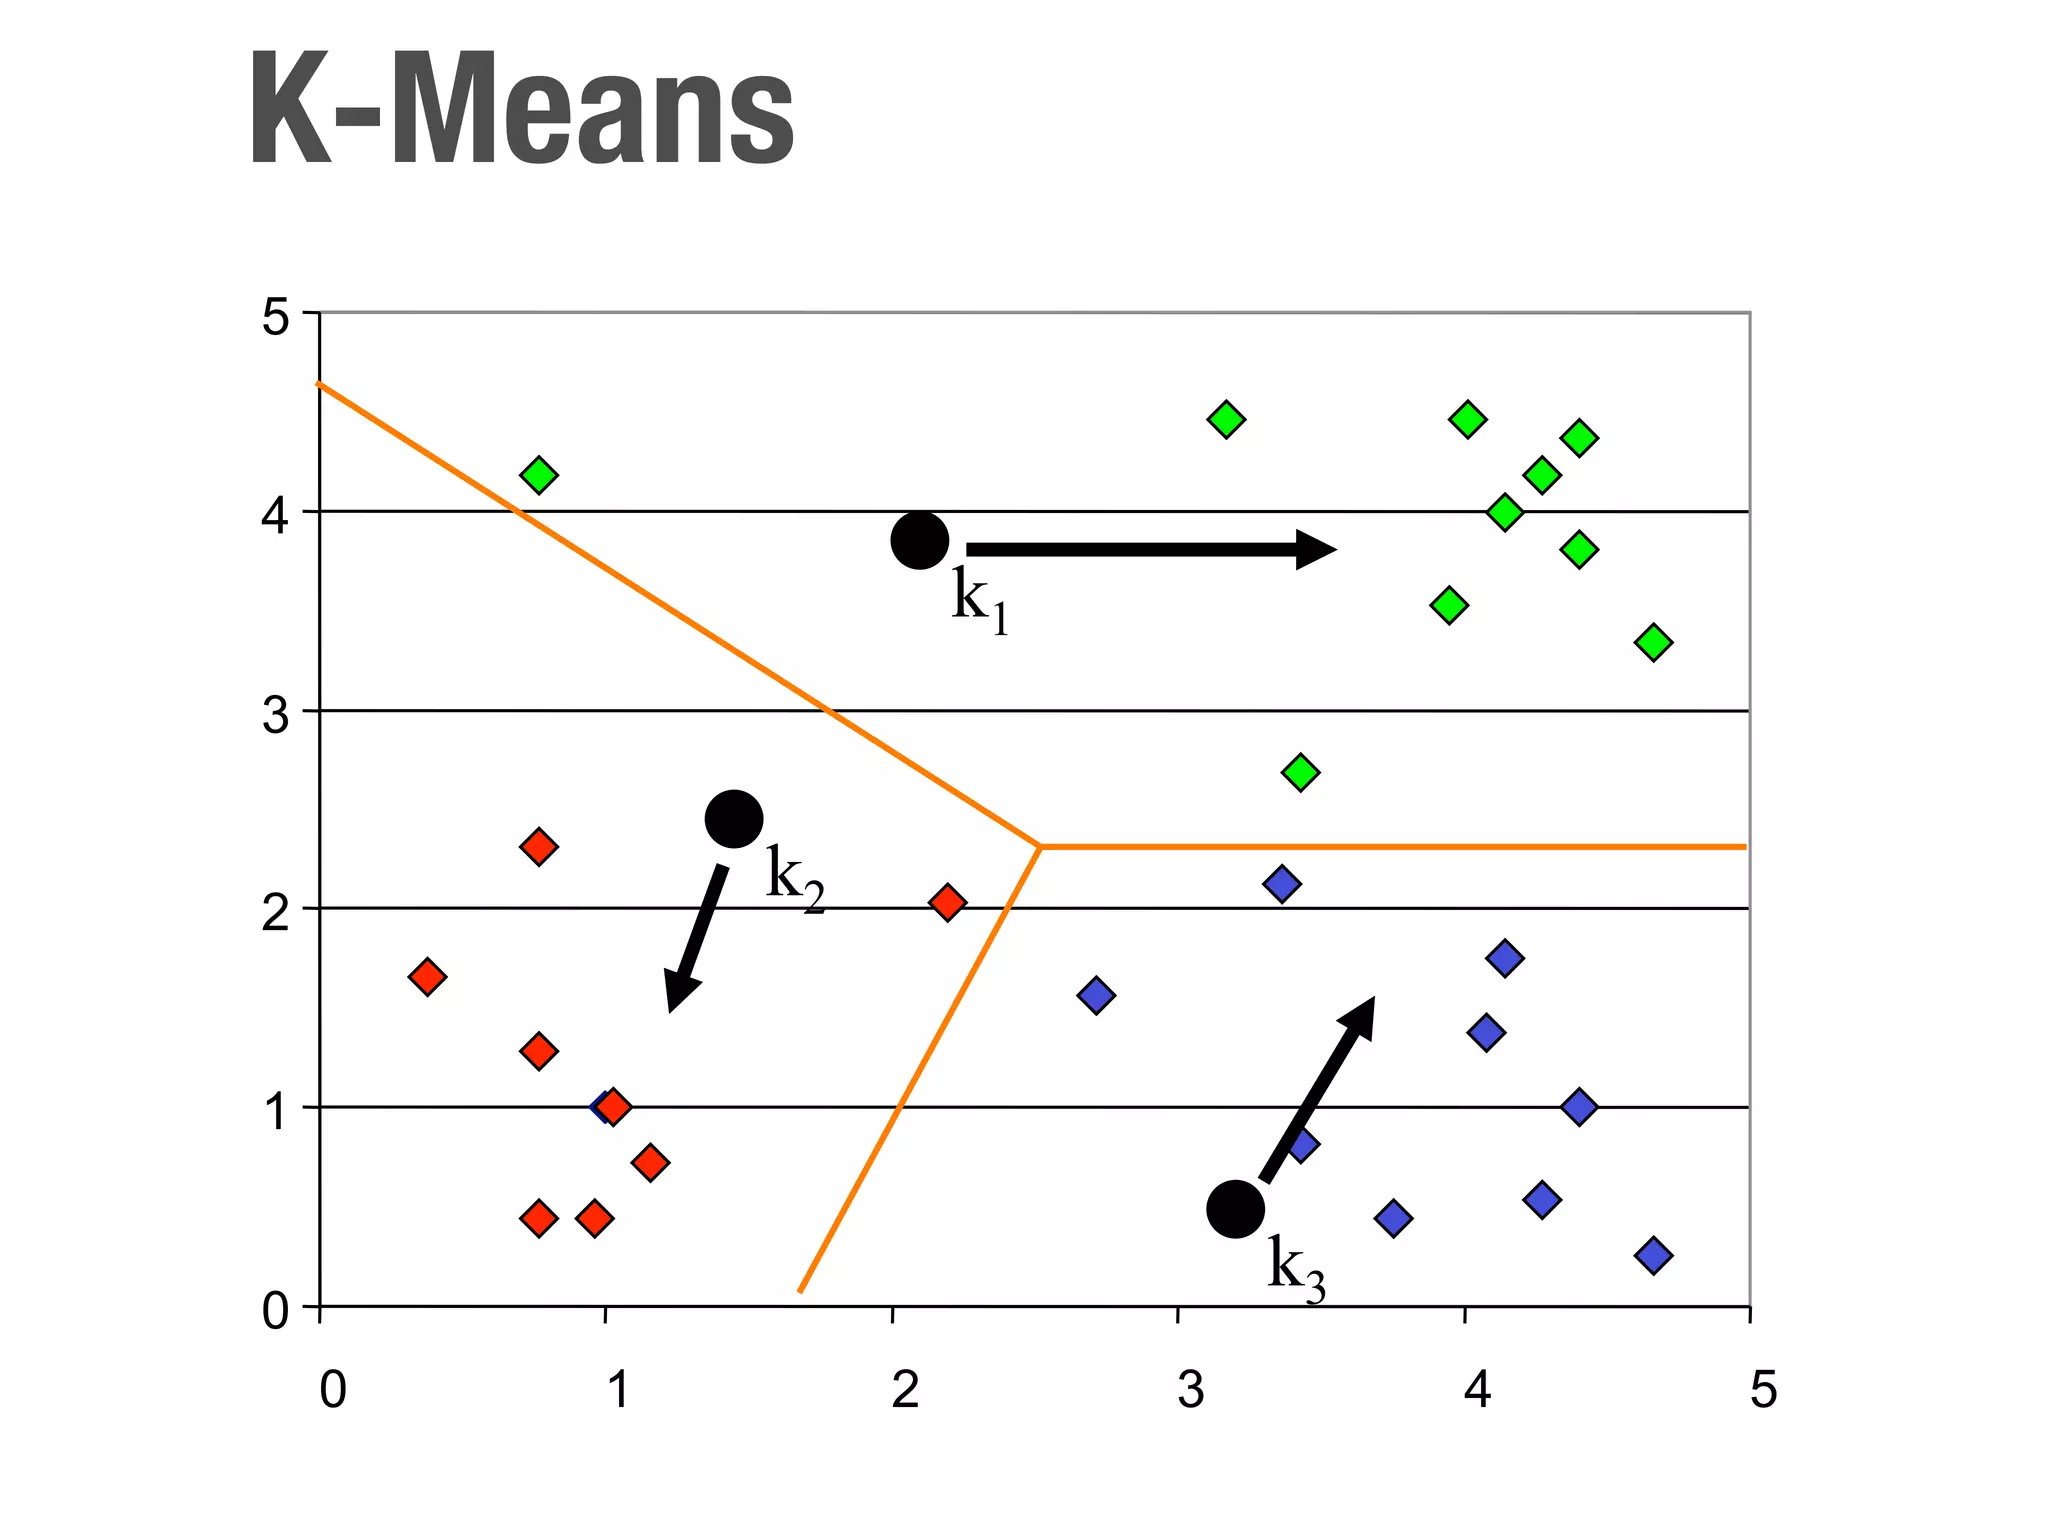
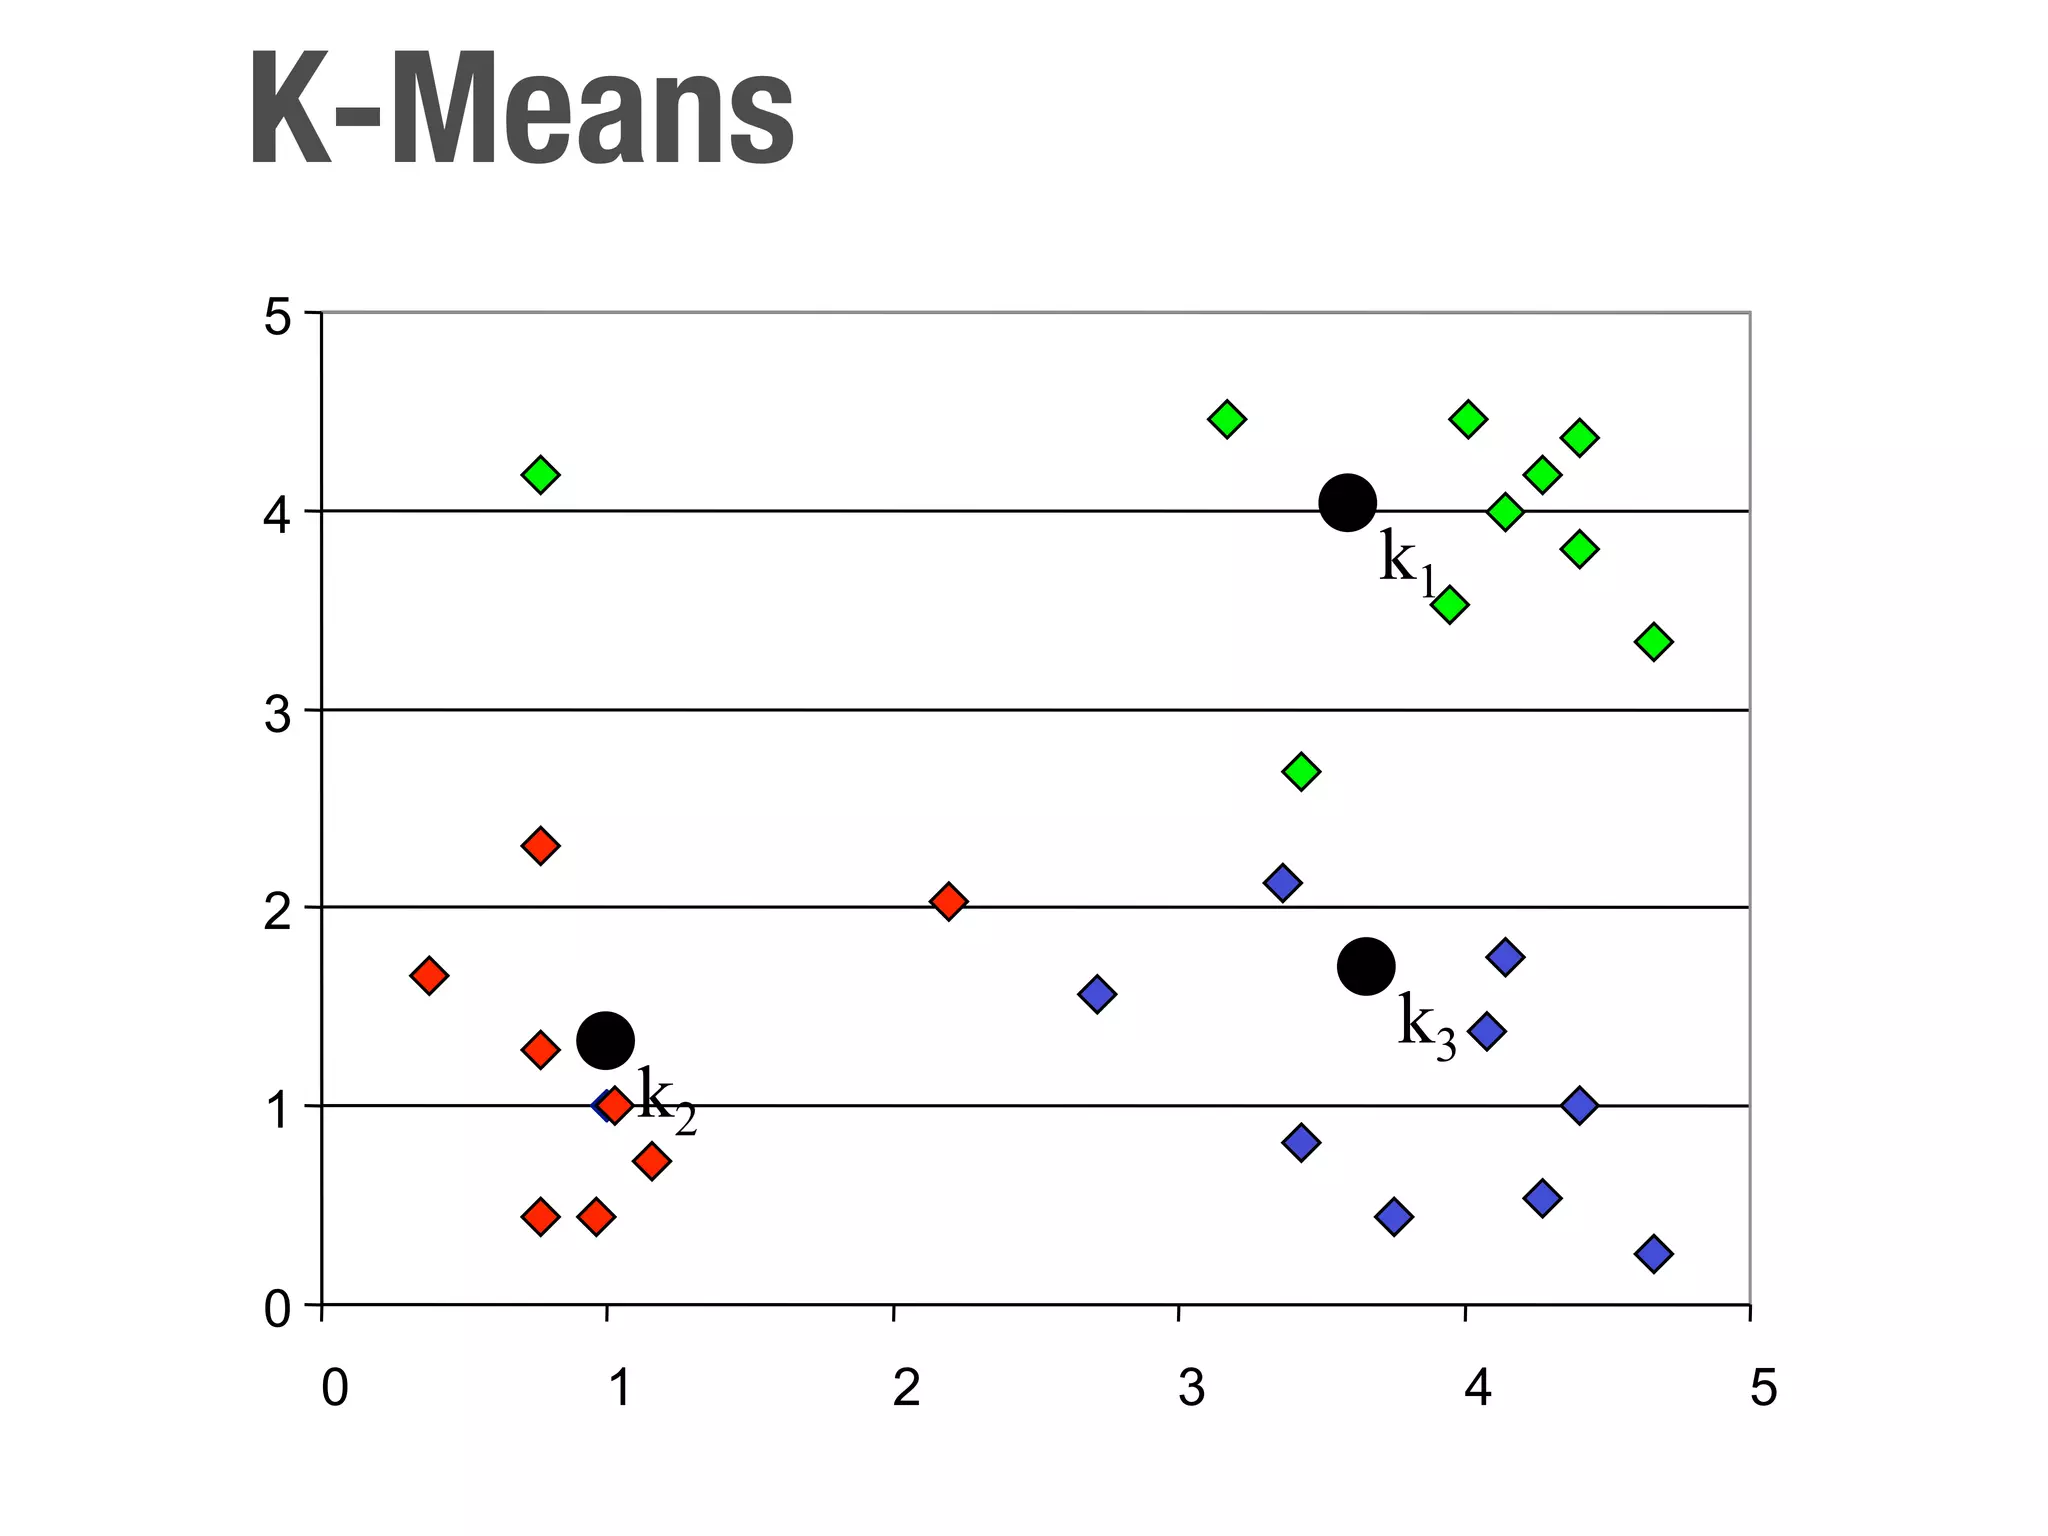
![Clustering
Input Data Output Clusters
Points Hard
OR
OR
Soft
Similarities OR
[ # of clusters ] Hierarchical](https://image.slidesharecdn.com/04-data-miningr1-120330025854-phpapp01/75/Data-Mining-16-2048.jpg)
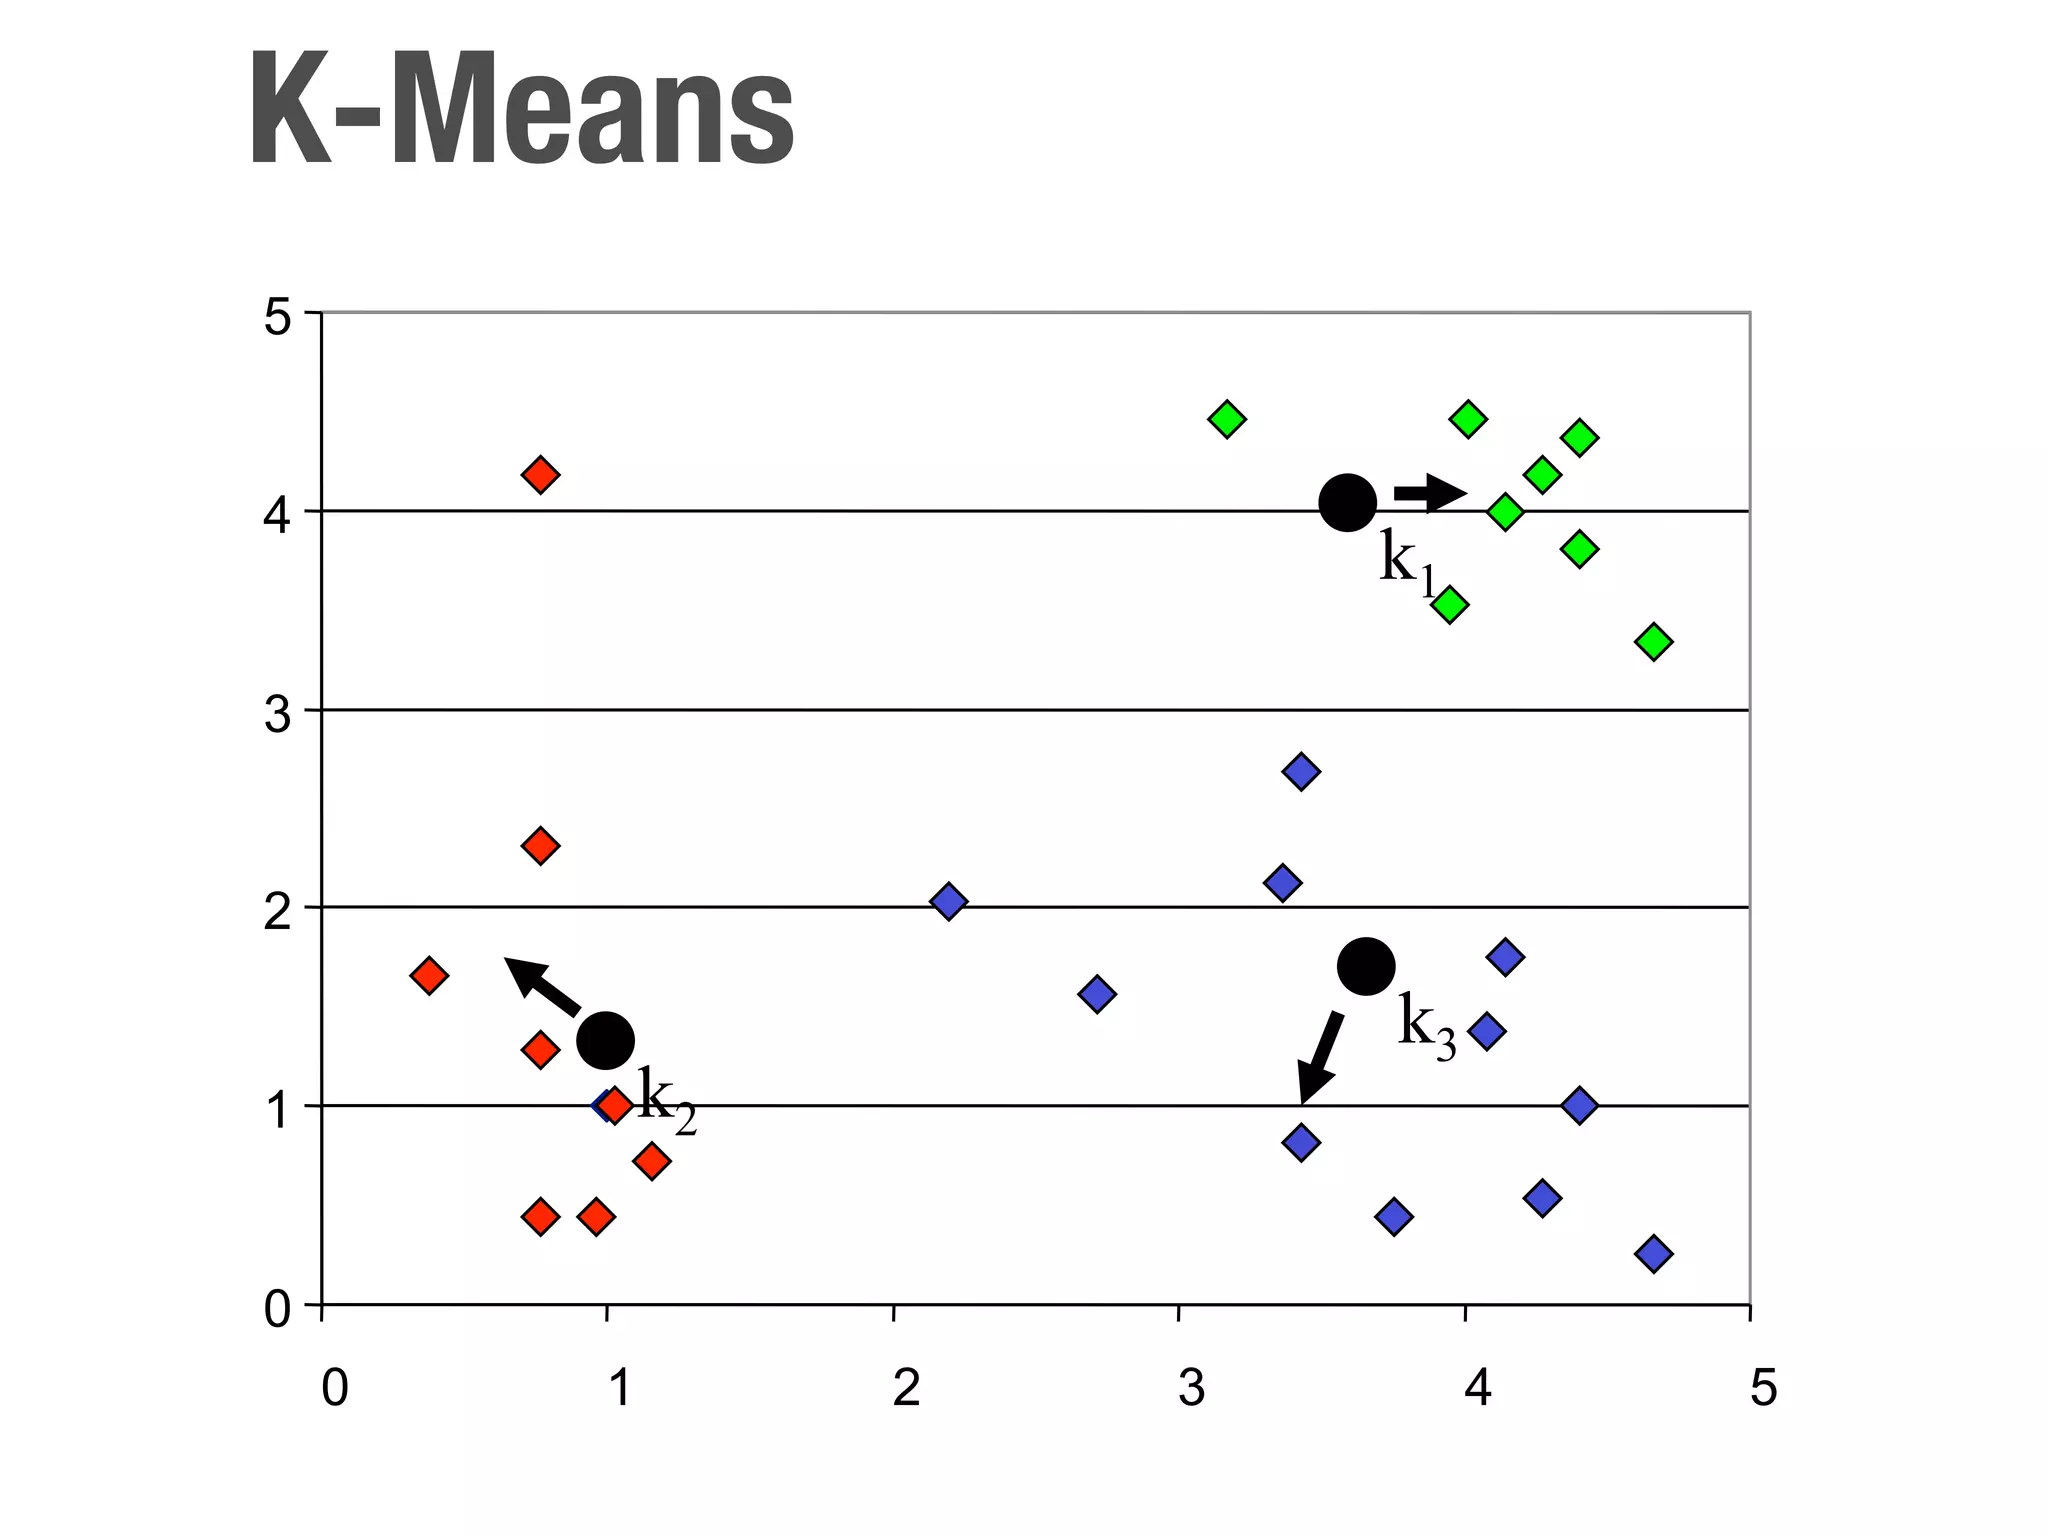
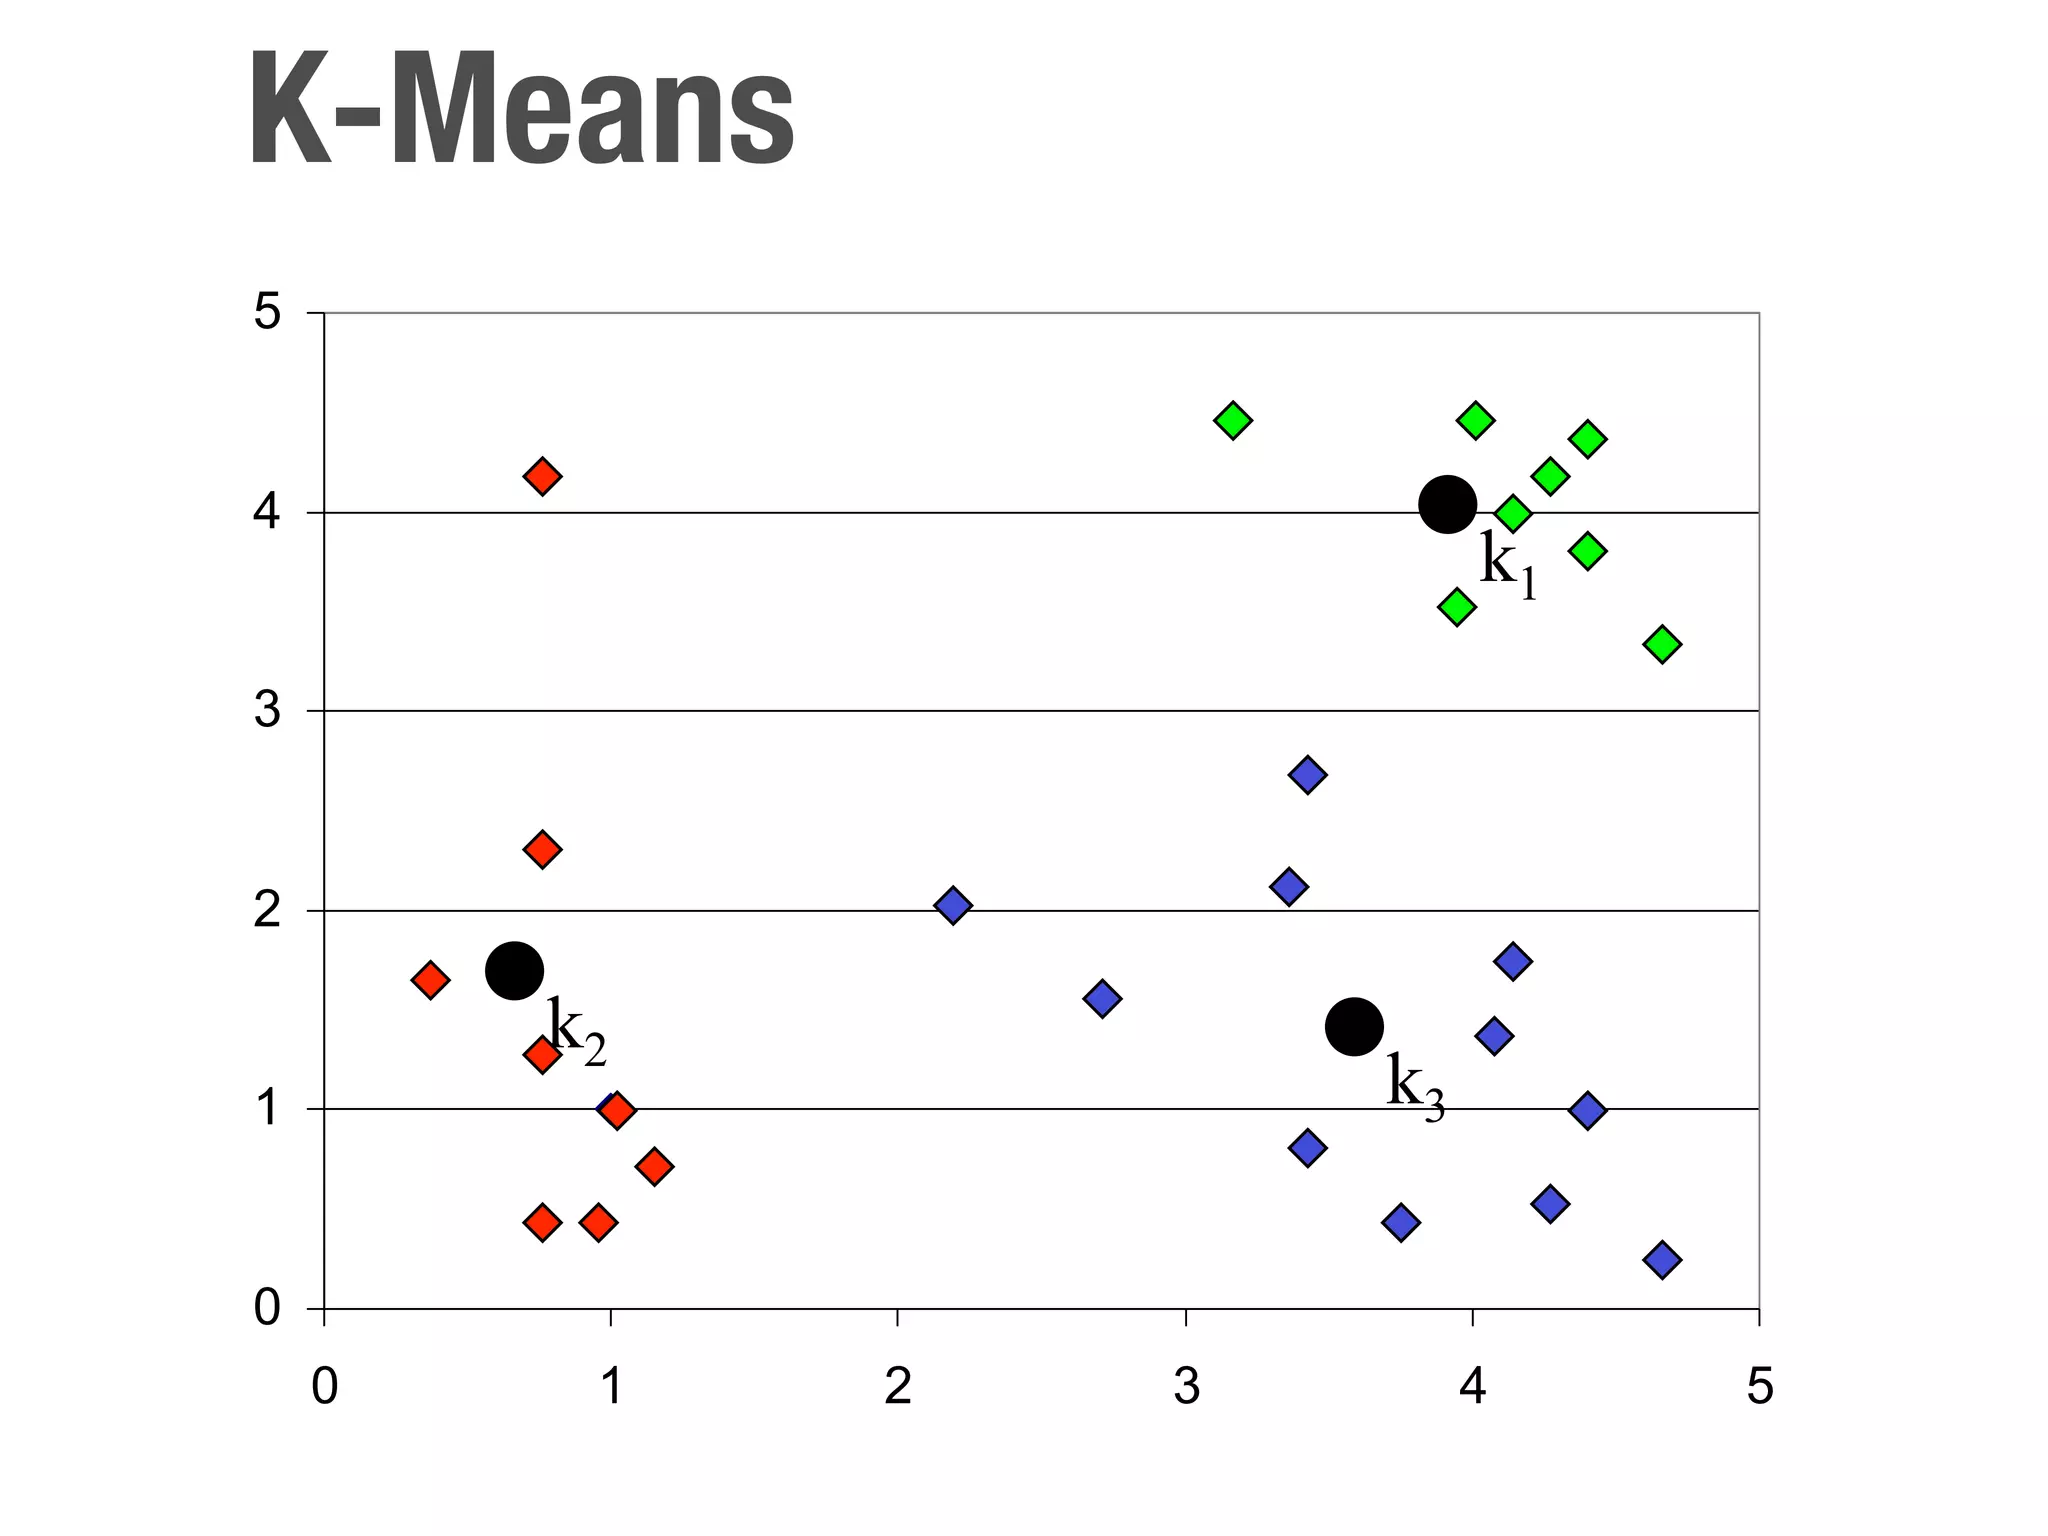
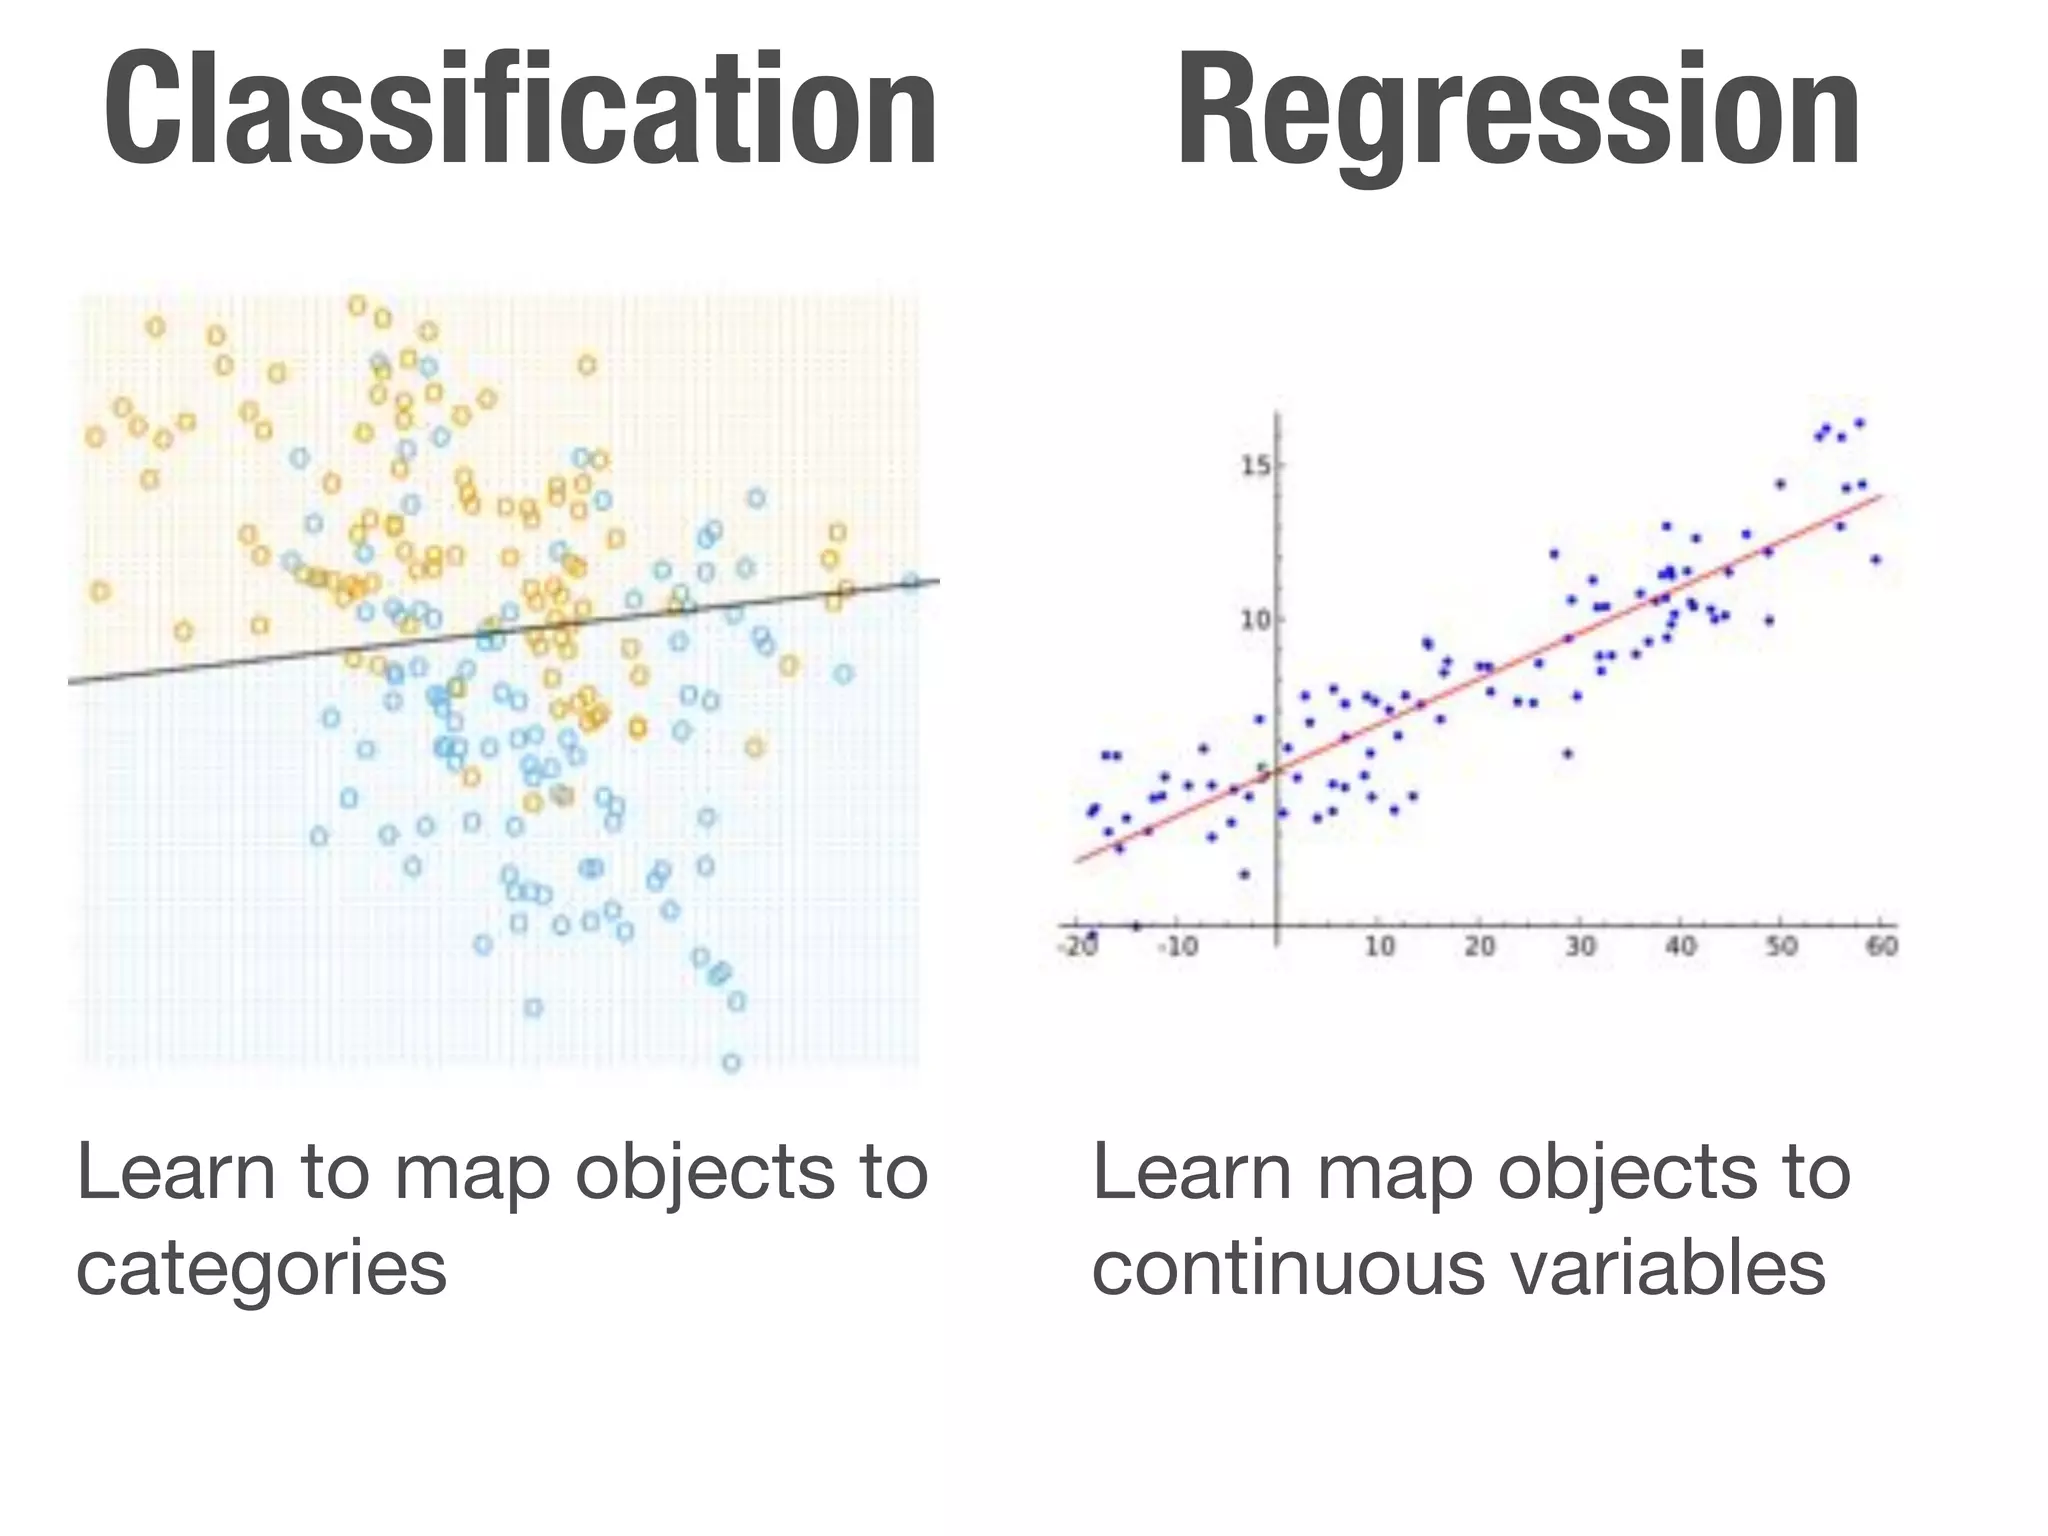

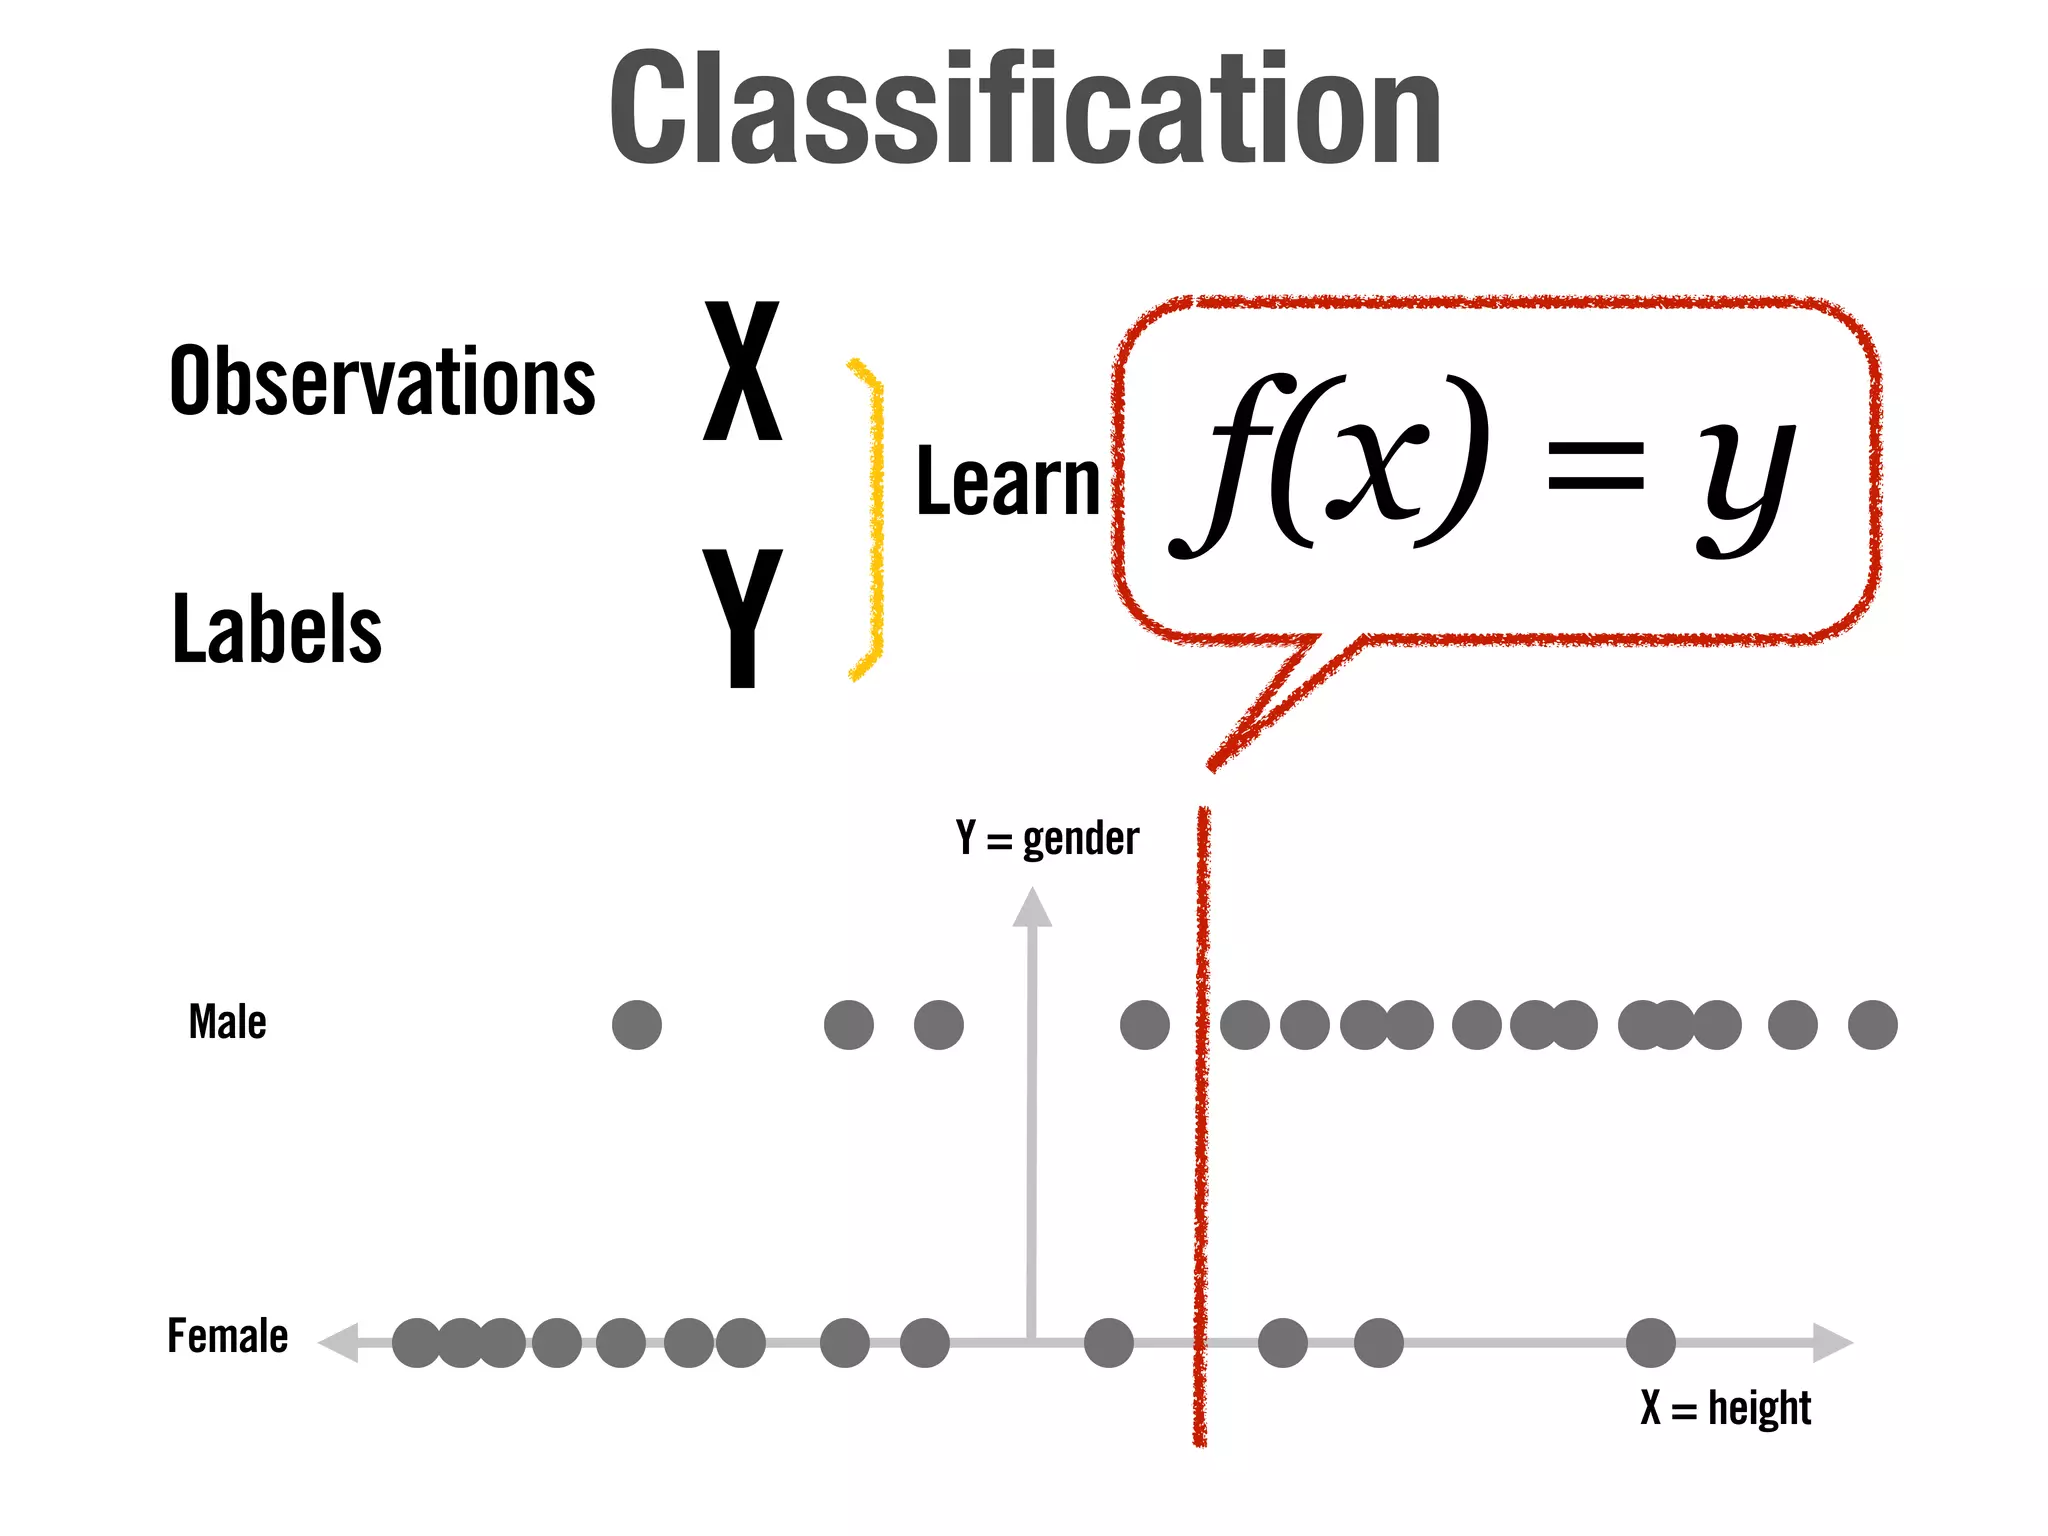
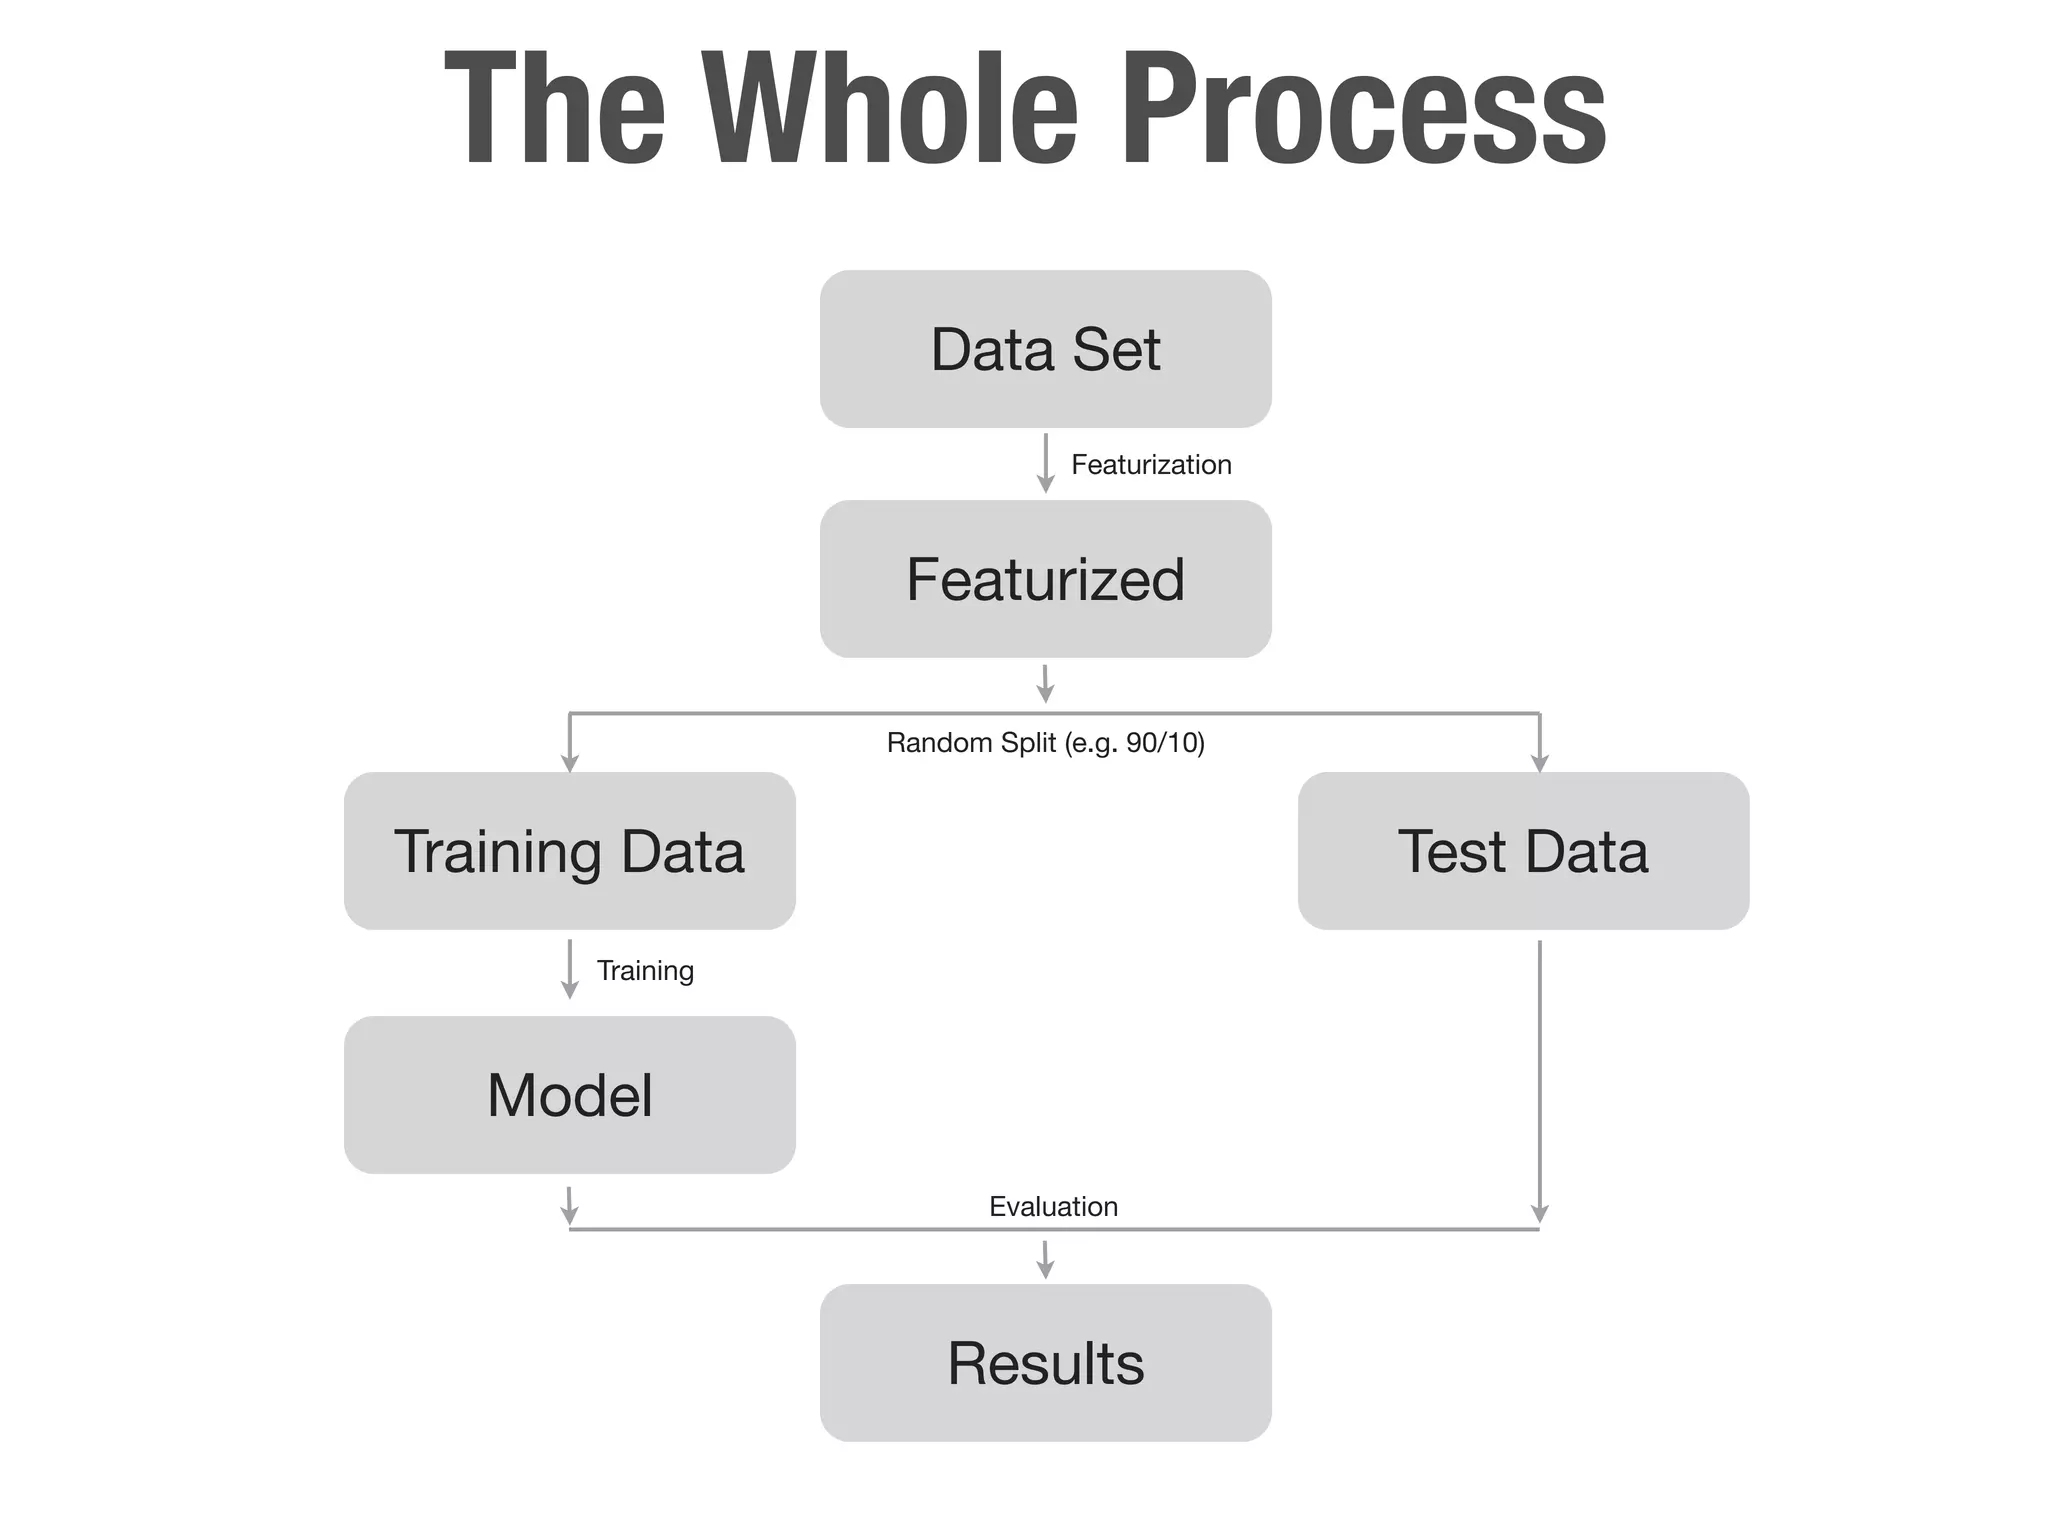
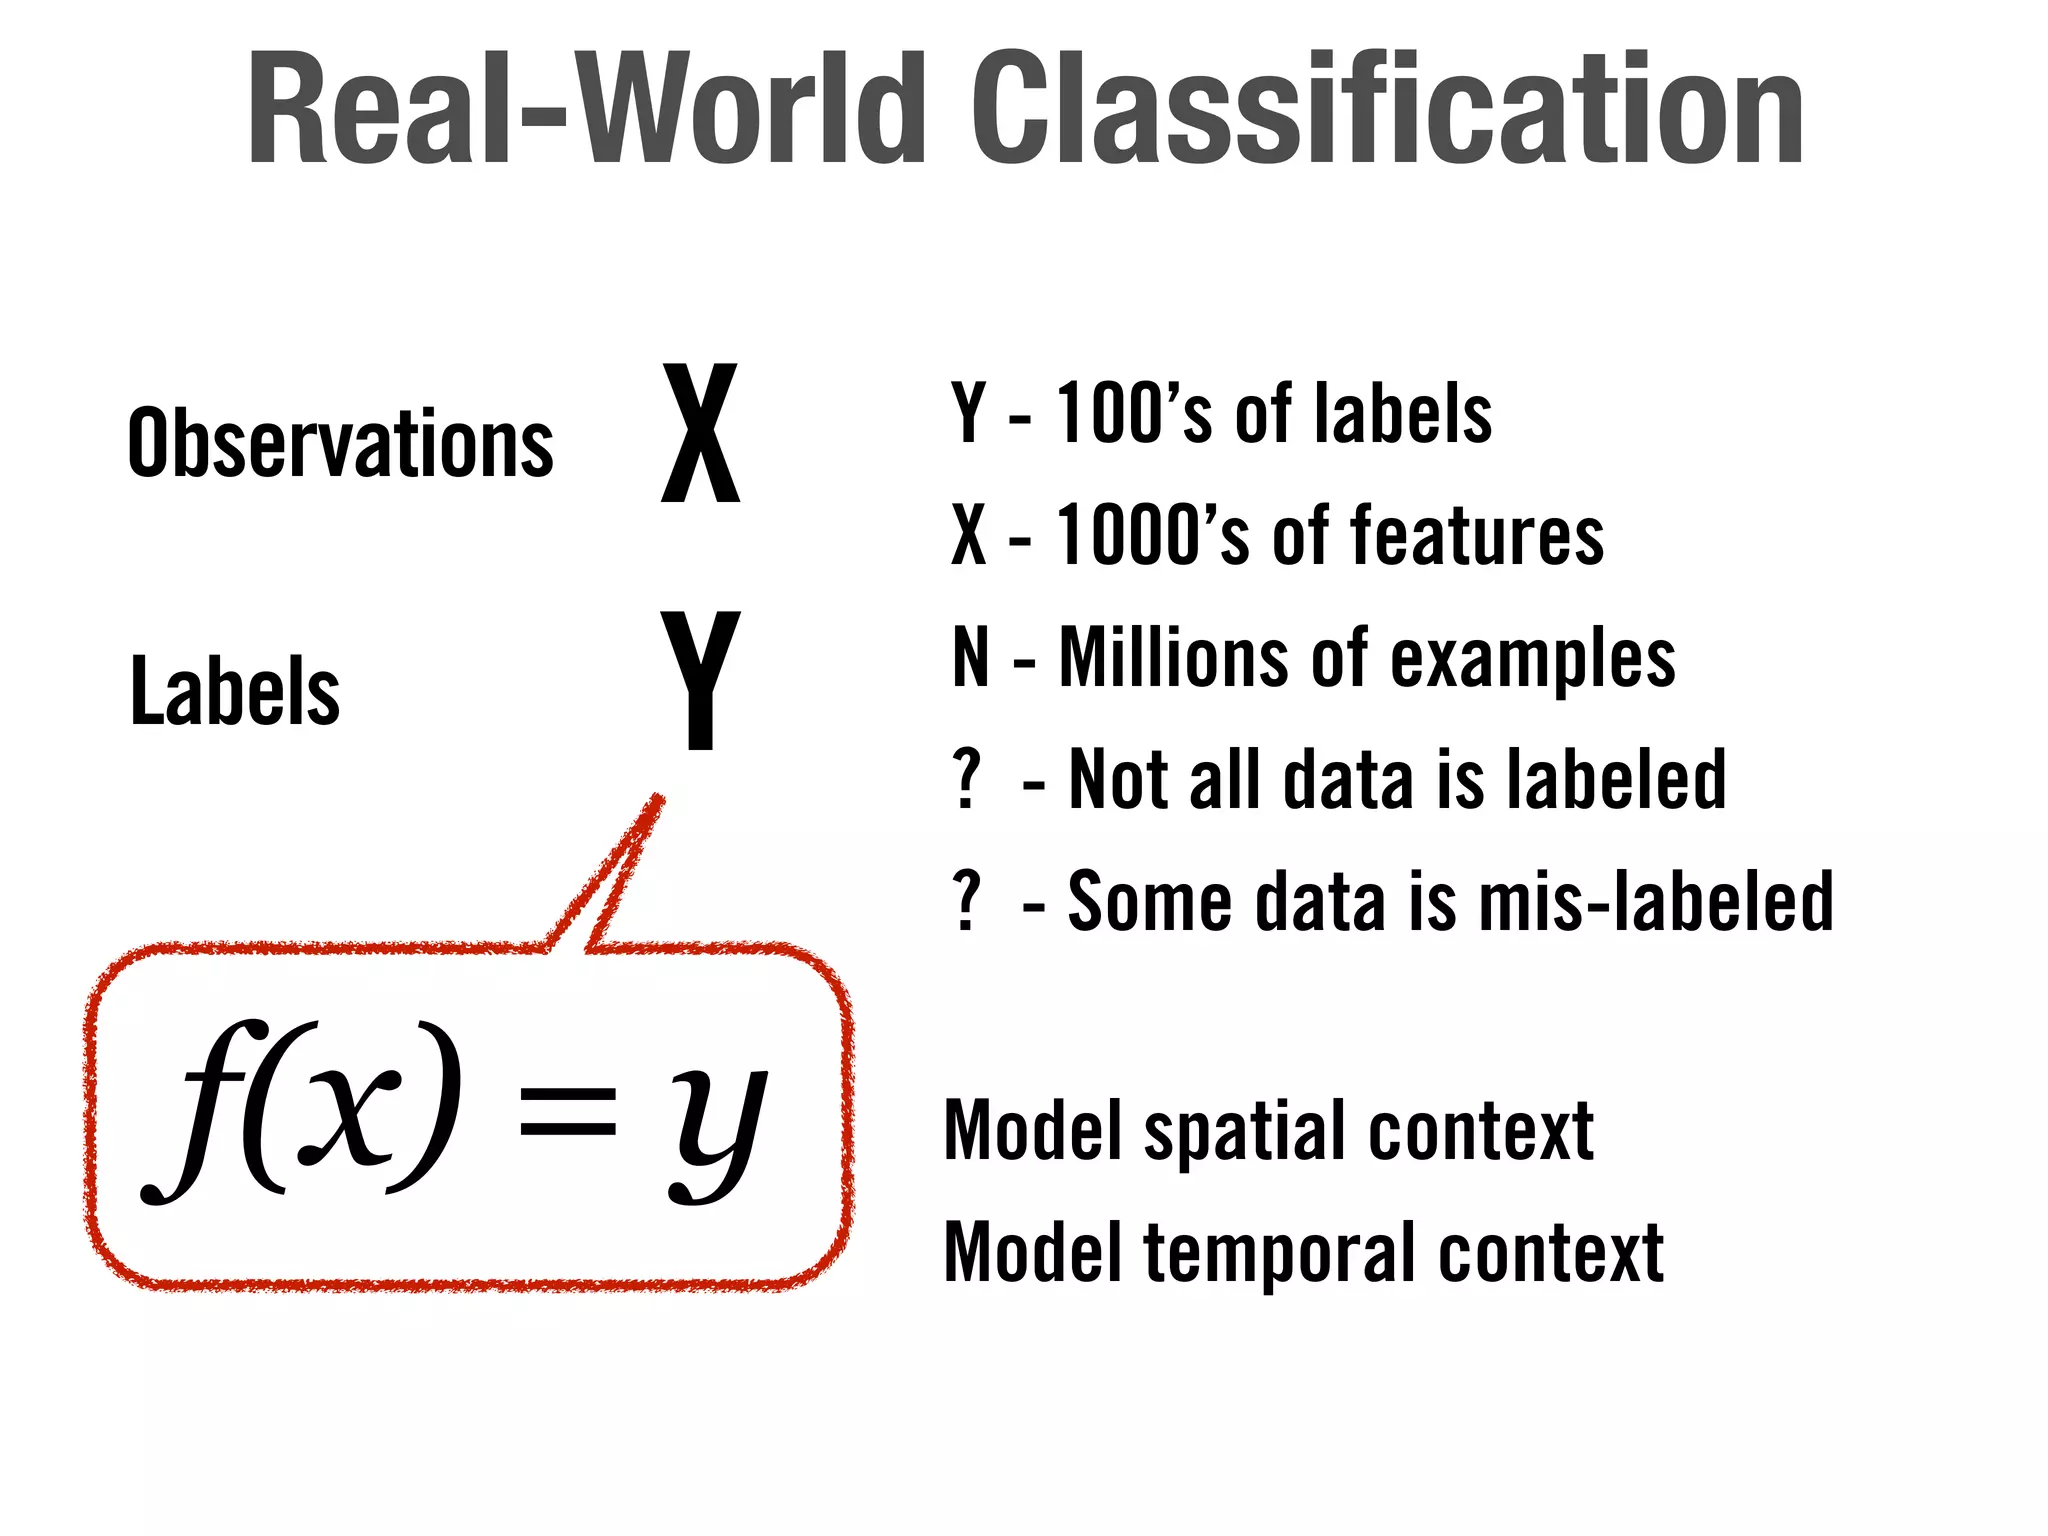
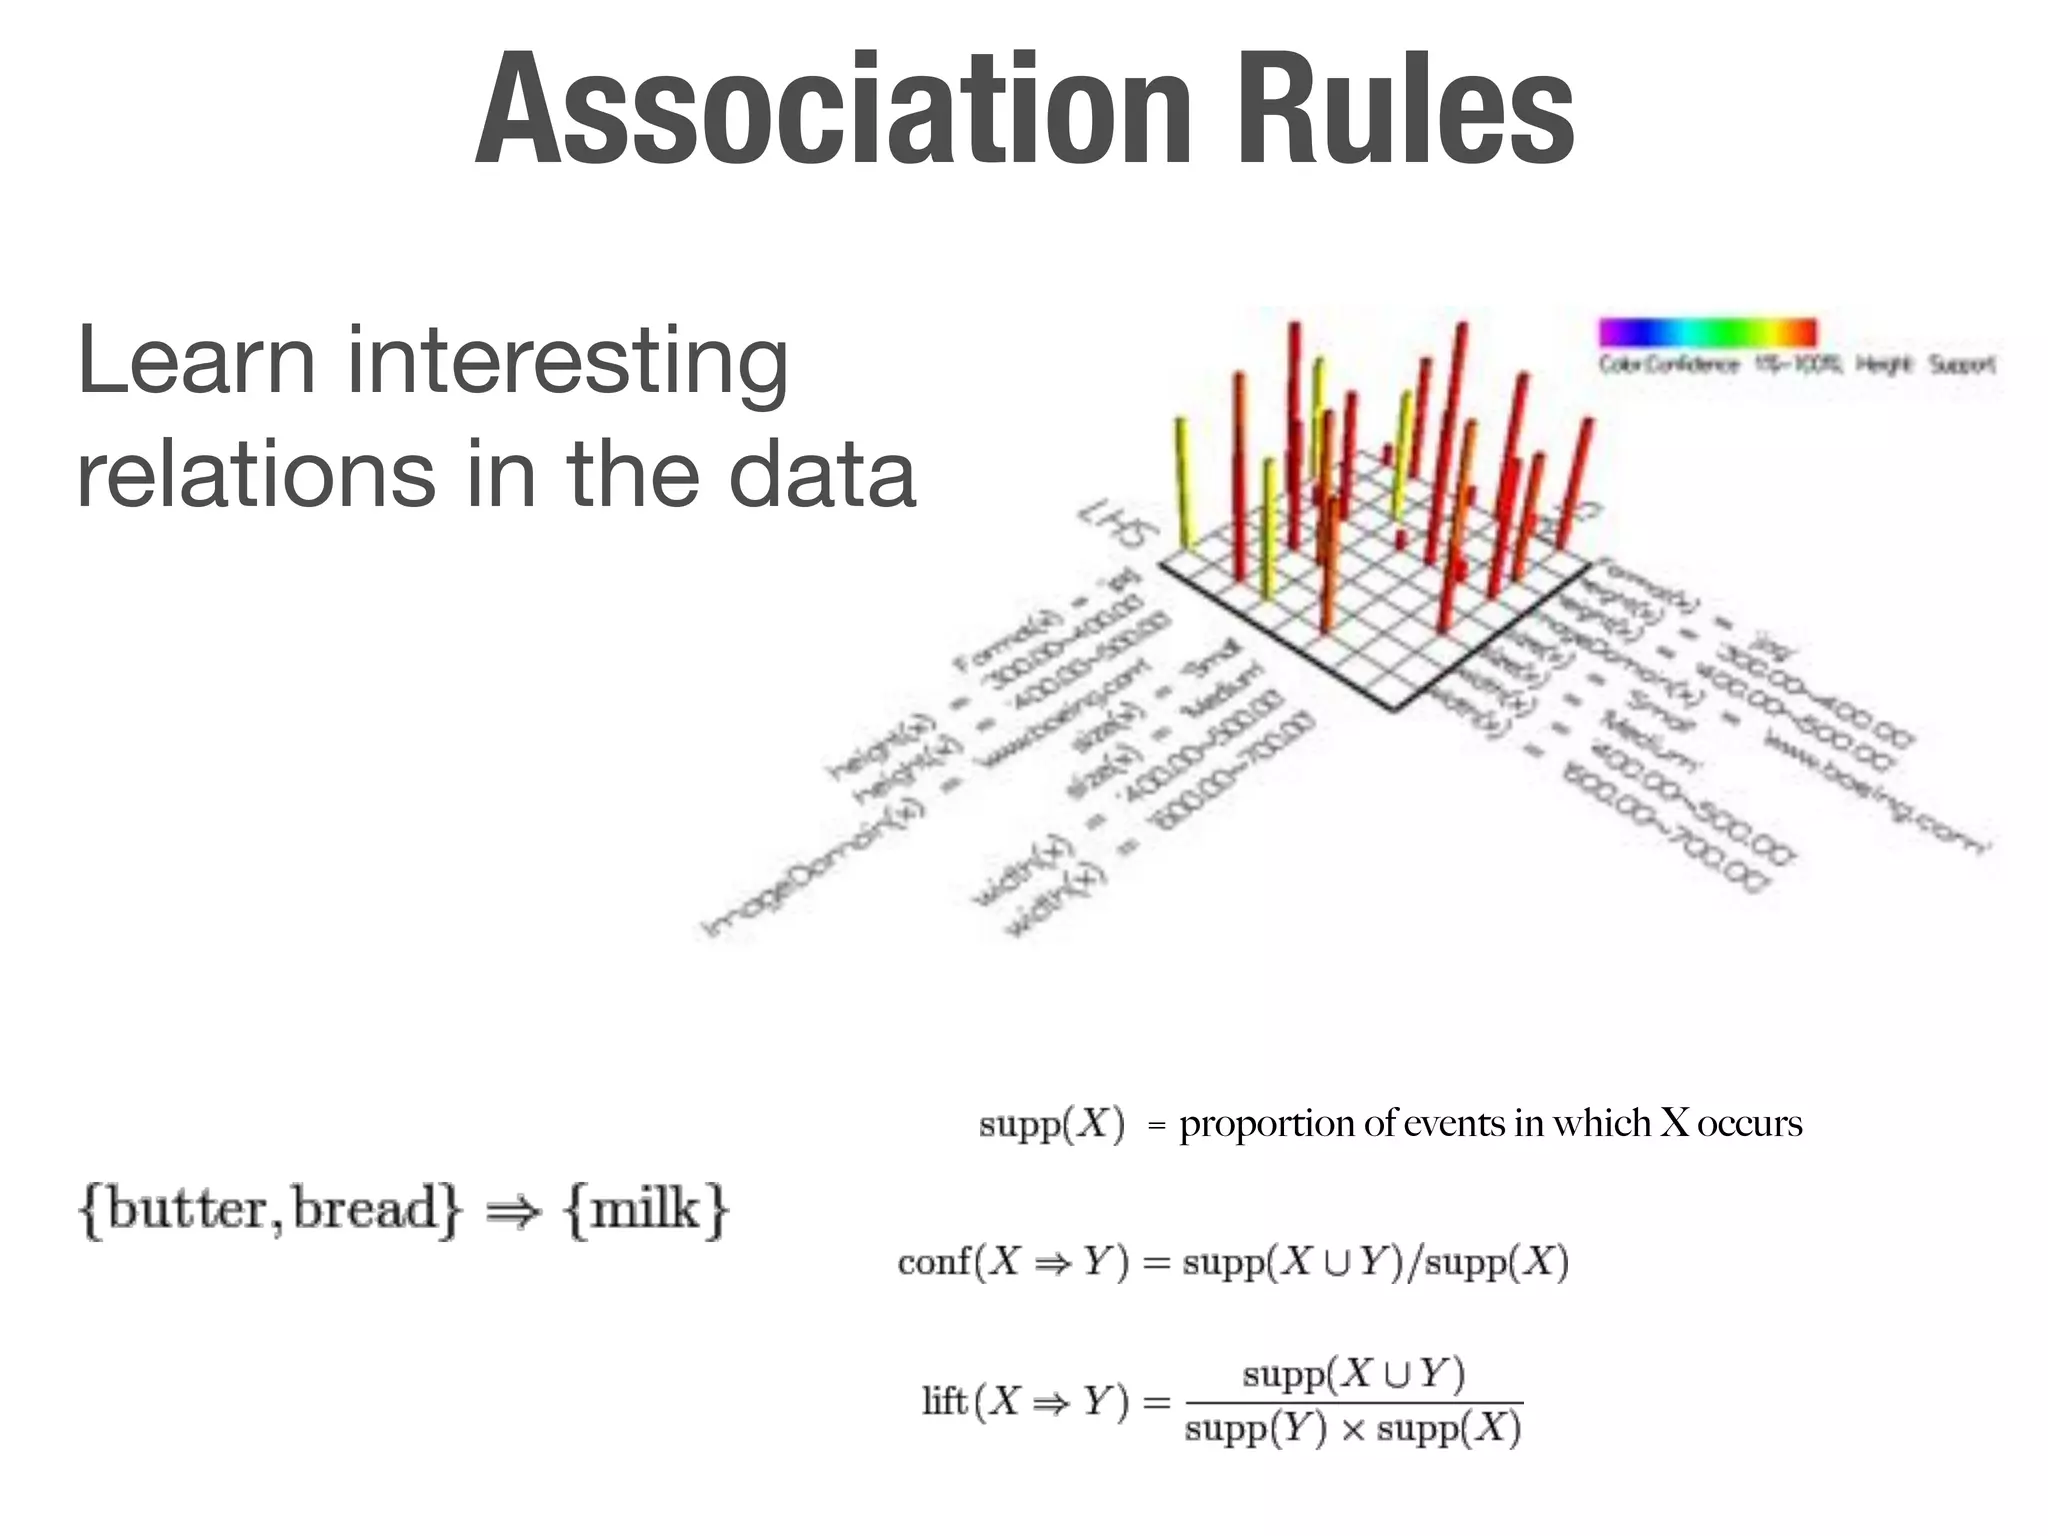
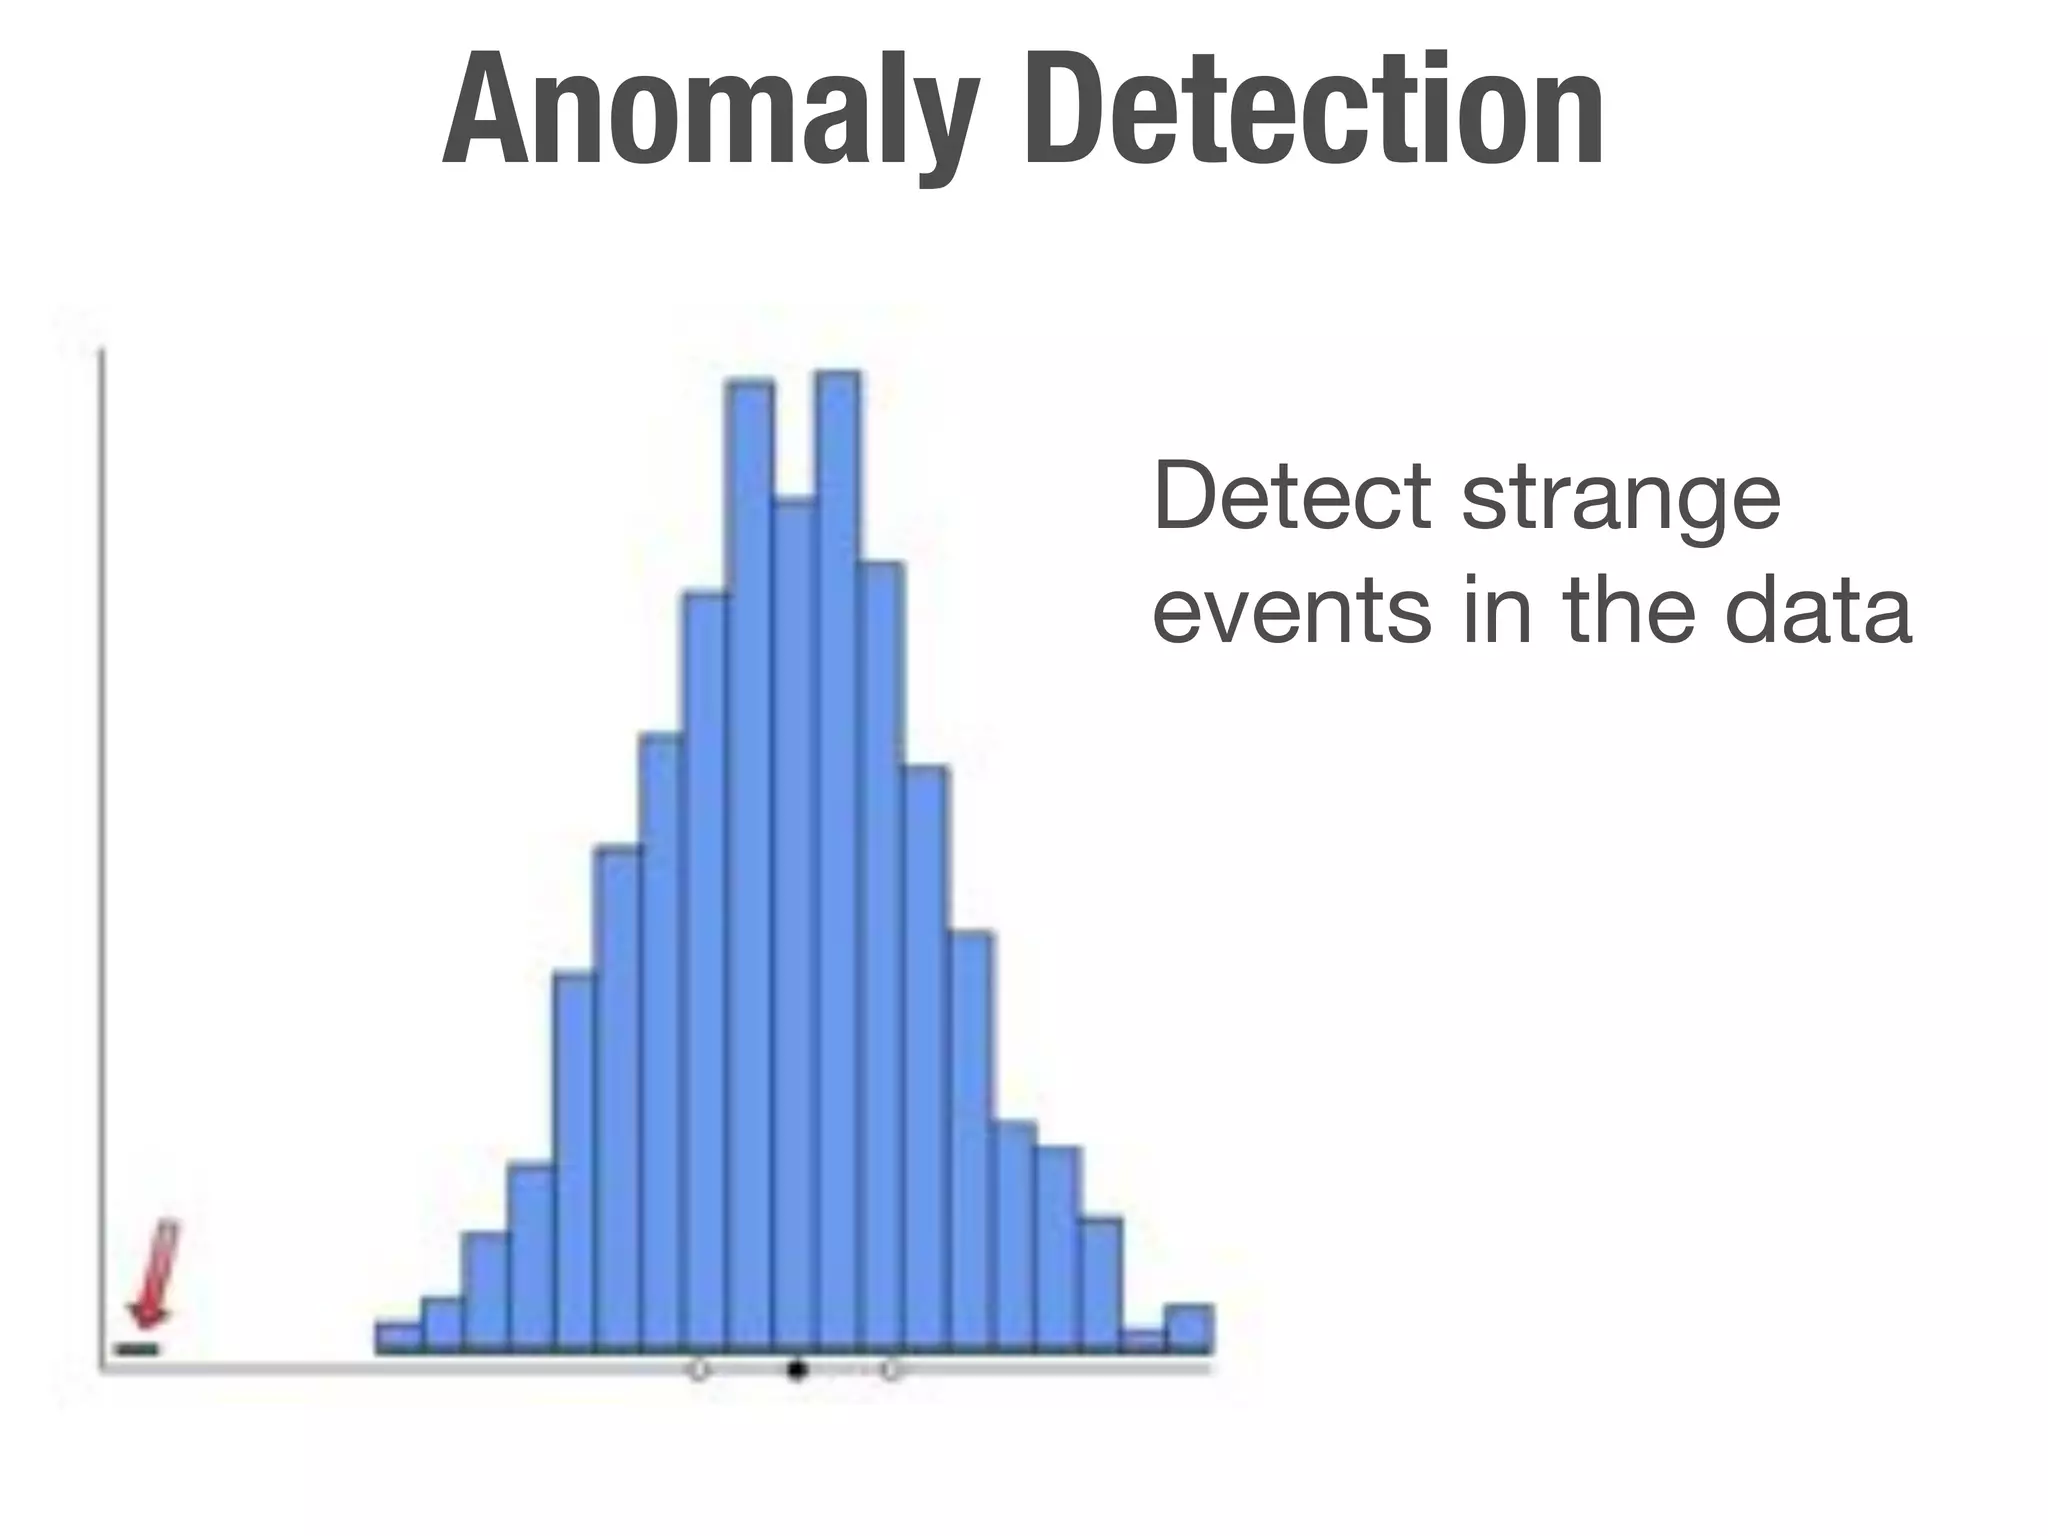


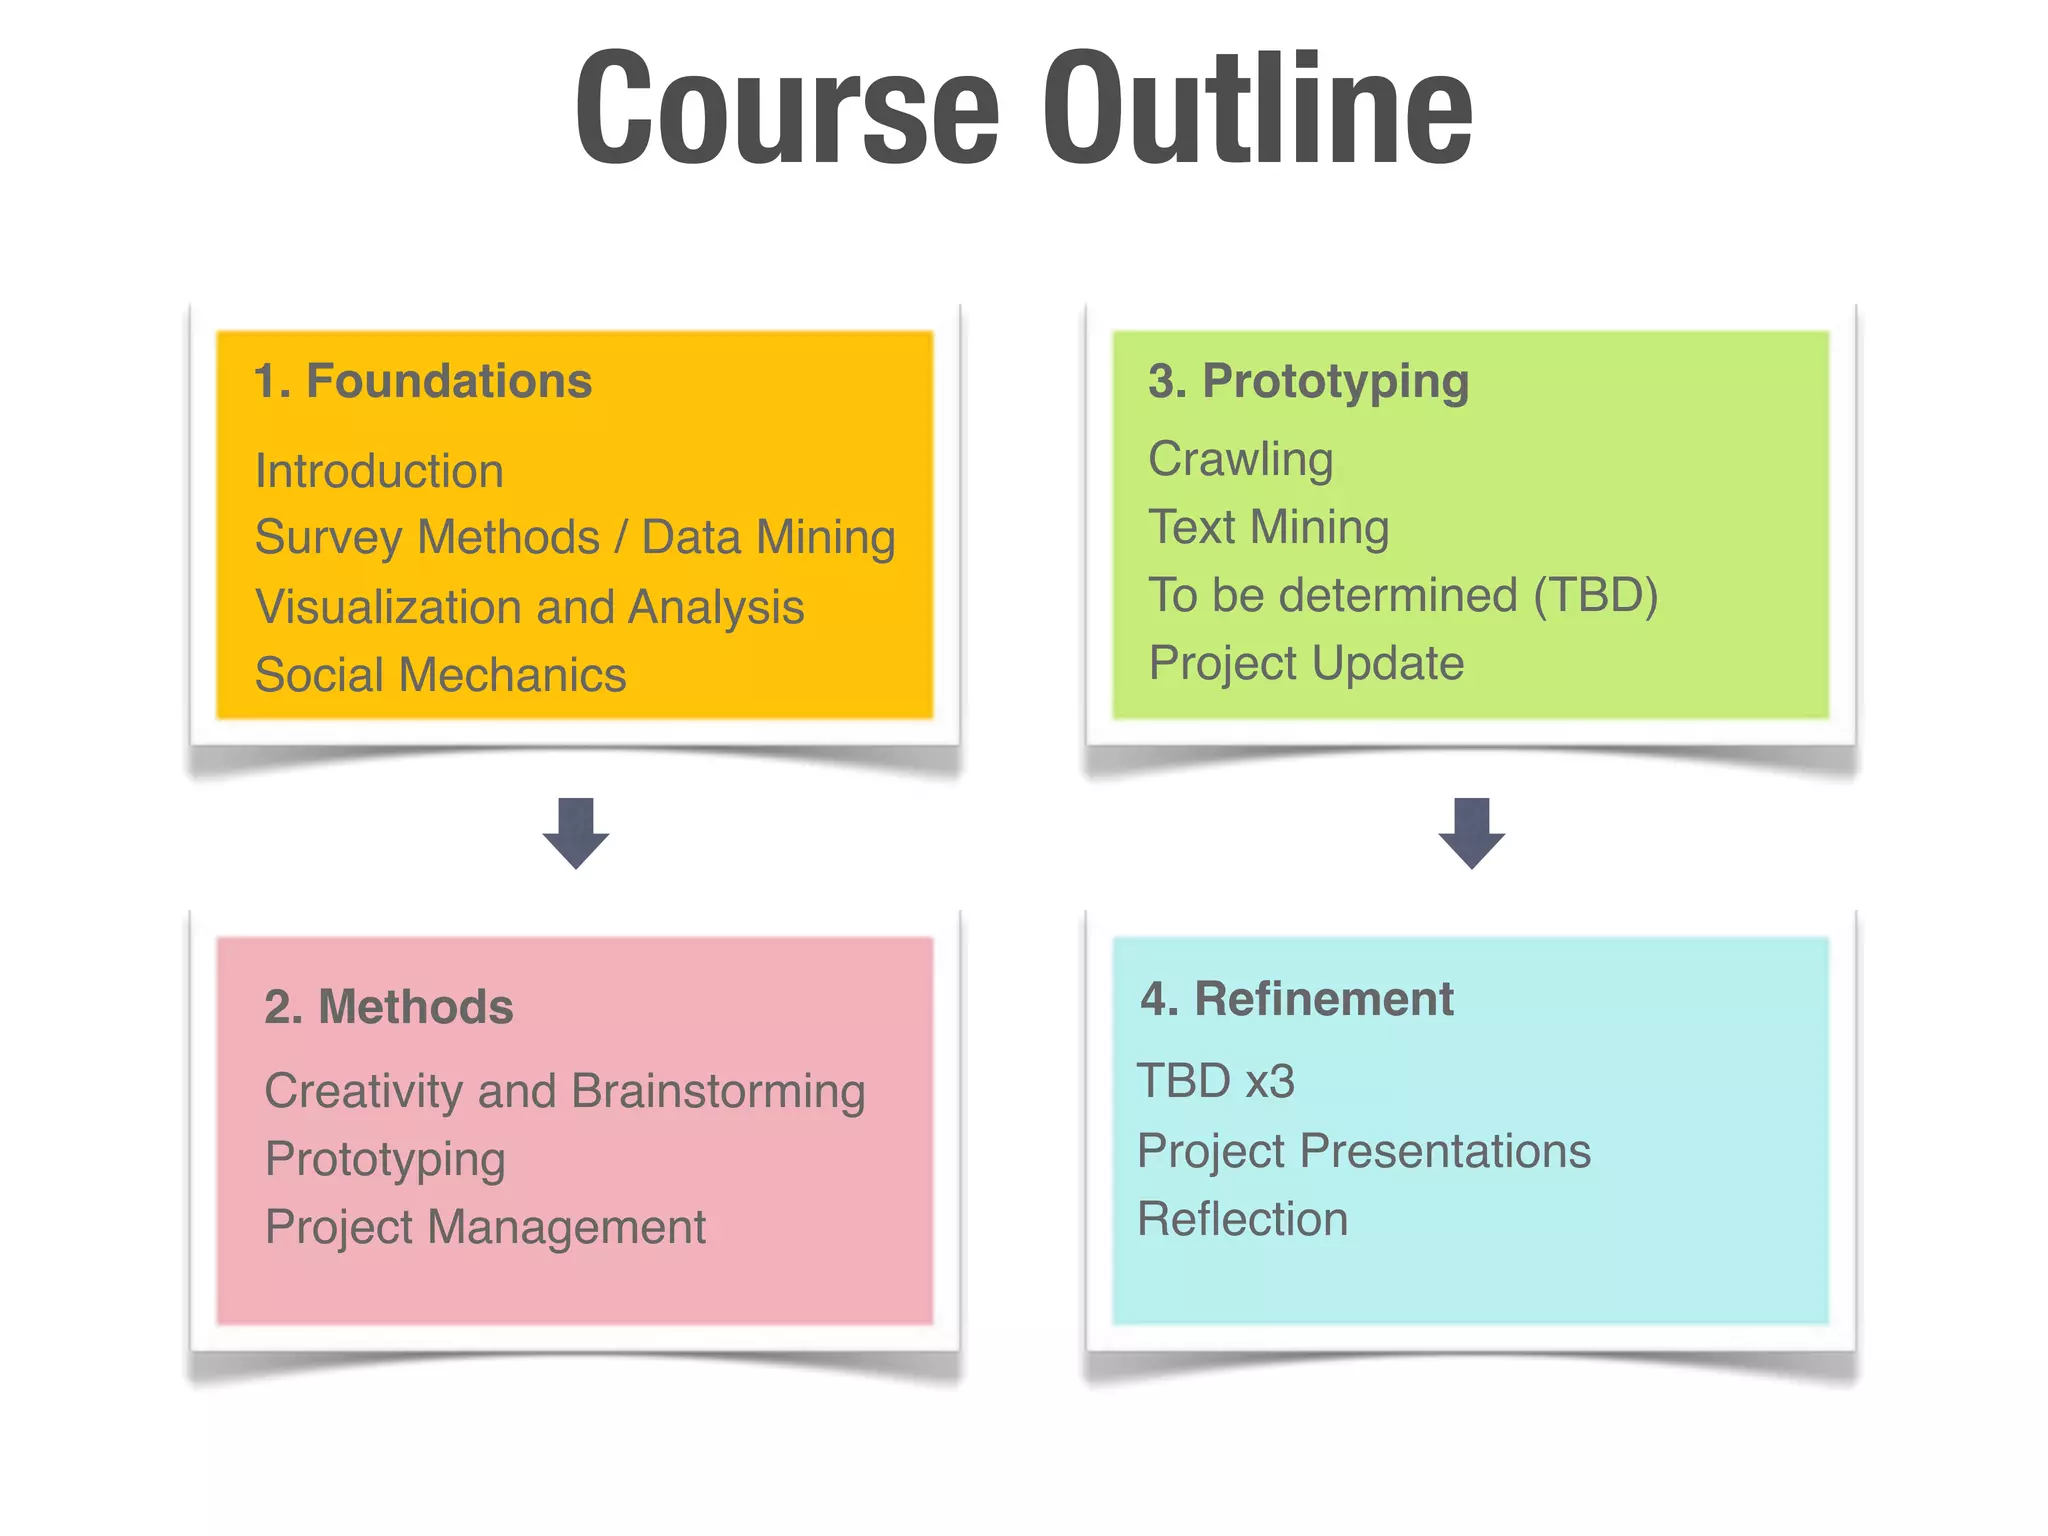
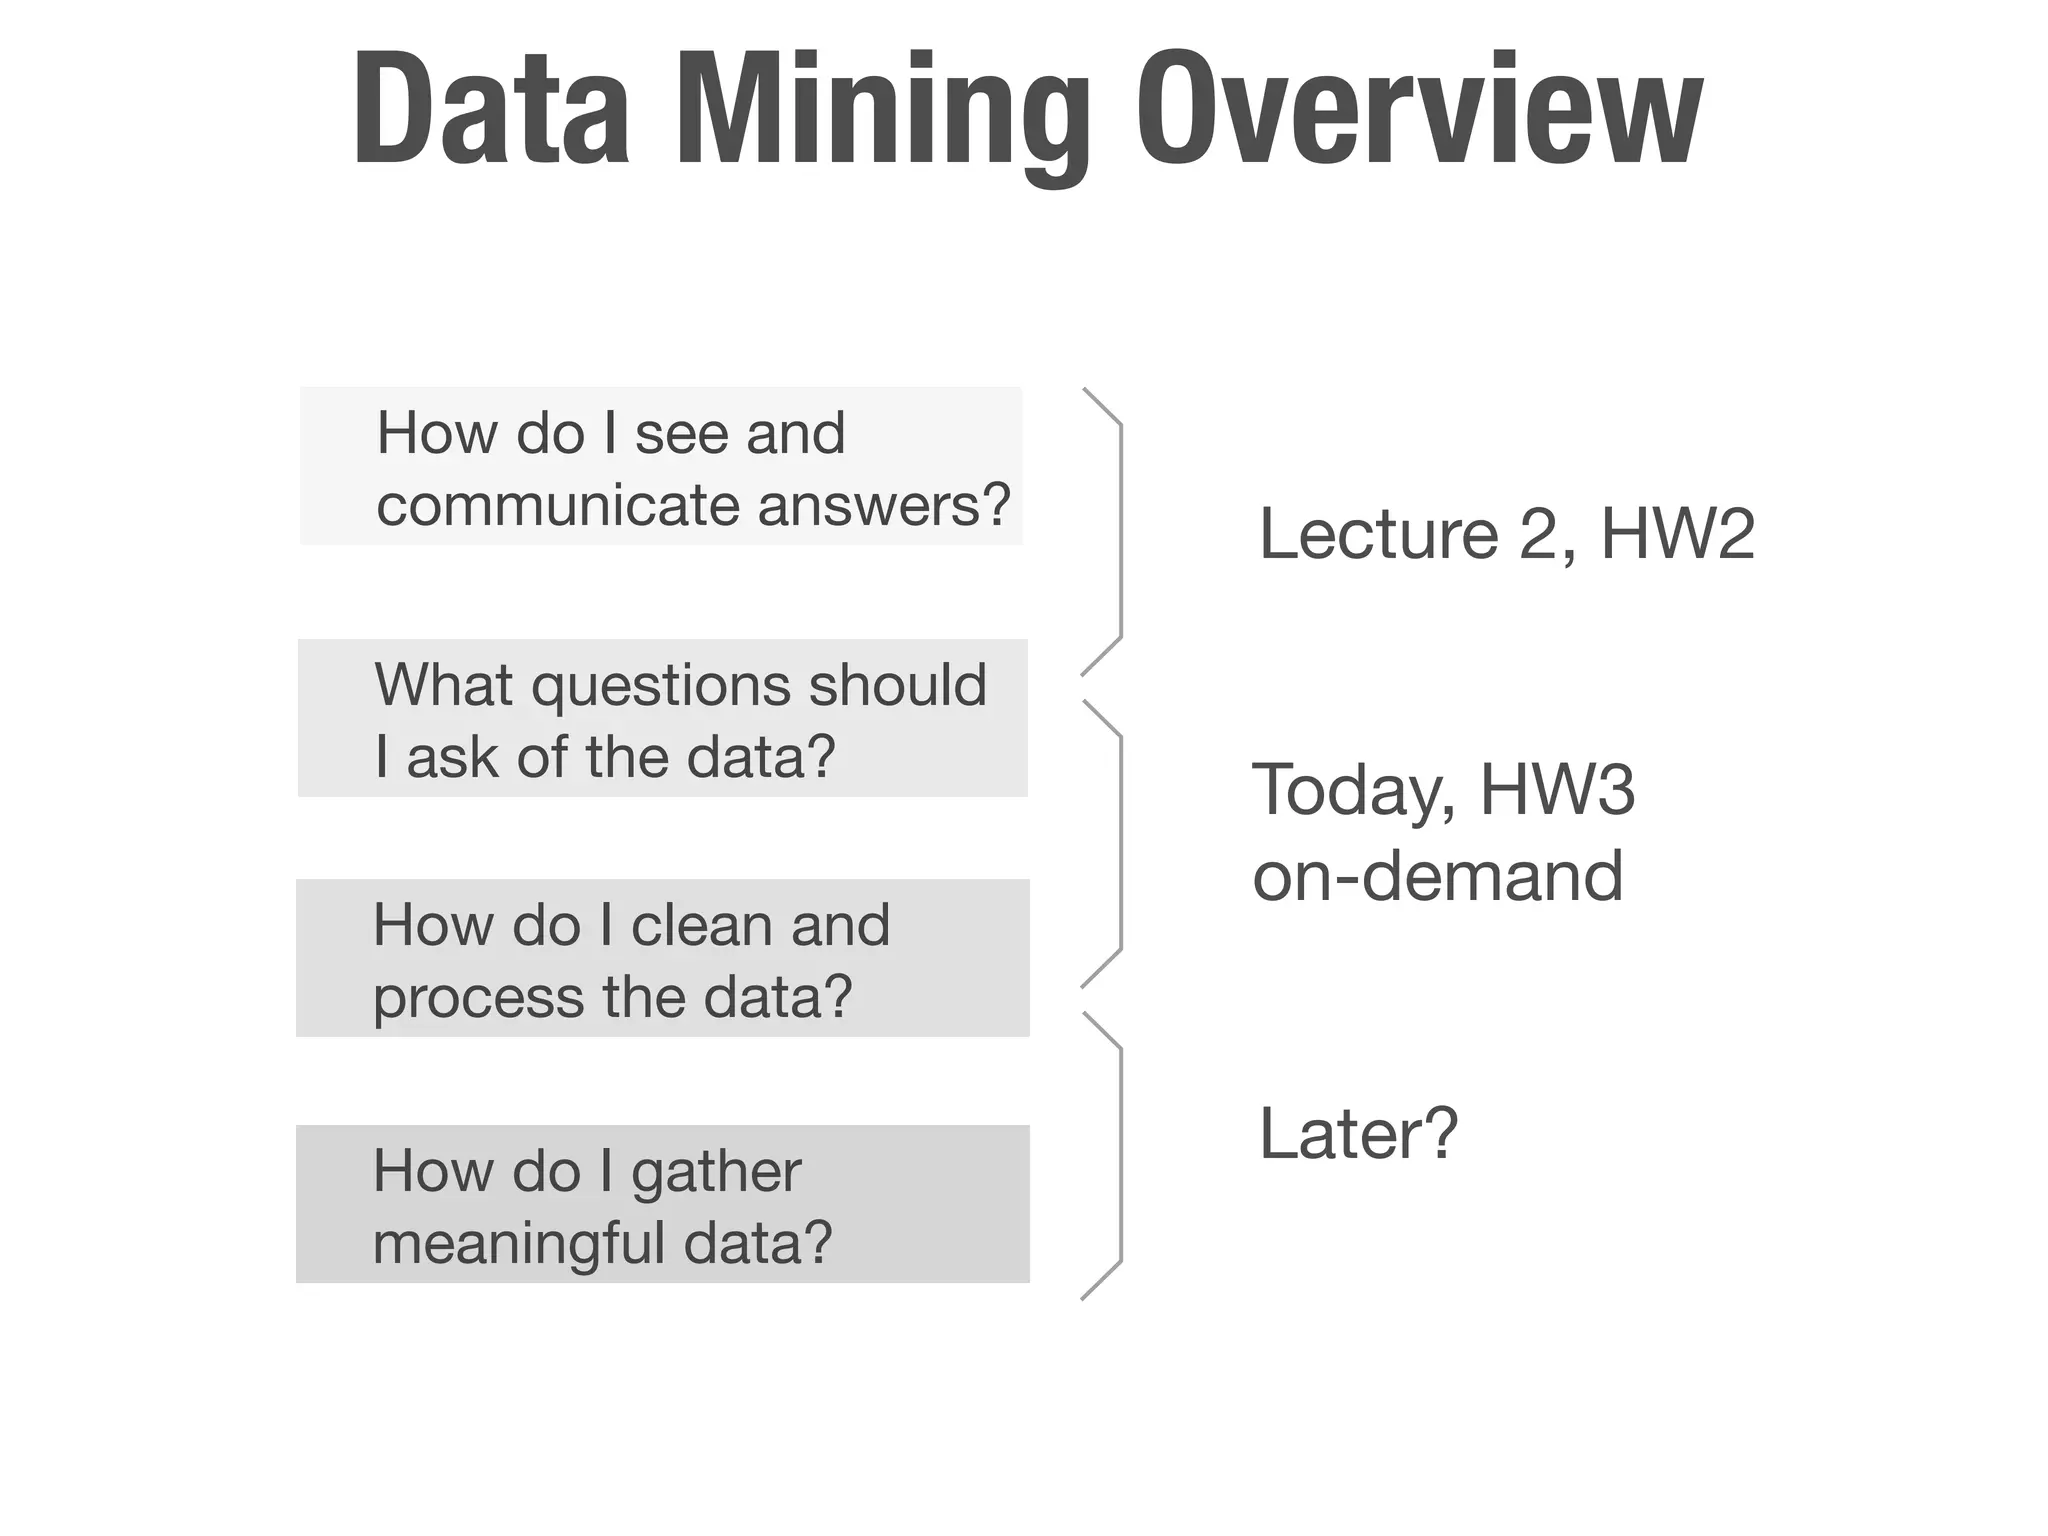
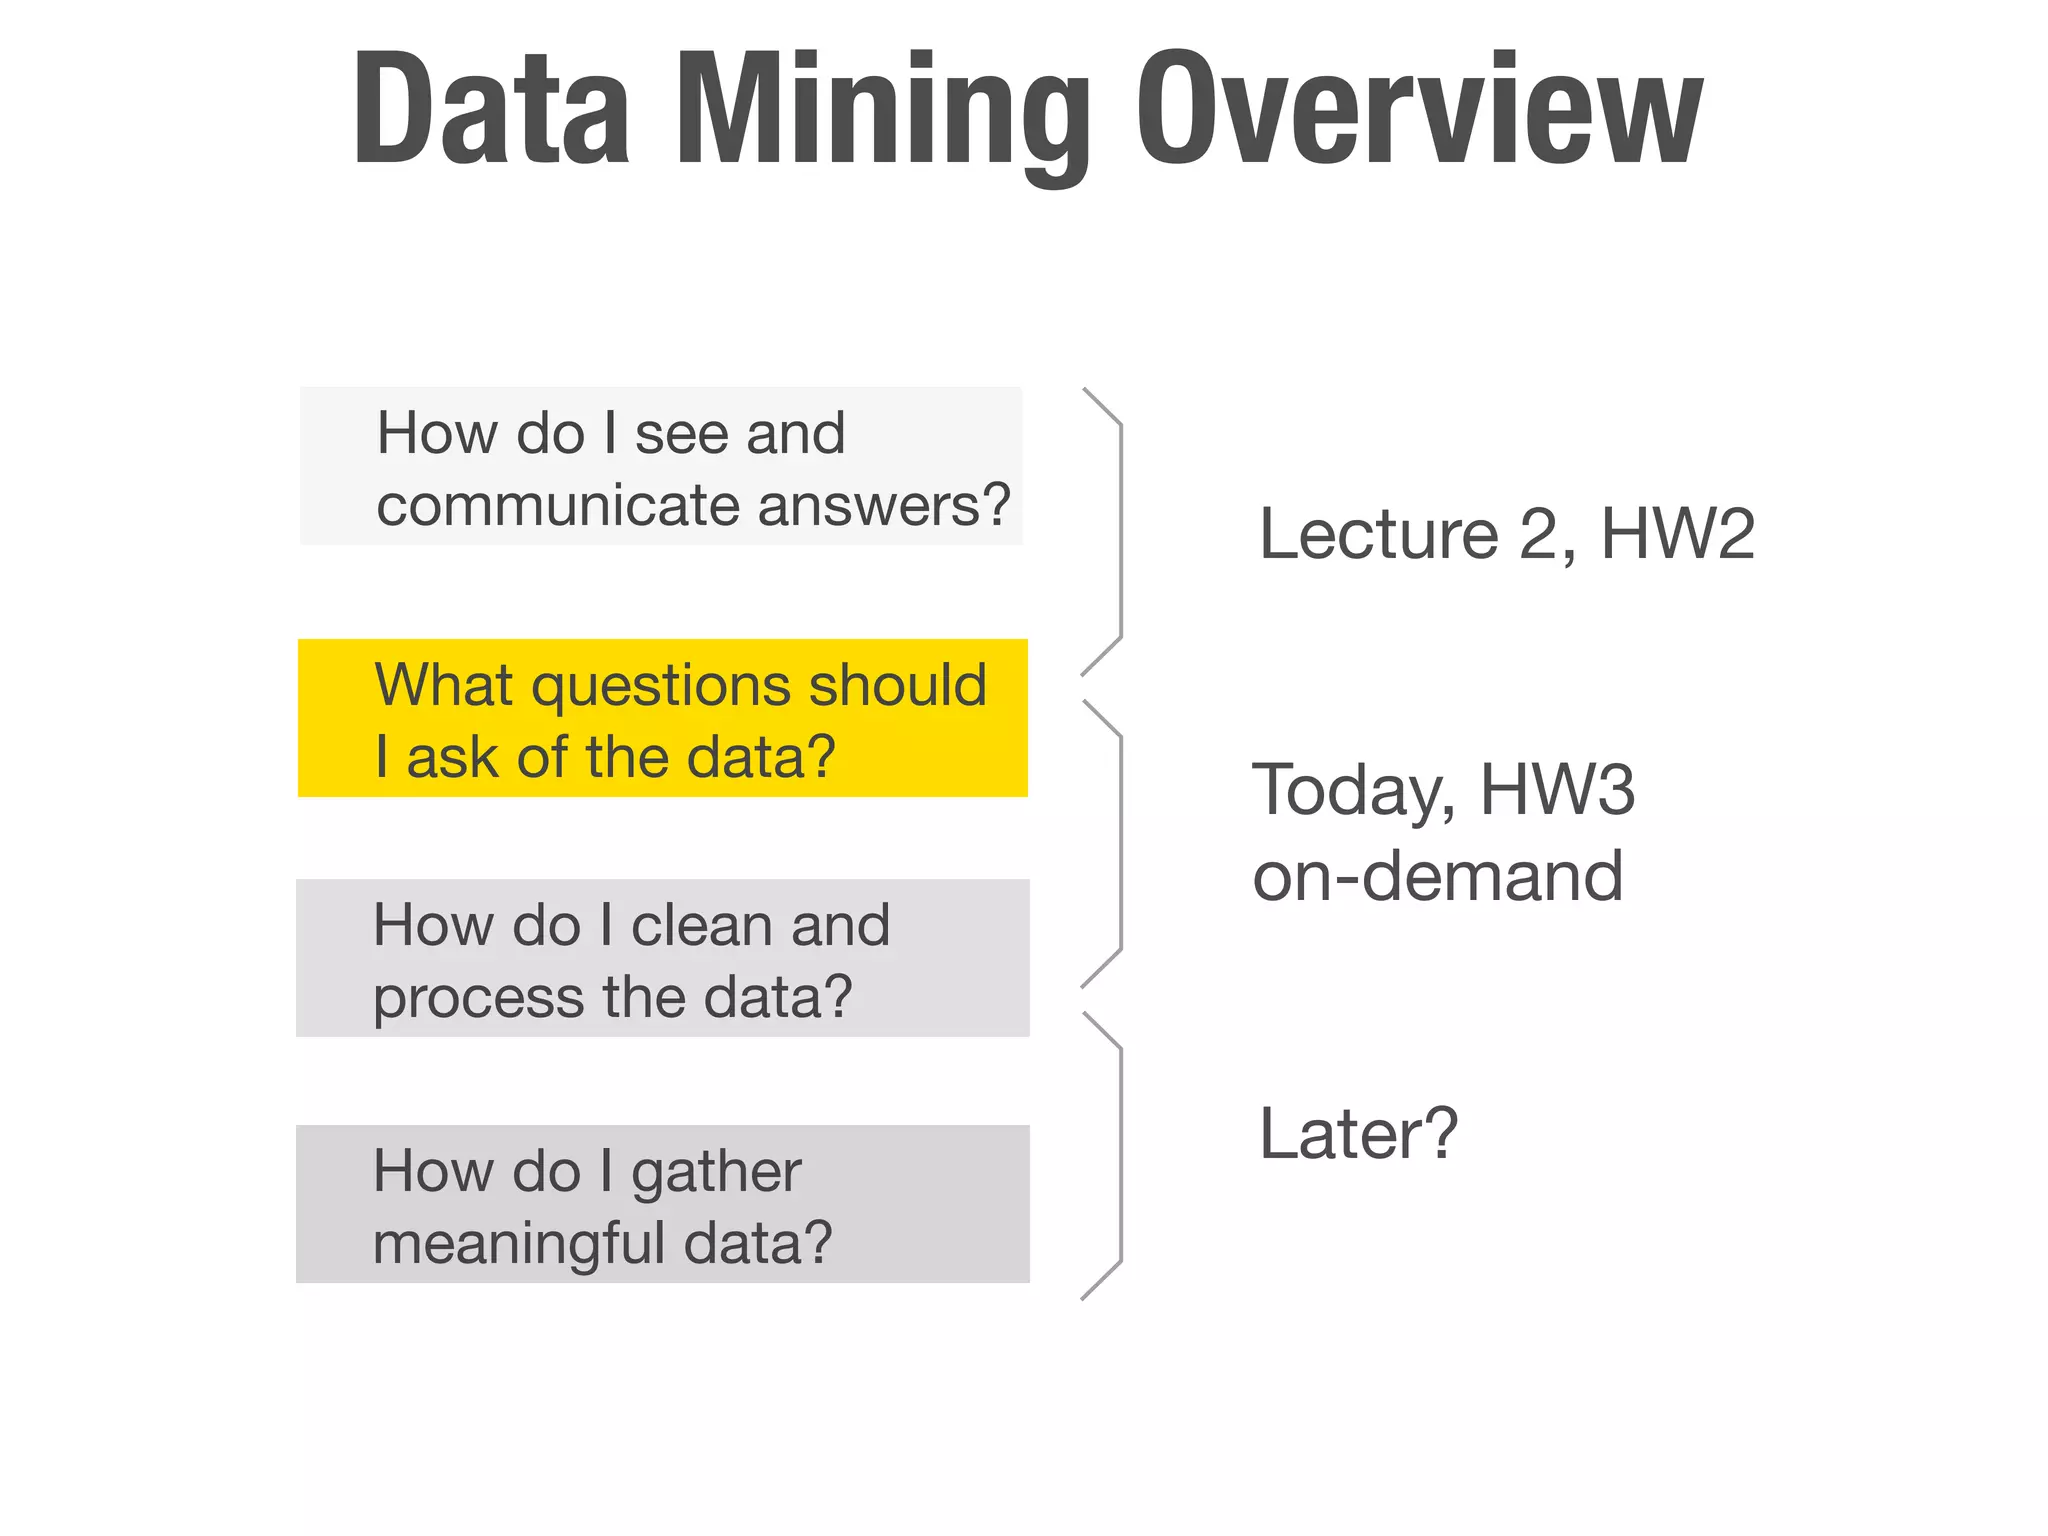
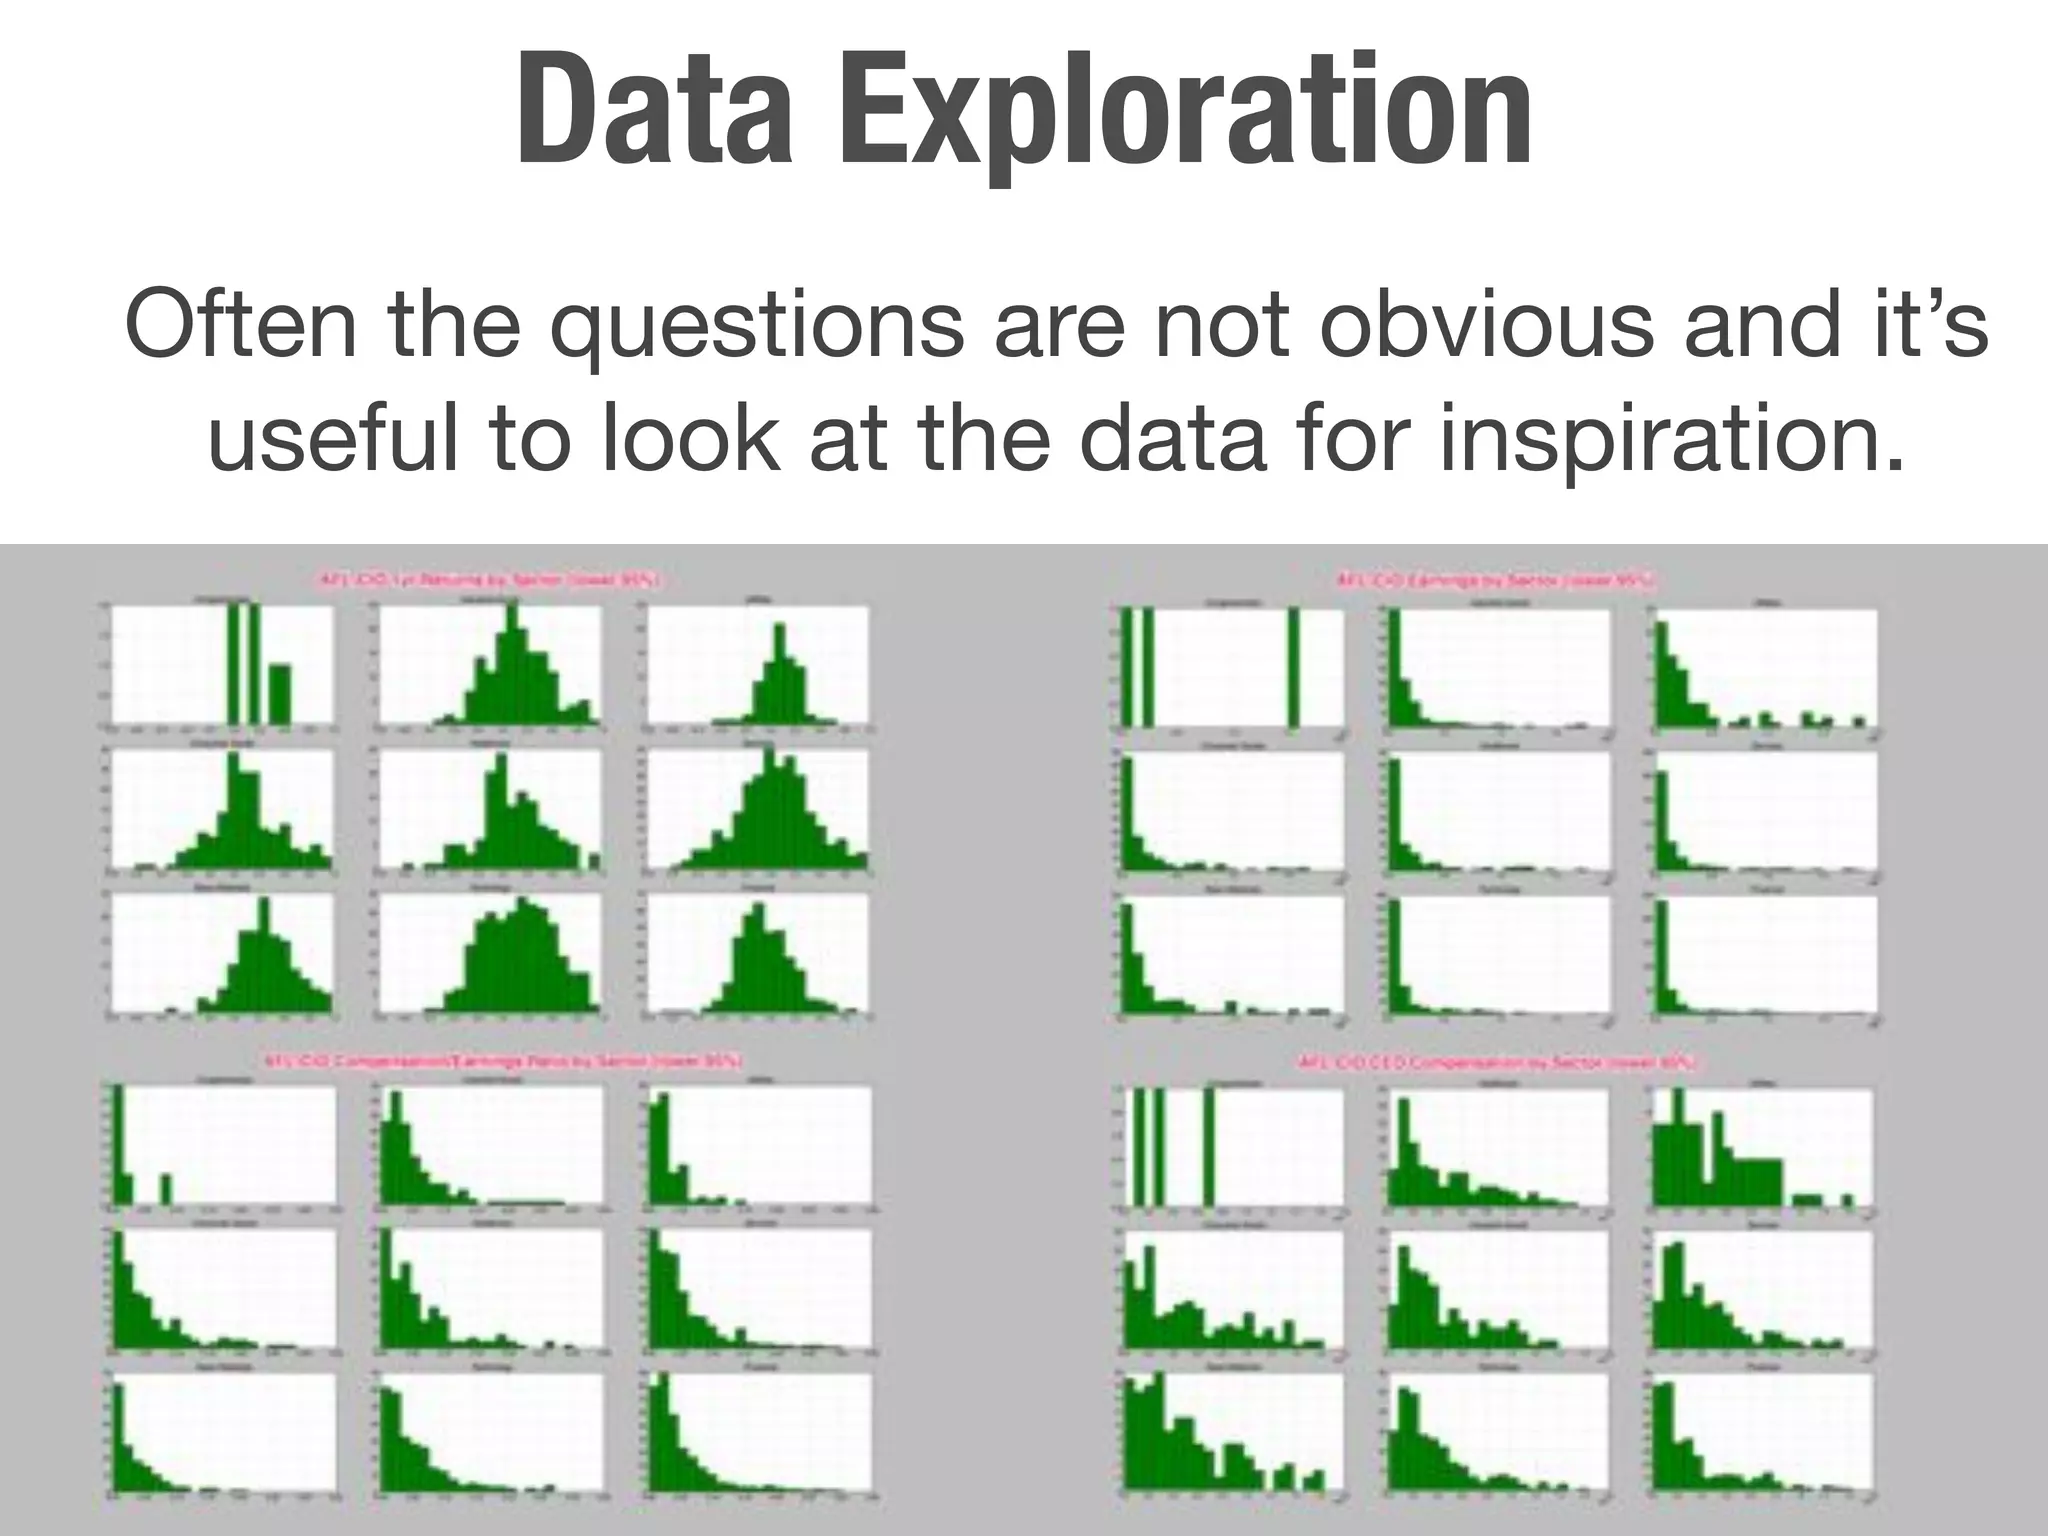
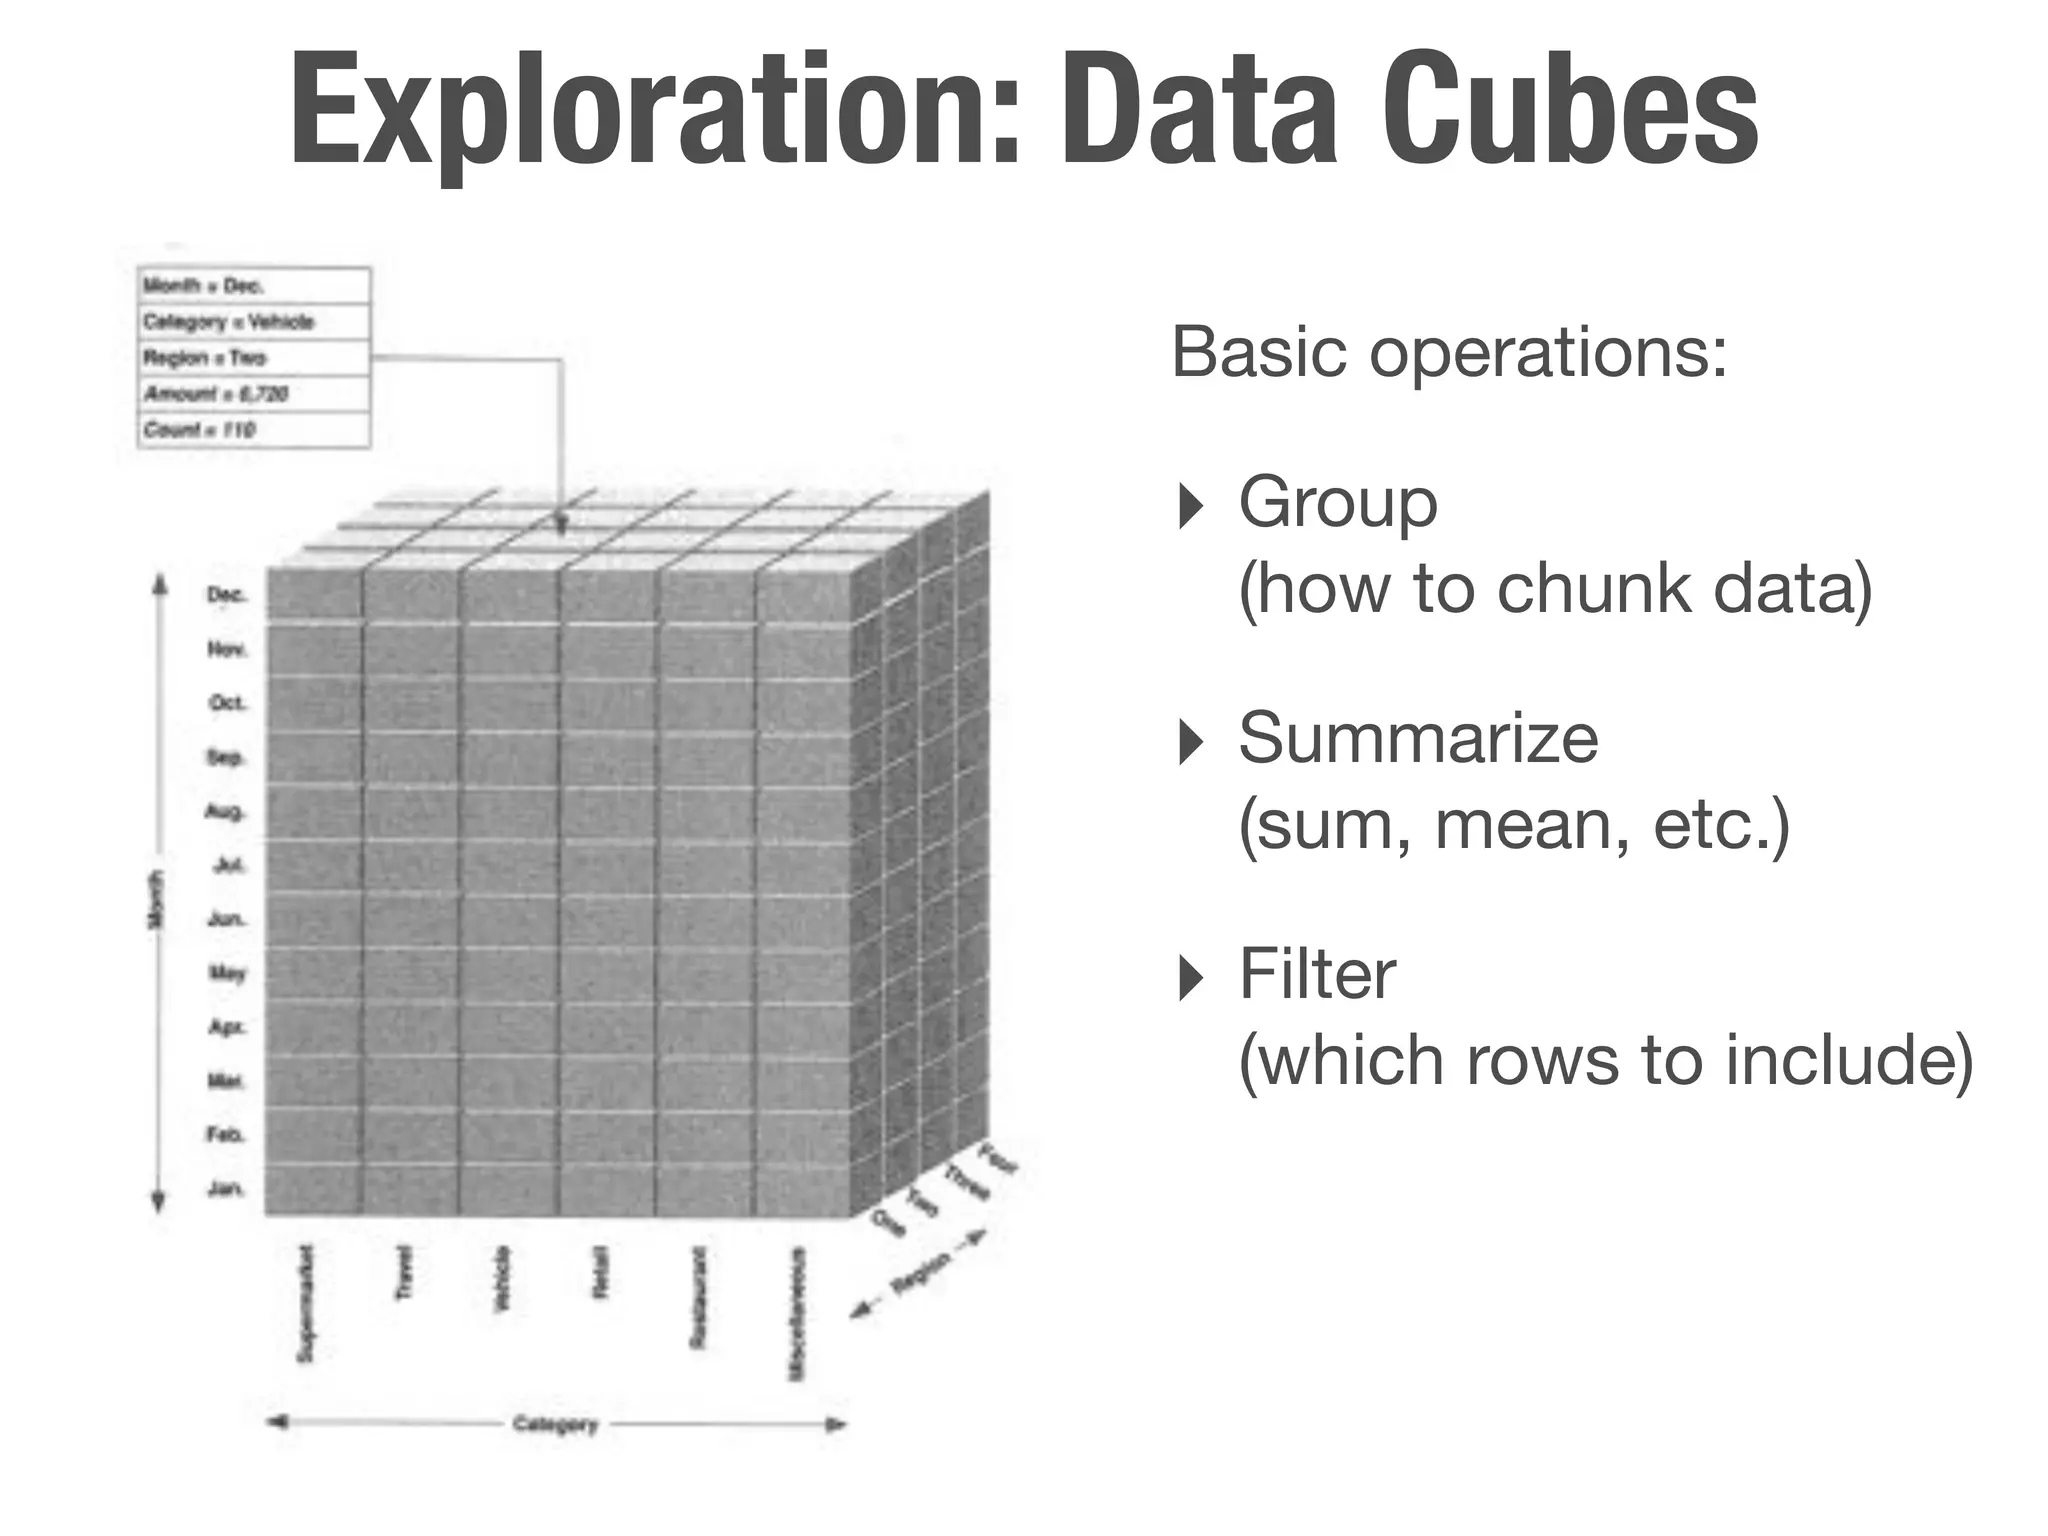
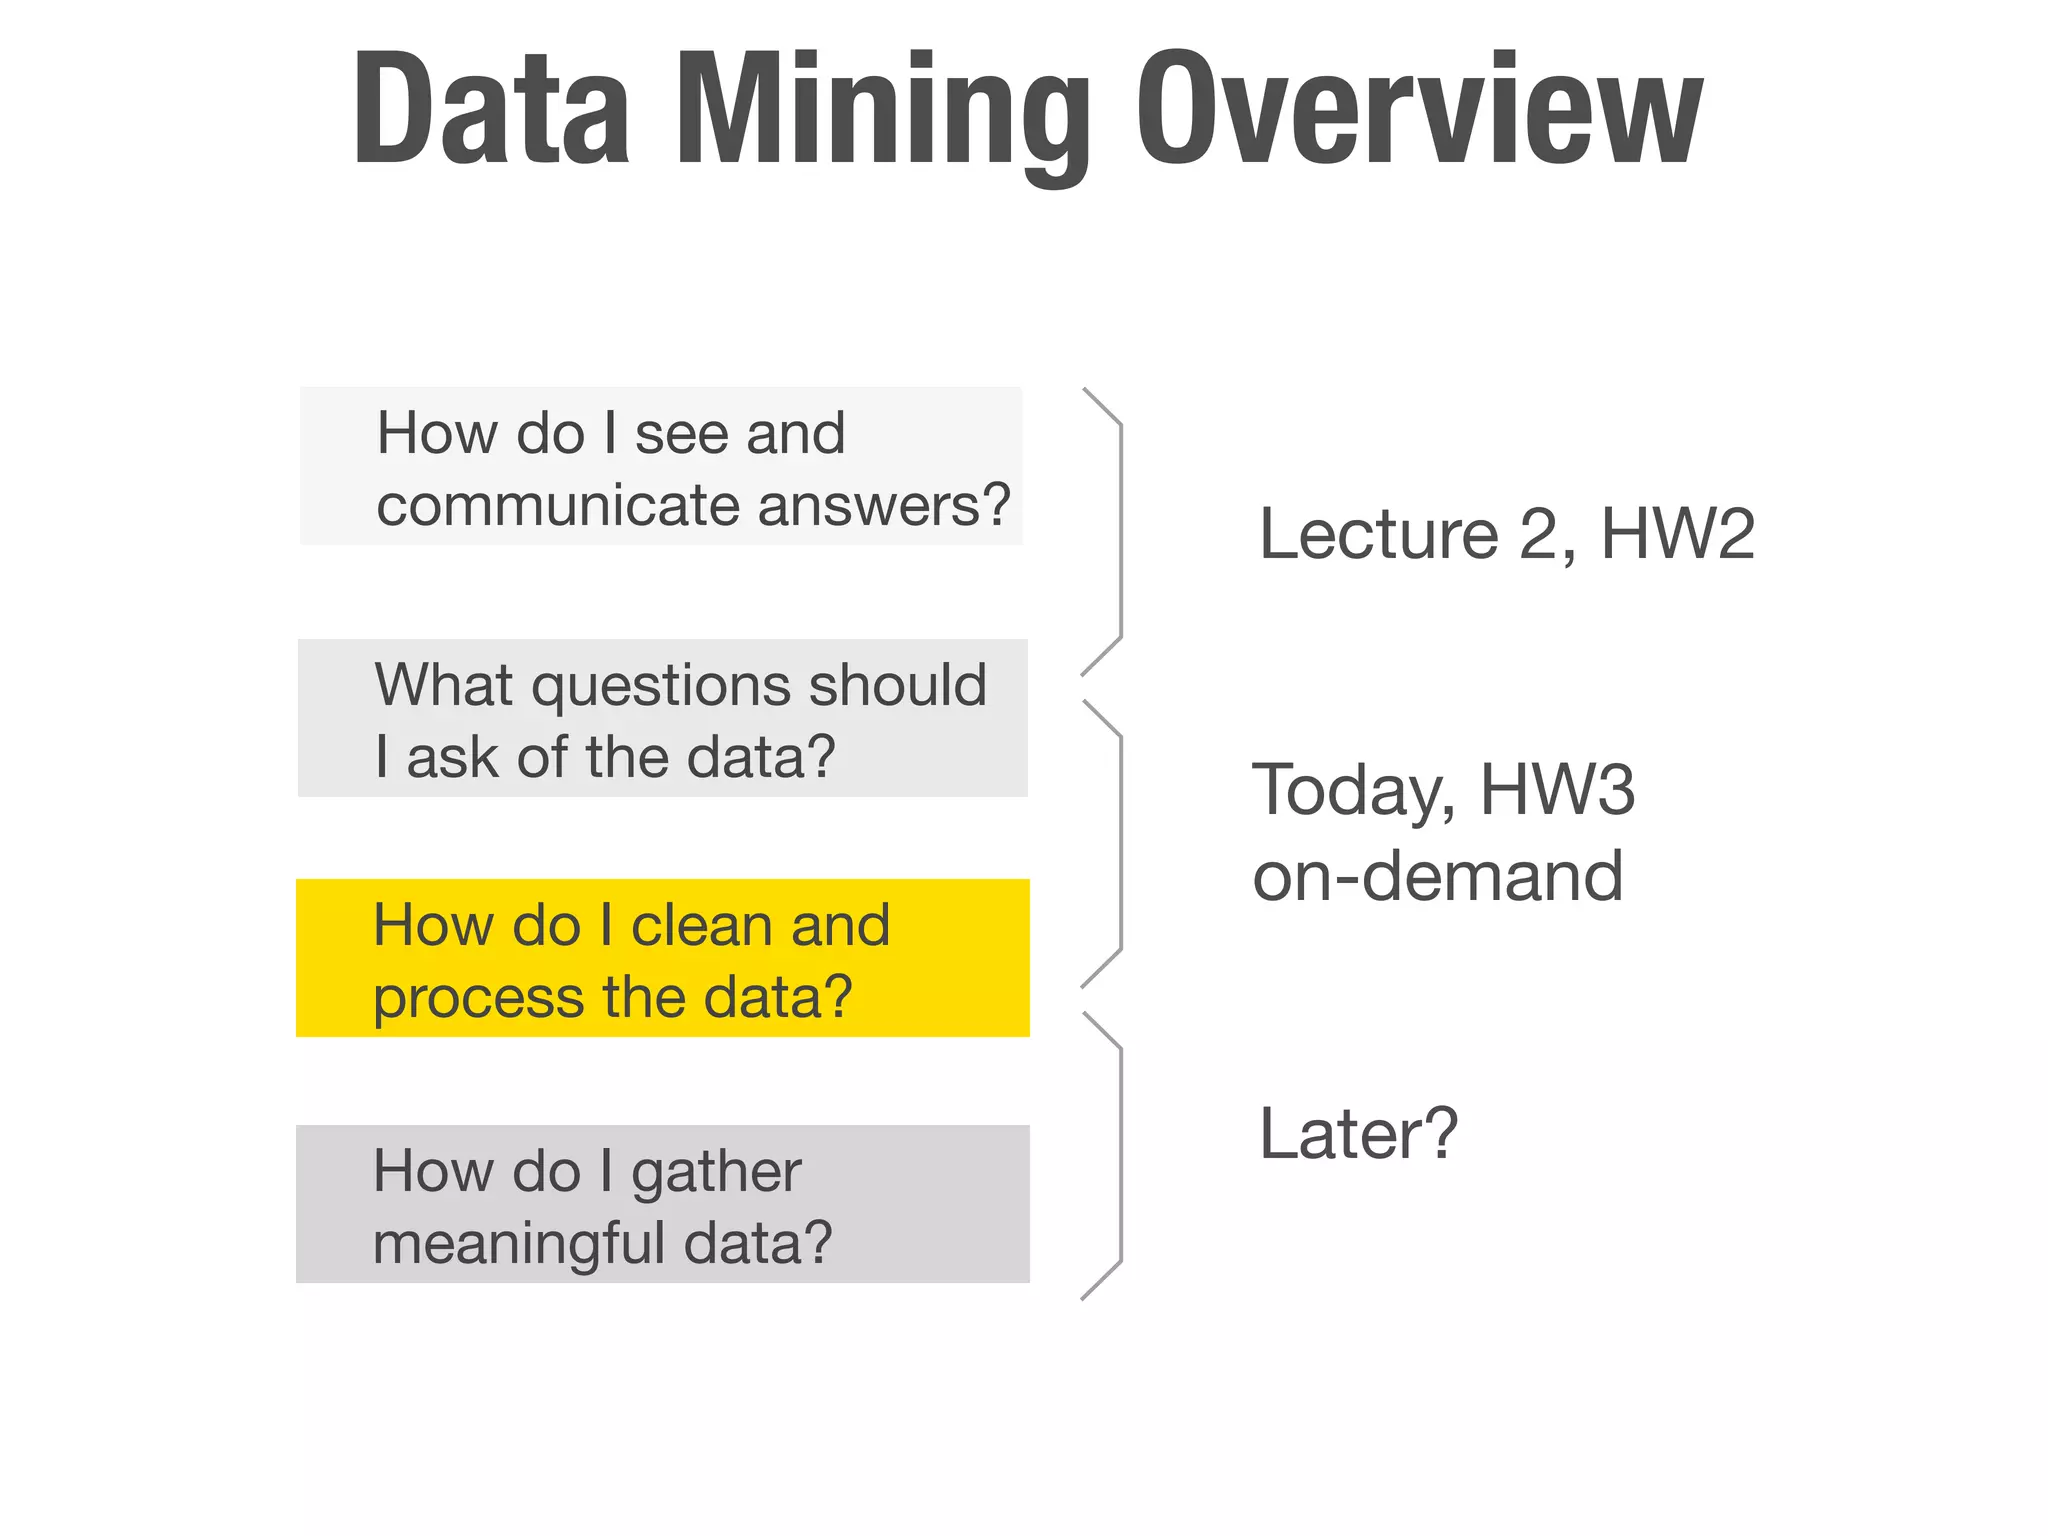
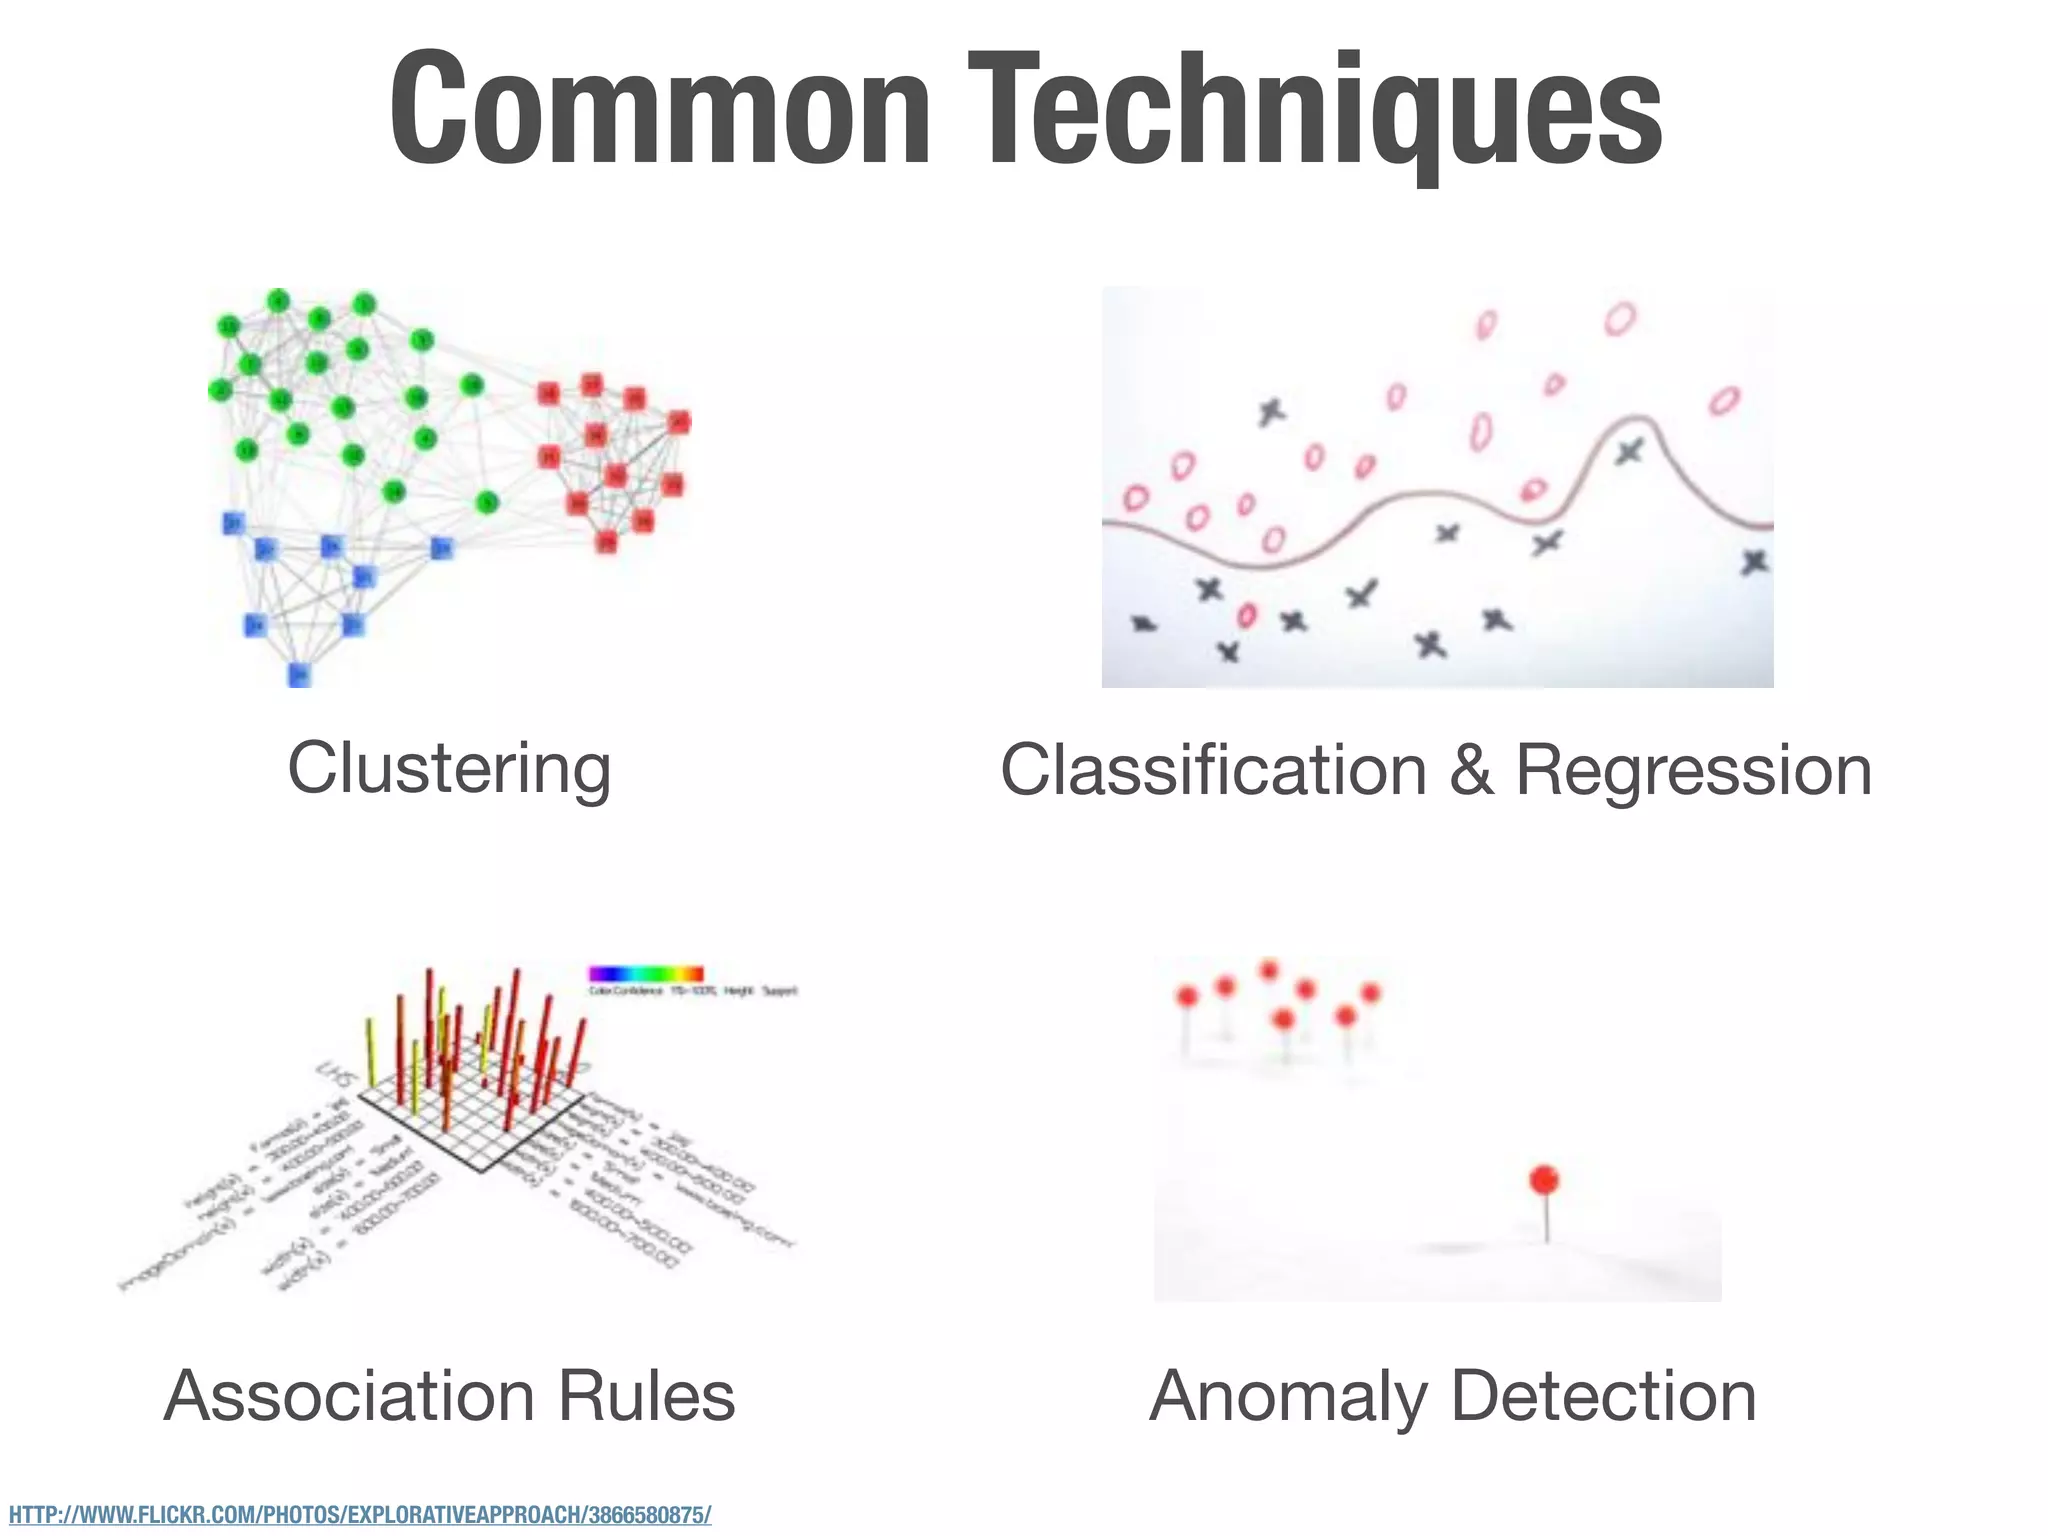
This document outlines a course on data mining and creative research practices. It includes the course outline which covers foundations of data mining like introduction, survey methods, visualization and analysis. It also covers methods like creativity and brainstorming, prototyping, project management. Later sections will cover refining prototypes and project presentations. It provides an overview of common data mining techniques like clustering, classification, regression, association rules and anomaly detection. It discusses how to apply these techniques and what questions they aim to answer from the data. The document emphasizes exploring data to find interesting patterns and questions to ask. It also discusses cleaning and processing data as part of the data mining process.


![[系列活動] 資料探勘速遊](https://cdn.slidesharecdn.com/ss_thumbnails/0114ycchendmquicktour-170110050658-thumbnail.jpg?width=640&height=640&fit=bounds)


![Coded Agents – with UiPath SDK + LangGraph [Virtual Hands-on Workshop]](https://cdn.slidesharecdn.com/ss_thumbnails/codedagentsdeck-251215155422-5497c599-thumbnail.jpg?width=640&height=640&fit=bounds)


