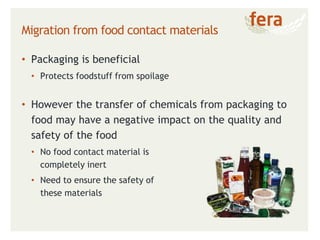
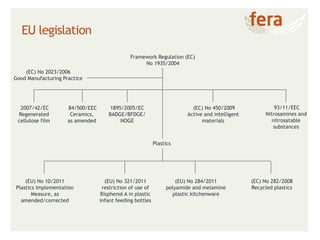
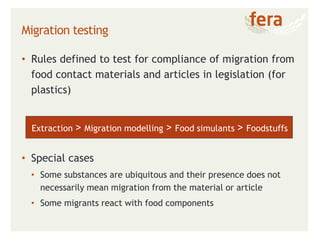
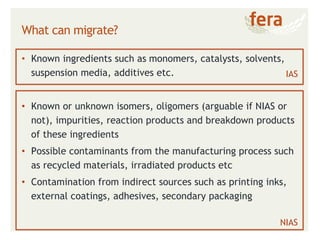
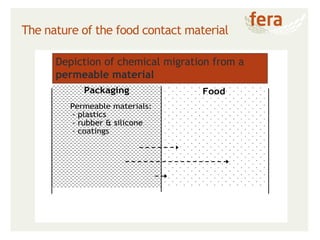
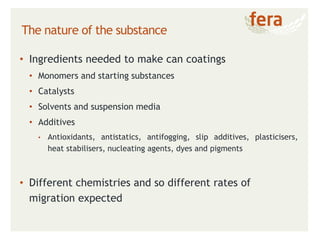
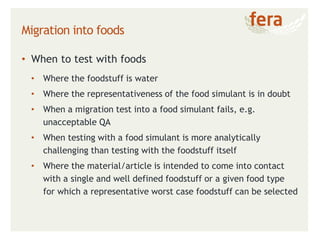
VIP Call Girls Service Shamshabad Hyderabad Call +91-8250192130
Packaging migration.pdf
1. Methods for identifying chemicals that
migrate into food and how their
concentrations vary with time and
temperature
Emma Bradley
Fera Science Ltd.
emma.bradley@fera.co.uk
2. • Packaging is beneficial
• Protects foodstuff from spoilage
• However the transfer of chemicals from packaging to
food may have a negative impact on the quality and
safety of the food
• No food contact material is
completely inert
• Need to ensure the safety of
these materials
Migration from food contact materials
3. 2007/42/EC
Regenerated
cellulose film
Framework Regulation (EC)
No 1935/2004
Plastics
(EC) No 2023/2006
Good Manufacturing Practice
84/500/EEC
Ceramics,
as amended
1895/2005/EC
BADGE/BFDGE/
NOGE
93/11/EEC
Nitrosamines and
nitrosatable
substances
(EC) No 450/2009
Active and intelligent
materials
(EU) No 321/2011
restriction of use of
Bisphenol A in plastic
infant feeding bottles
(EU) No 284/2011
polyamide and melamine
plastic kitchenware
(EU) No 10/2011
Plastics Implementation
Measure, as
amended/corrected
(EC) No 282/2008
Recycled plastics
EU legislation
4. • Rules defined to test for compliance of migration from
food contact materials and articles in legislation (for
plastics)
Extraction > Migration modelling > Food simulants > Foodstuffs
• Special cases
• Some substances are ubiquitous and their presence does not
necessarily mean migration from the material or article
• Some migrants react with food components
Migration testing
5. • Known ingredients such as monomers, catalysts, solvents,
suspension media, additives etc.
• Known or unknown isomers, oligomers (arguable if NIAS or
not), impurities, reaction products and breakdown products
of these ingredients
• Possible contaminants from the manufacturing process such
as recycled materials, irradiated products etc
• Contamination from indirect sources such as printing inks,
external coatings, adhesives, secondary packaging
IAS
NIAS
What can migrate?
6. Targeted vs. non-targeted analysis
Specific extraction
Clean-up
Specific analysis
Generic
extraction
Minimal clean-up
Generic analysis
IAS - Know
exactly
what to
measure
Predictable
NIAS – oligomers,
impurities,
literature
references
NIAS -
Complete
unknowns
Targeted Non-targeted
7. Can coating IAS
• Ingredients may include:
• Resins
• Cross linking agents
• Catalysts
• Lubricants
• Wetting agents
• Solvents
• Methods developed and validated in line with levels
of interest
• Migration limits for plastics
• Conversion of TDI
• EFSA thresholds based on toxicological data
8. NIAS using non-targeted analysis
Non-targeted
analysis
Volatile
substances
Trace
elements
Non-
volatile
and polar
substances
Semi-
volatile
substances
9. Protocols to follow……
• Presently no legally prescriptive guidelines on how to
assess the safety of NIAS
• ILSI Monograph - Guidance on best practices on the risk assessment of
NIAS in Food Contact Materials and Articles (July 2015)
• What approach should be taken?
Reporting
Data interpretation
Analysis
Extraction or migration exposure
Sample preparation
Initial discussions
10. Analysis and data interpretation
Reporting
Data interpretation
Analysis
Extraction or migration exposure
Sample preparation
Initial discussions
Identification
Quantification
0 50 100
NMR
integral
value
Concentration
TIC vs. EIC?
vs.
Detection
11. Identification of NIAS – GC-MS
• Volatile and semi-volatile NIAS - GC-MS
• Identification can be carried out by comparison to
electron impact (EI) MS libraries
• Libraries contain many 10,000’s of substances but often still
unknown NIAS with no library match
(replib) Decane
30 60 90 120 150 180 210 240 270 300 330 360 390 420
0
50
100
30
43
57
71
85
99
113 142
n-decane
NO LIBRARY
MATCH
GC-MS (EI) TIC of FCM
solvent extract
12. Identification of NIAS – HR-MS
• Volatile NIAS detected by GC-MS
• Non-volatile and polar NIAS detected by LC-MS
• HR-MS
• Accurate mass, isotope information (spacing and intensity),
fragmentation (in-source or MS/MS)
• Positive and negative ionisation modes possible
13. Database searching
• Comparison of list of accurate masses to theoretical database
• Can include retention time, structures, MS/MS fragment data
• Theoretical oligomers and reaction products associated with
starting materials (and impurities if known) below 1000 Da
• Should consider simulant-oligomer interactions
• Can contain tens of thousands of compounds….
• Not confirmed unless compared to authentic standard
AA TMA PA CHDM BD EG DEG PG HD HMP TMP NPG H2O MW
PA+EG linear 1 1 1 210.0528
EG+PA+EG linear 1 2 2 254.0790
PA+EG+PA+EG linear 2 2 3 402.0951
PA+EG+PA+EG cyclic 2 2 4 384.0845
PA+EG+PA+EG+PA linear 3 2 4 550.1111
PA+EG+PA+EG+PA+NPG linear 3 2 1 5 636.1843
PA+EG+PA+NPG+PA+EG linear 3 2 1 5 636.1843
PA+PG+PA+PG+PA+PG linear 3 3 5 636.1843
PA+PG+PA+PG+PA+PG cyclic 3 3 6 618.1737
14. Quantification
• How can we quantify if we don’t know what we are looking
for?
• Internal standards
• 2H, 13C analogues – not naturally occurring
• Range of compounds to cover the mass range of interest?
• IS that responds in positive and negative ionisation (for LC-MS)
• External standards
• Chemically similar to substances of interest
e.g. BADGE or BADGE hydrolysis products for epoxy-related
e.g. Polyester diol urethane substance for polyester-related
• Synthesis of authentic standards to confirm identity
• Retention time, accurate mass, fragmentation comparison
• Expensive and time consuming
15. Quantification by LC-TOF-MS and NMR
Extraction of a
FCM with
solvent
AA TMA PA CHDM BD EG DEG PG HD HMP TMP NPG H2O MW
PA+EG linear 1 1 1 210.0528
EG+PA+EG linear 1 2 2 254.0790
PA+EG+PA+EG linear 2 2 3 402.0951
PA+EG+PA+EG cyclic 2 2 4 384.0845
PA+EG+PA+EG+PA linear 3 2 4 550.1111
PA+EG+PA+EG+PA+NPG linear 3 2 1 5 636.1843
PA+EG+PA+NPG+PA+EG linear 3 2 1 5 636.1843
PA+PG+PA+PG+PA+PG linear 3 3 5 636.1843
PA+PG+PA+PG+PA+PG cyclic 3 3 6 618.1737
0 50 100
NMR
integral
value
Concentration
0.04 mg/6 dm2
0.03 mg/6 dm2
Monomer functional
group quantification
Oligomer determination
0
20
40
60
80
100
120
0 50 100 150
Area
Concentration
16. • Approaches described thus far cover extraction
• Assumption – 100% transfer
• Concentration in food – “EU cube”
• Worst case concentration “in food” data
Extraction
• Models developed for some plastics
• Accepted approach for demonstrating compliance
• Developed to at least equal (but typically overestimate)
migration – consumer protection
Migration modelling
Extraction > Migration modelling > Food simulants > Foodstuffs
17. • Migration into food simulants (simple media intended to mimic
foodstuffs) is permitted for use to demonstrate the suitability for
contact with a range of foods. In Europe the simulants are:
Simulant Abbreviation
Ethanol 10% (v/v) Simulant A
Acetic acid 3% (w/v) Simulant B
Ethanol 20% (v/v) Simulant C
Ethanol 50% (v/v) Simulant D1
Vegetable Oil Simulant D2
Modified polyphenylene oxides, particle size 60-80
mesh, pore size 200 nm
Simulant E for dry foods
Migration into simulants (plastics)
Extraction > Migration modelling > Food simulants > Foodstuffs
18. • Migration is a diffusion and partitioning process that is
dependent on:
• The nature of the food contact material
• The nature and concentration of the migrating substance
• The nature, the extent and the type of contact between the
food contact material/article and the foodstuff
• The nature of the foodstuff
Factors affecting migration
19. Packaging
Permeable materials:
- plastics
- rubber & silicone
- coatings
Food
Depiction of chemical migration from a
permeable material
The nature of the food contact material
20. • Ingredients needed to make can coatings
• Monomers and starting substances
• Catalysts
• Solvents and suspension media
• Additives
• Antioxidants, antistatics, antifogging, slip additives, plasticisers,
heat stabilisers, nucleating agents, dyes and pigments
• Different chemistries and so different rates of
migration expected
The nature of the substance
21. 0
0.2
0.4
0.6
0.8
1
1.2
1.4
0 50 100 150 200
Time (days)
Migration
into
food
(mg/kg)
200 Da additive
500 Da additive
1000 Da additive
The nature of the substance
22. • Interaction between food and packaging
• Direct versus indirect contact
• Point or continuous contact
The nature of the contact
23. 0
2
4
6
8
10
12
0 1 2 3 4 5 6 7 8 9 10
Time (days)
MIgration
(mg/kg)
15°C
30°C
40°C
The nature of the contact – time and
temperature
24. 0.0
0.5
1.0
1.5
2.0
2.5
3.0
0.0 0.5 1.0 1.5 2.0 2.5 3.0 3.5 4.0 4.5
Time (days)
Migration
(mg/dm
2
)
no fat
10% fat
20% fat
30% fat
50% fat
High fat = low migration of polar compound
Low fat = high migration of polar compound
The nature of the foodstuff
25. • When to test with foods
• Where the foodstuff is water
• Where the representativeness of the food simulant is in doubt
• When a migration test into a food simulant fails, e.g.
unacceptable QA
• When testing with a food simulant is more analytically
challenging than testing with the foodstuff itself
• Where the material/article is intended to come into contact
with a single and well defined foodstuff or a given food type
for which a representative worst case foodstuff can be selected
Migration into foods
26. • Test foods in contact with the FCM under worst foreseeable
conditions of use
• Homogenise the foodstuff and analyse for the substance of interest
• Test a portion of the food that has not been exposed to the material
or article to confirm any substances present occur due to migration
from the tested material or article
• Test packed foods at end of shelf life
• Remove non-edible parts
• Homogenise remainder and analyse for the substance of interest
• For solid foods compare concentrations at the food contact surface
with concentrations in the bulk of the food to confirm derived from
the packaging rather than
Migration into foods
27. Summary
• Ever-advancing analytical instrumentation provides very
powerful tools for determination of IAS and NIAS
• As instruments become more readily available and
sensitivity increases there is the potential for more and
more NIAS to be detected
• Identification and quantification are still providing
challenges
• Extraction methods used to detect NIAS overestimate
migration
• Use of migration modelling, migration into simulants and
better still migration into foods can refine the data for
exposure estimations