Downloaded 47 times


![CableLabs® Overview of Cable Television
31
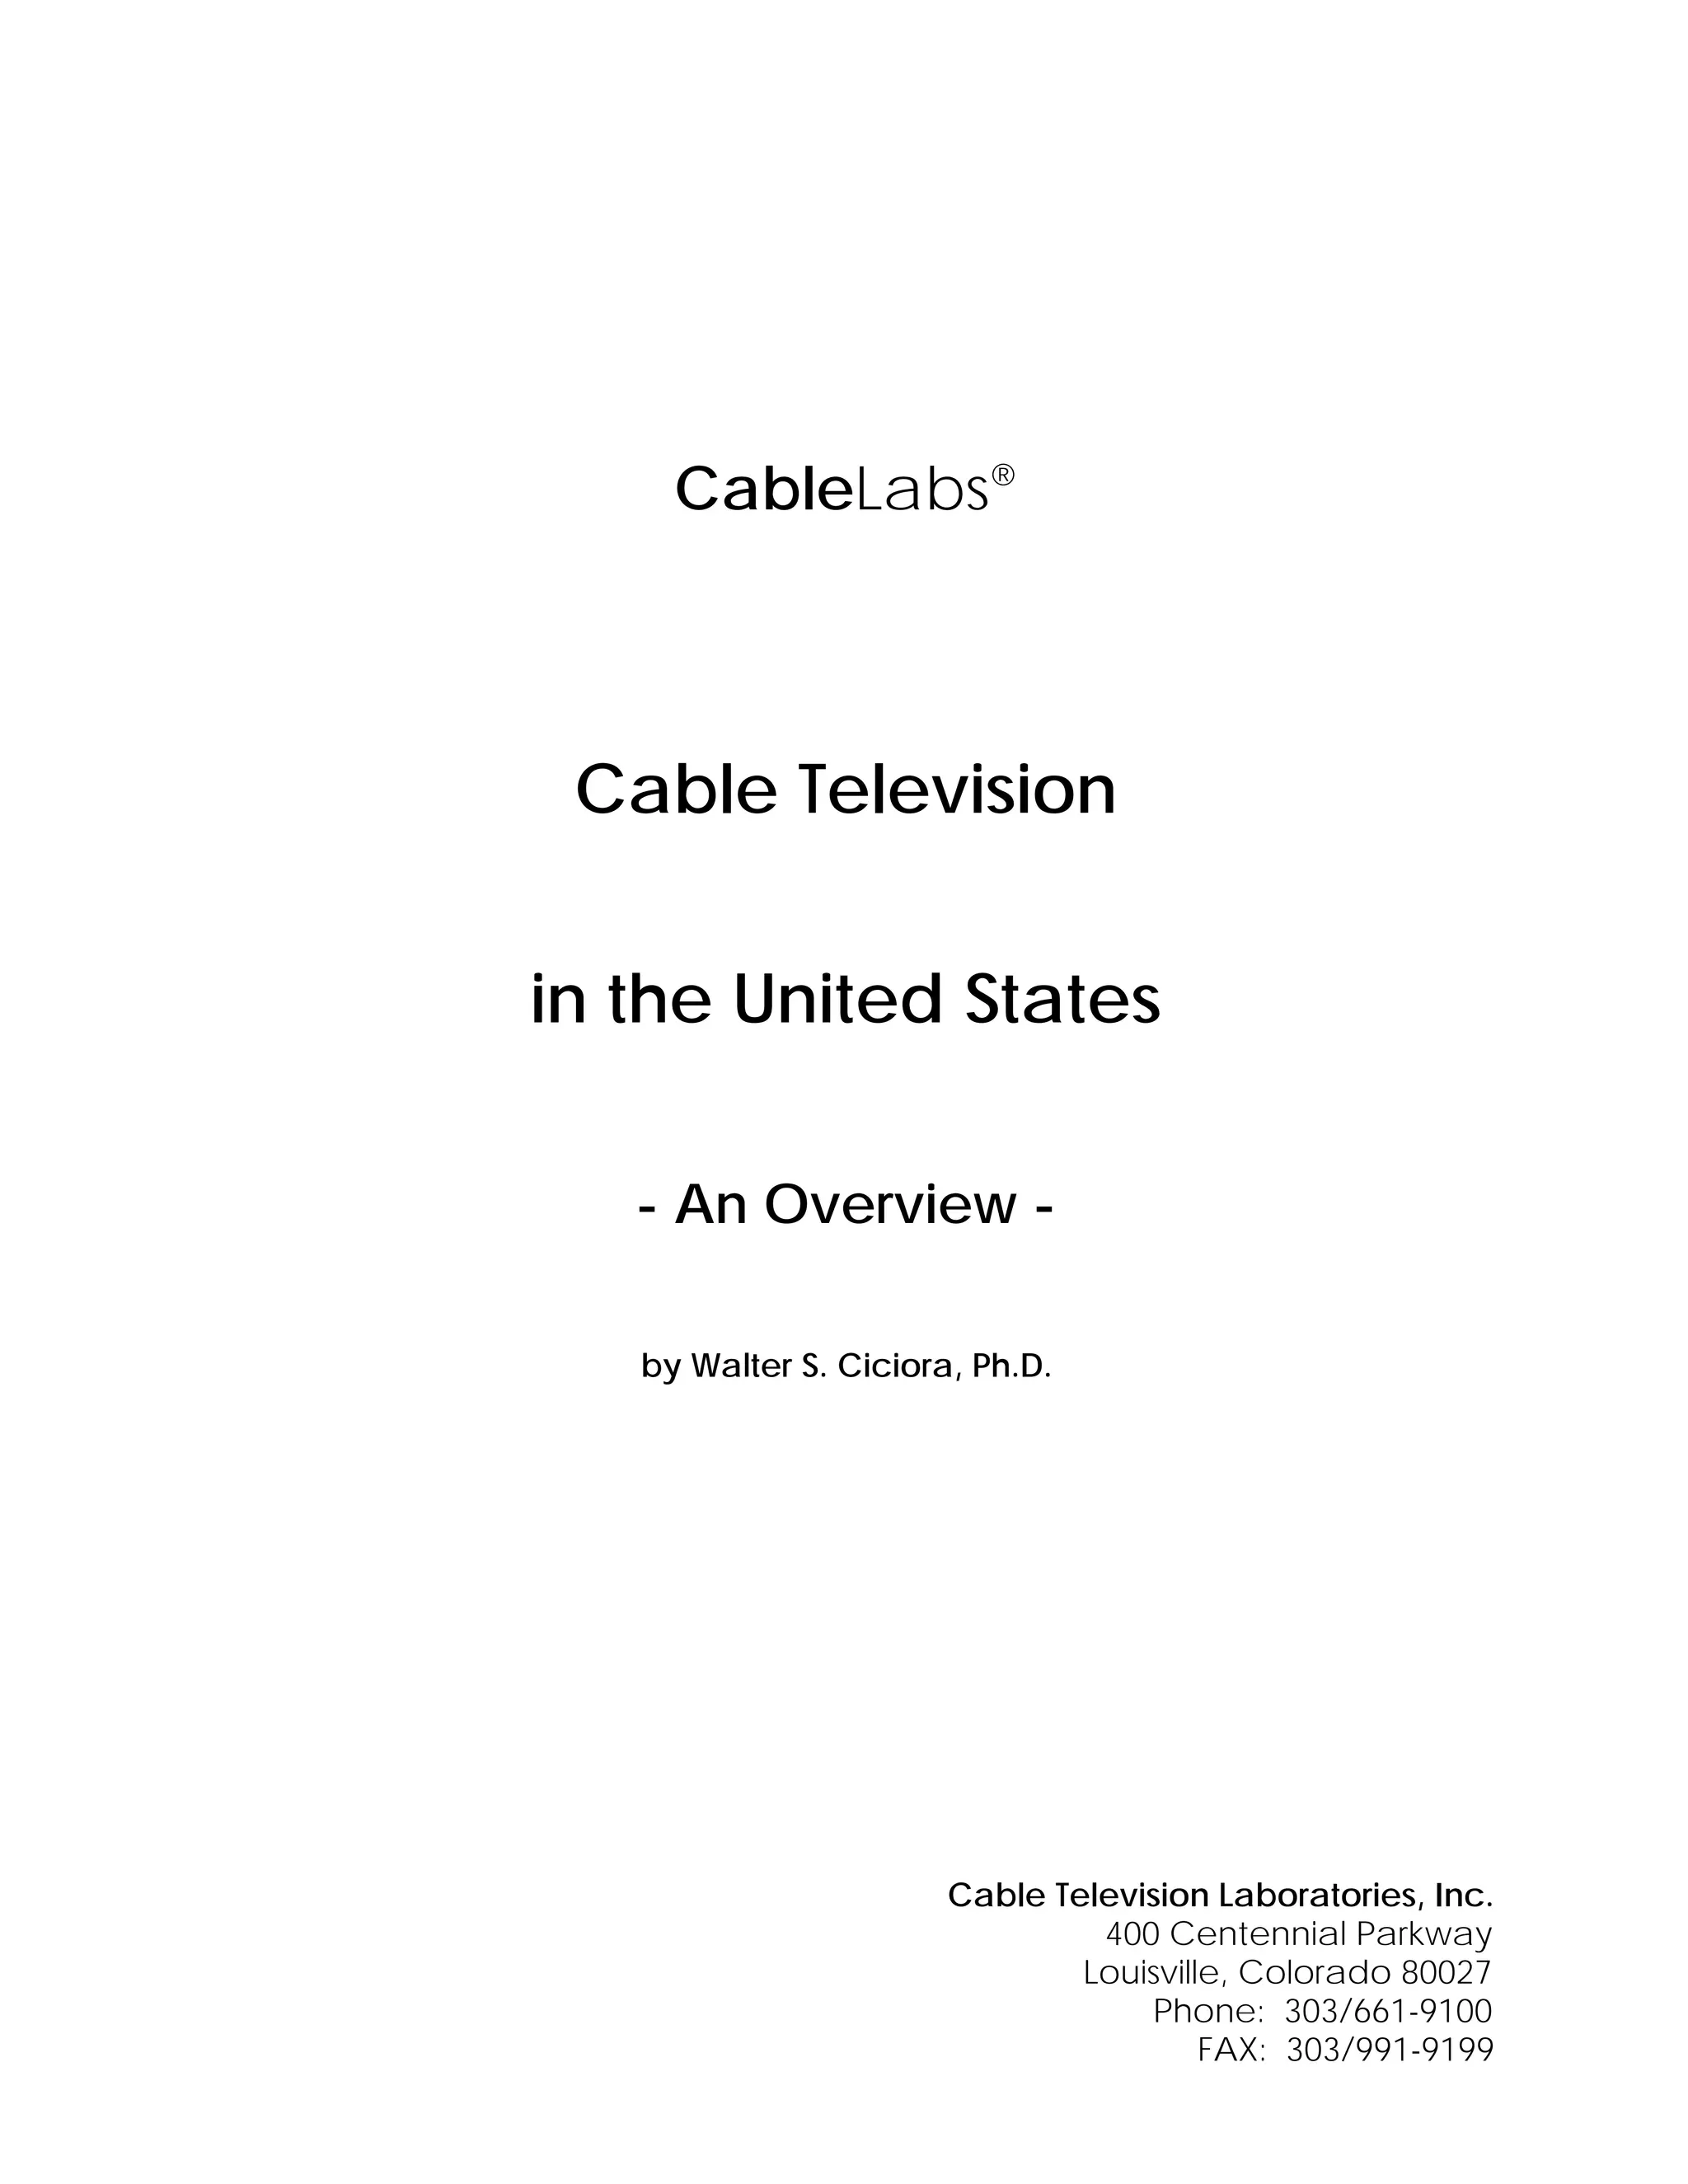
Two other factors limit the geography of a cable system. Cable attenuation rises with increas-
ing frequency. More equal gain amplifiers are required to transmit the signal a given distance.
But noise limits the maximum number of amplifiers used. The second factor is that amplifier
distortion is a function of channel loading: The more channels carried, the greater the distor-
tions.
FIGURE 2.3 - DISTORTIONS IN A CASCADE
To obtain optimum cascade length, AGC/ASC tolerance, accurate alignment, calibrated test
equipment, and well-founded system maintenance programs are of paramount importance.
Maintenance programs are designed to ensure that system alignment is kept within acceptable
limits. Where trunk lines carry signals through cascades of up to 40 trunk amplifiers, it is cru-
cial that each amplifier have a flat amplitude-versus-frequency response. The additive effects
of even minimal amplitude response variations in each amplifier create significant system flat-
ness problems at the end of long cascades.
2.5.1 Maintaining Amplitude-Versus-Frequency Response
A maintenance program objective should be to achieve a system amplitude-versus-frequency
response of less than [(N/10)+1] dB peak-to-valley, where N is the number of trunk amplifiers
in the cascade.This will minimize the degradation of CNR which occurs in channels that fall
in the valleys of the system response. It is imperative that the optimum response is maintained
at each amplifier. Recommended practice calls for no more than 3 dB difference in adjacent
Convergence on a 46 C/N and 53 CTB (300 MHz)
C/N Ratio
Normal operating range
Max Cascade
Cascade with
Headroom
3 dB C/N
6 dB CTB
CTB
Number of Amplifiers in Cascade
1 10 20 30 40 50 60
–40.00
–30.00
–20.00
–10.00
0.00
10.00
20.00](https://image.slidesharecdn.com/overviewofcabletelevision-140612125747-phpapp02/75/Overview-of-cable-television-36-2048.jpg)


![CableLabs® Overview of Cable Television
79
Cables used in a supertrunk are usually of large diameter and high propagation velocity to
reduce attenuation (0.750” to 1.000” in diameter). Normal trunk cable is generally 0.750”,
although modern, higher-frequency systems may use 0.860”, 0.875”, 1.0”, or 1.125” cable.
Distribution lines are typically of shorter length than trunks so smaller, less expensive cable
may be used (0.412”, 0.500” and 0.625”). The subscriber drop cable is the smallest cable of all
and must be flexible, whereas the other cables are rigid. Another consideration is that while
any single drop is relatively short (50 m average, the total length of drop cable in a cable sys-
tem is enormous, so inexpensive cable is required [RG-59, RG-6]).
3.2.6.1 General Specifications
Characteristic Impedance 75 ohms
Structural Return
Loss Trunk & Distribution Cable > 30 dB
Drop Cable > 26 dB
Time Delay 4.17 ns maximum
(Velocity of Propagation = 80% min.)
3.2.6.2 Cable Attenuation
Velocity of Propagation = 82%, Attenuation (dB/100 m):
MHz
Cable Type
RG-59 RG-6 .412” .500” .750” 1.000”
5 2.55 2.00 0.75 0.56 0.39 0.33
30 6.27 4.94 1.90 1.38 0.95 0.79
50 8.42 6.65 2.53 1.94 1.36 1.08
300 20.00 16.00 5.94 4.89 3.44 2.58
450 24.60 19.80 7.47 6.07 4.40 3.58
550 27.20 21.90 8.37 6.81 4.90 4.03](https://image.slidesharecdn.com/overviewofcabletelevision-140612125747-phpapp02/75/Overview-of-cable-television-84-2048.jpg)


This document provides an overview of cable television in the United States. It discusses how cable television originated to deliver broadcast signals to areas with poor reception. It evolved to provide additional channels from satellites. Today, cable television delivers dozens of channels to over 60% of US households. The document covers the technical aspects of cable systems, including their network design, frequency planning, and use of fiber optics and digital compression to increase channel capacity and support new services like video on demand.


![Chapter 2 [compatibility mode]](https://cdn.slidesharecdn.com/ss_thumbnails/chapter2compatibilitymode-150427213042-conversion-gate01-thumbnail.jpg?width=640&height=640&fit=bounds)


