Download to read offline


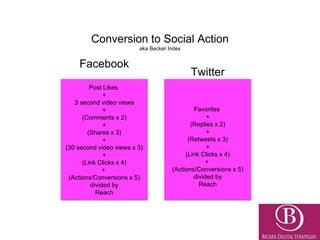
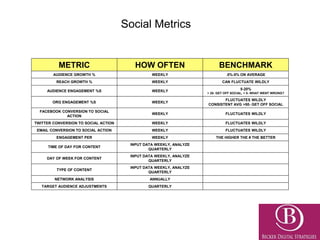

This document discusses social media analytics and metrics. It provides formulas for calculating incoming and outgoing engagement on Facebook and Twitter. It also provides a formula for calculating conversion to social action (the Becker Index). It lists common metrics to track like audience growth, reach growth, engagement percentages, and conversion rates. It recommends analyzing metrics like time of day, day of week, and type of content that perform best on a quarterly basis. Benchmark ranges are provided for some key metrics.


![[Webinar] How to Make Full-Funnel Impact with Social Media - Simply Measured ...](https://cdn.slidesharecdn.com/ss_thumbnails/howtomakefull-funnelimpactwithsocialmedia-webinardeckfinalv3-170621205444-thumbnail.jpg?width=640&height=640&fit=bounds)


