Download as PDF, PPTX

![Copyright © 2018, Oracle and/or its affiliates. All rights reserved. |
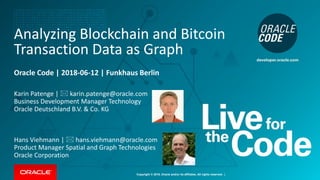
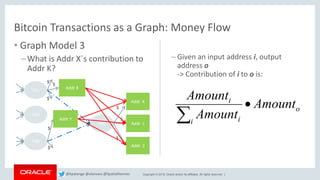
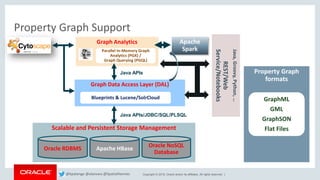
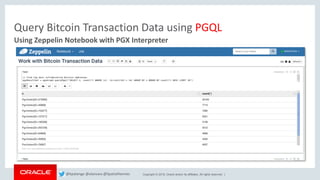
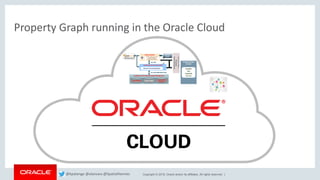
Definition Bitcoin transaction data sample
[oracle@bigdatalite data]$ head –n 5 btc.opv
1,bt_addr,1,1111111111111111111114oLvT2,,
2,bt_addr,1,11126yHiXjavR3oNVwV2GRNso2ah4MnZtm,,
3,bt_addr,1,11128BtJwtyW4q9eRe3zts6BB4jg4uKLv8,,
4,bt_addr,1,111HnjYiCubyhPjtmZ7jEQjYcYBpKZHvJ,,
5,bt_addr,1,111KHWctzJ8tsTbittCDVzmTHVjxQR2g4,,
[oracle@bigdatalite data]$
Oracle Flat File Format: Vertices
Field # Name Description
1 vertex_ID An integer that uniquely identifies the
vertex
2 key_name The name of the key in the key-value pair
3 value_type 1=String, 2=Integer, 3=Float, ...
4 value The encoded, non-null value of key_name
when it is neither numeric nor date
5 value The encoded, non-null value of key_name
when it is numeric
6 value The encoded, nonnull value of key_name
when it is a timestamp (date)
Source: http://blockchain.info
@kpatenge @alanzwu @SpatialHannes](https://image.slidesharecdn.com/20180612oraclecodegraphblockchainbitcoinkpatengehviehmann-180614130429/85/OracleCode_Berlin_Jun2018_AnalyzeBitcoinTransactionDataUsingAsGraph-16-320.jpg)
![Copyright © 2018, Oracle and/or its affiliates. All rights reserved. |
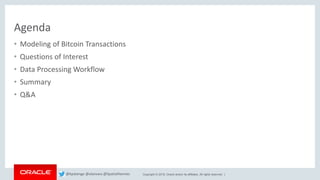
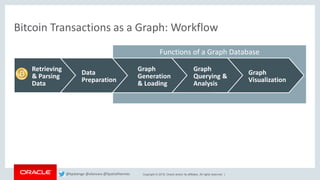
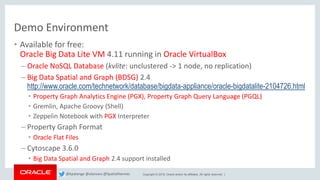
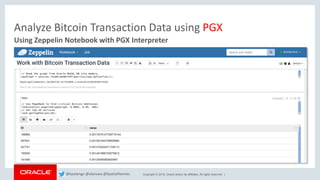
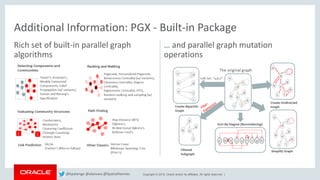
Definition Bitcoin transaction data sample
[oracle@bigdatalite data]$ head –n 5 btc.ope
1,317335,91594,contrib,trans_hash,1,4391b11d991e7c9ad4
f9a1a5a7ea9ed7f234643b0c883f49511e1394a5ab8ff5,,
1,317335,91594,contrib,amount,3,,5.0E9,
2,357443,91594,contrib,trans_hash,1,4391b11d991e7c9ad4
f9a1a5a7ea9ed7f234643b0c883f49511e1394a5ab8ff5,,
2,357443,91594,contrib,amount,3,,5.0E9,
3,352850,91594,contrib,trans_hash,1,4391b11d991e7c9ad4
f9a1a5a7ea9ed7f234643b0c883f49511e1394a5ab8ff5,,
3,352850,91594,contrib,amount,3,,5.0E9,
4,308829,91594,contrib,trans_hash,1,4391b11d991e7c9ad4
f9a1a5a7ea9ed7f234643b0c883f49511e1394a5ab8ff5,,
4,308829,91594,contrib,amount,3,,5.0E9,
5,314511,11714,contrib,trans_hash,1,2e8250e9f3f8043cda
d60f747982275fee2a1836ebb48b2f620d03371be8e3f6,,
5,314511,11714,contrib,amount,3,,5.0E9,
[oracle@bigdatalite data]$
Oracle Flat File Format: Edges
Field # Name Description
1 edge_ID An integer that uniquely identifies the edge
2 source_vertex_ID The vertex_ID of the outgoing tail of the edge
3 dest_vertex_ID The vertex_ID of the incoming head of the edge
4 edge_label The encoded label of the edge, which describes the
relationship between the two vertices
5 key_name The encoded name of the key in a KV pair
6 value_type 1=String, 2=Integer, 3=Double, ...
7 value The encoded, nonnull value of key_name when it is
neither numeric nor timestamp (date)
8 value The encoded, nonnull value of key_name when it is
numeric
9 value The encoded, nonnull value of key_name when it is
a timestamp (date)
@kpatenge @alanzwu @SpatialHannes](https://image.slidesharecdn.com/20180612oraclecodegraphblockchainbitcoinkpatengehviehmann-180614130429/85/OracleCode_Berlin_Jun2018_AnalyzeBitcoinTransactionDataUsingAsGraph-17-320.jpg)
![Copyright © 2018, Oracle and/or its affiliates. All rights reserved. |
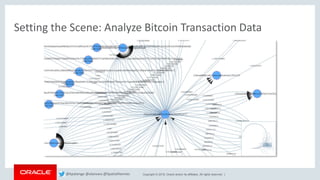
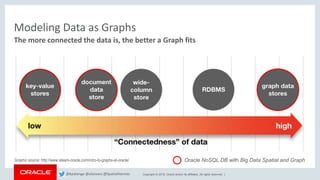
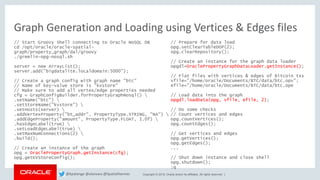
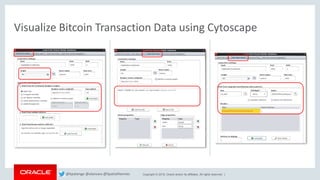
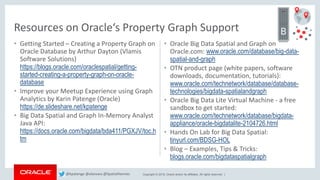
• Topology constraints
▪ (n)–[e]–>(m)
▪ (n)–[e1]–>(m1), (n)–[e2]–>(m2)
▪ (n1)-[e1]->(n2)-[e2]->(n3)-[e3]->(n4)
▪ (n1)-[e1]->(n2)<-[e2]-(n3)
• Label matching
▪ (x:Person) -[e:likes]-> (y:Person)
▪ (:Person) -[:likes]-> (:Person)
▪ (x:Student|Professor) -[e:likes|knows]->
(y:Student|Professor)
• Value constraints
▪ (x) -> (y), x.name = 'John’, y.age > 25
• In-Line constraints
▪ (n WITH name = 'John' OR name = 'James', type =
'Person') -[e WITH type = 'workAt', workHours <
40]-> ()
• …
Syntax form Examples
Basic form (n)-[e]->(m)
Omit variable name of the source
vertex
()-[e]->(m)
Omit variable name of the destination
vertex
(n)-[e]->()
Omit variable names in both vertices ()-[e]->()
Omit variable name in edge (n)-->(m)
Omit variable name in edge
(alternative, one dash)
(n)->(m)
Querying Property Graph Data using PGQL
@kpatenge @alanzwu @SpatialHannes](https://image.slidesharecdn.com/20180612oraclecodegraphblockchainbitcoinkpatengehviehmann-180614130429/85/OracleCode_Berlin_Jun2018_AnalyzeBitcoinTransactionDataUsingAsGraph-22-320.jpg)
![Copyright © 2018, Oracle and/or its affiliates. All rights reserved. |
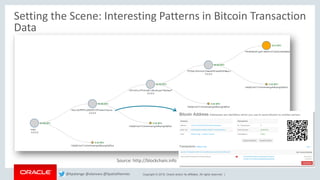
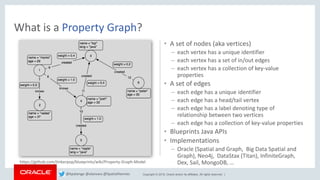
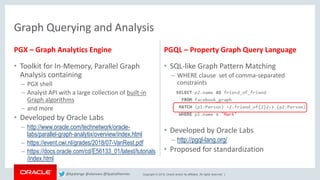
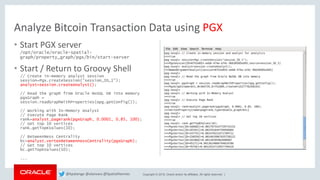
Query Bitcoin Transaction Data using PGQL
// Some PGQL queries
// Explore relationships in the graph
pgxResultSet = pgxGraph.queryPgql("SELECT e.label(),
count(*) WHERE (n) -[e]-> (m) GROUP BY e.label() ORDER BY
count(*) DESC");
pgxResultSet.print();
// Find top most collaborative Bitcoin addresses
pgxResultSet = pgxGraph.queryPgql("SELECT n, count(*) WHERE
(n) -[e:contrib]-> (m) GROUP BY n ORDER BY count(*) DESC
LIMIT 10");
pgxResultSet.print(3);
// Find top least collaborative Bitcoin addresses
pgxResultSet = pgxGraph.queryPgql("SELECT n, count(*) WHERE
(n) -[e:contrib]-> (m) GROUP BY n ORDER BY count(*) ASC");
pgxResultSet.print(3);
// InDegree count
pgxResultSet = pgxGraph.queryPgql("SELECT y.id(),
y.bt_addr, x.inDegree() WHERE (x) -> (y), x.inDegree() >
1000 ORDER BY x.inDegree() DESC");
pgxResultSet.print(3);
...
https://blogs.oracle.com/bigdataspatialgraph/how-many-ways-to-run-property-graph-query-language-pgql-in-bdsg-i
@kpatenge @alanzwu @SpatialHannes](https://image.slidesharecdn.com/20180612oraclecodegraphblockchainbitcoinkpatengehviehmann-180614130429/85/OracleCode_Berlin_Jun2018_AnalyzeBitcoinTransactionDataUsingAsGraph-23-320.jpg)


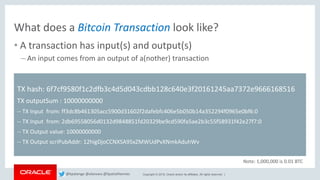
This document discusses analyzing Bitcoin transaction data as a graph using Oracle technologies. It provides an overview of modeling Bitcoin transactions as a graph with transactions and addresses as vertices and relationships between them as edges. It then describes the workflow of preparing the data, loading it into a graph database, and analyzing the graph using PGX and PGQL. Examples are given of graph queries and algorithms like PageRank and betweenness centrality that can be run on the Bitcoin transaction graph to identify important transactions and addresses.