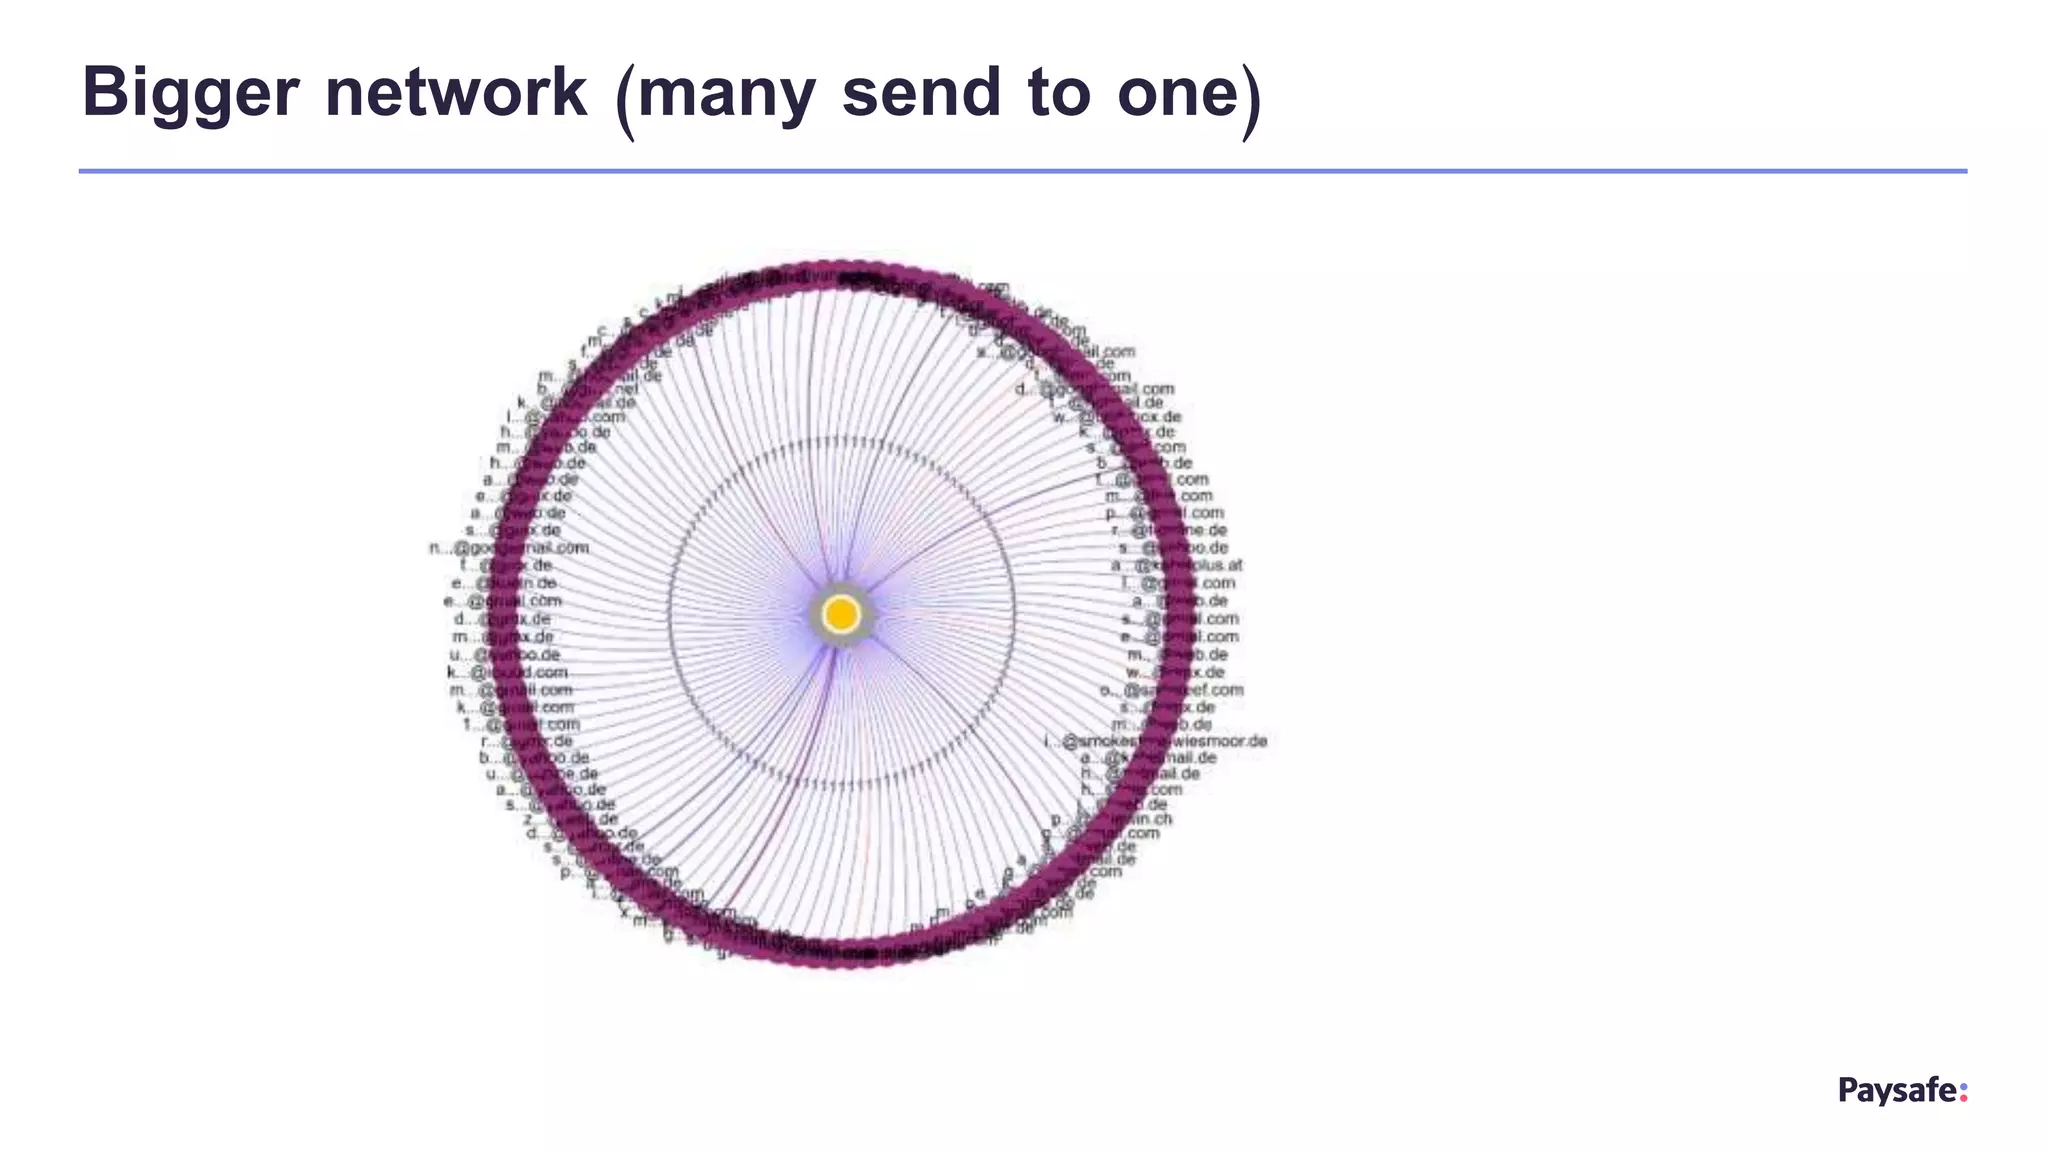
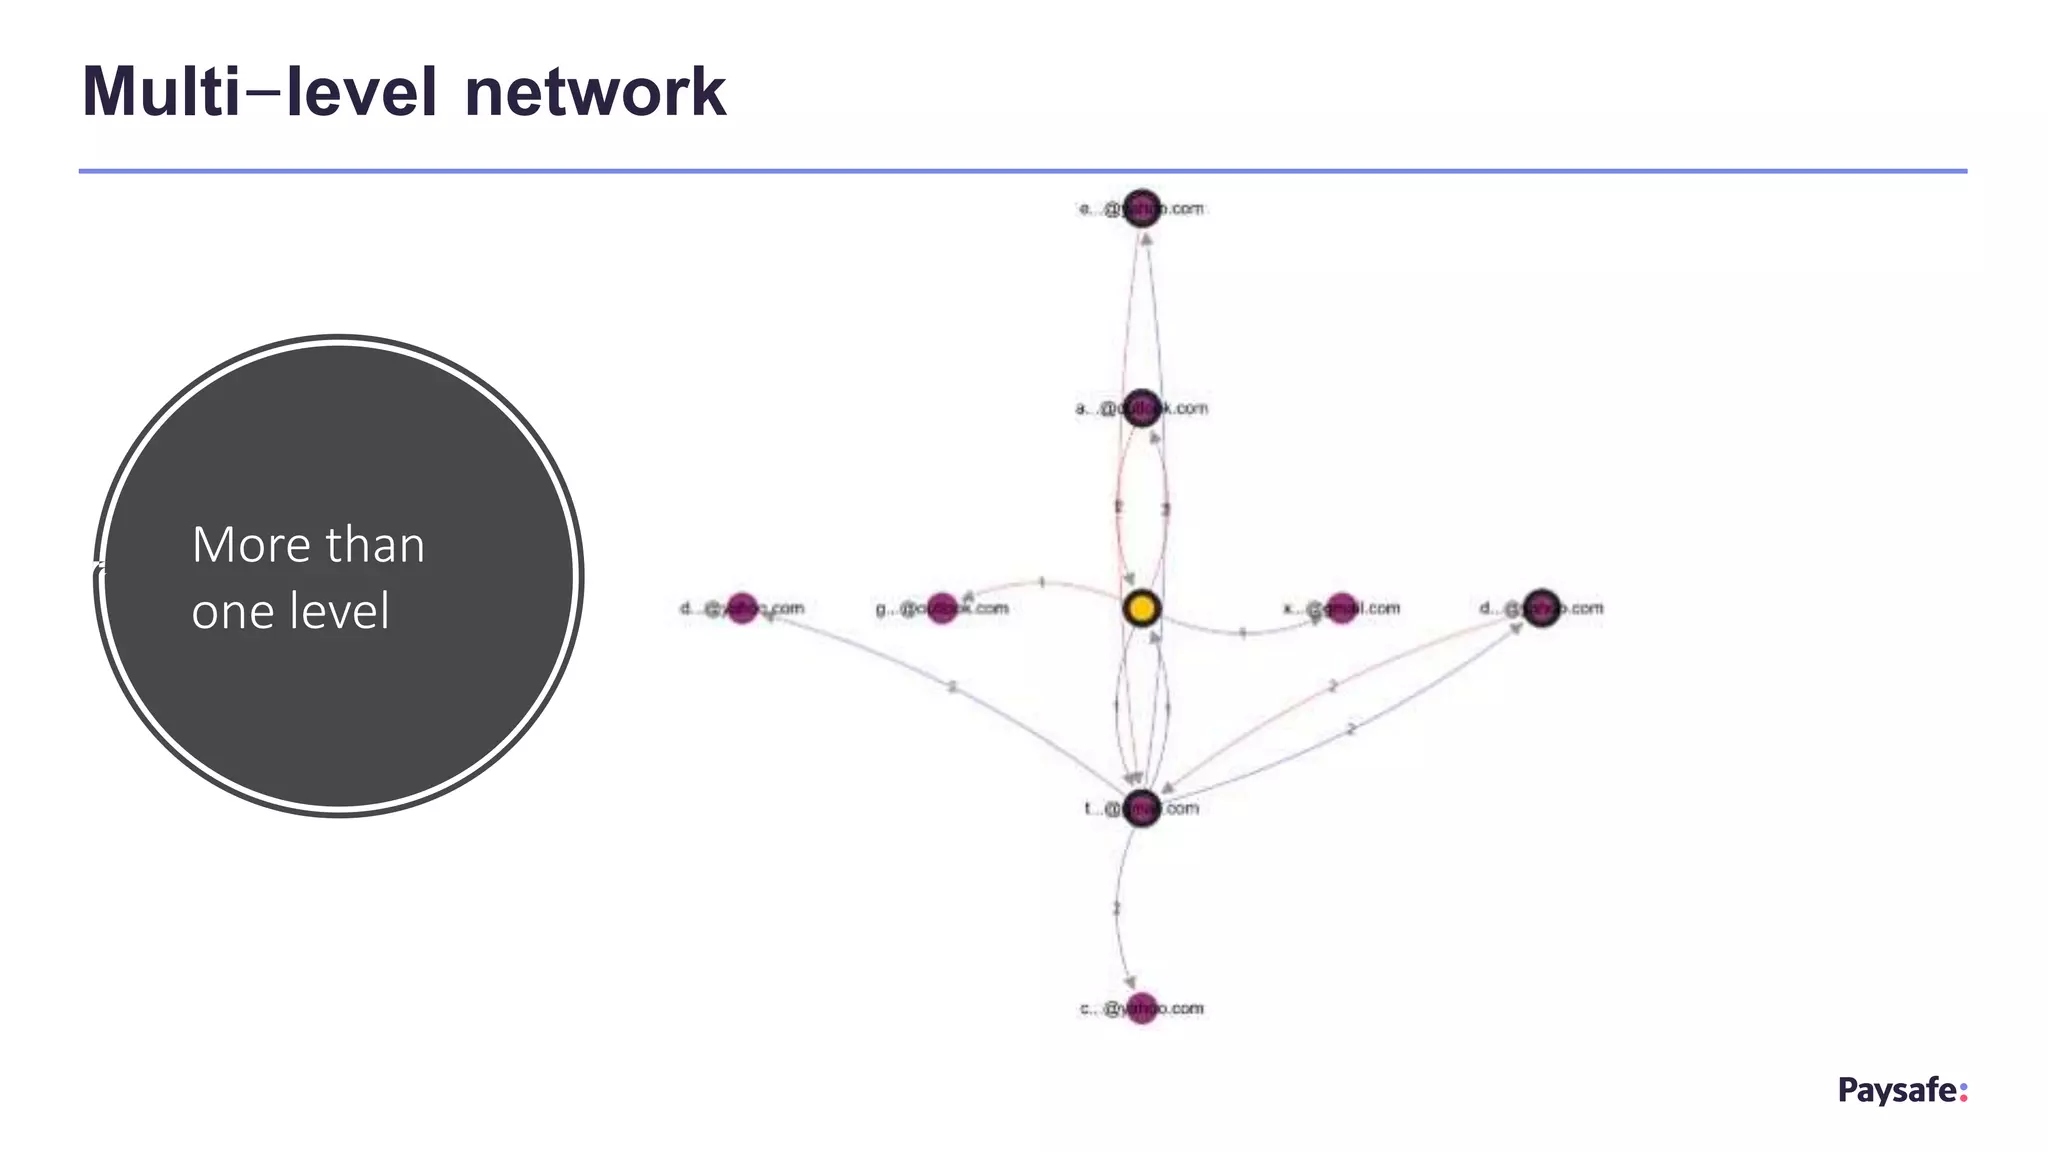
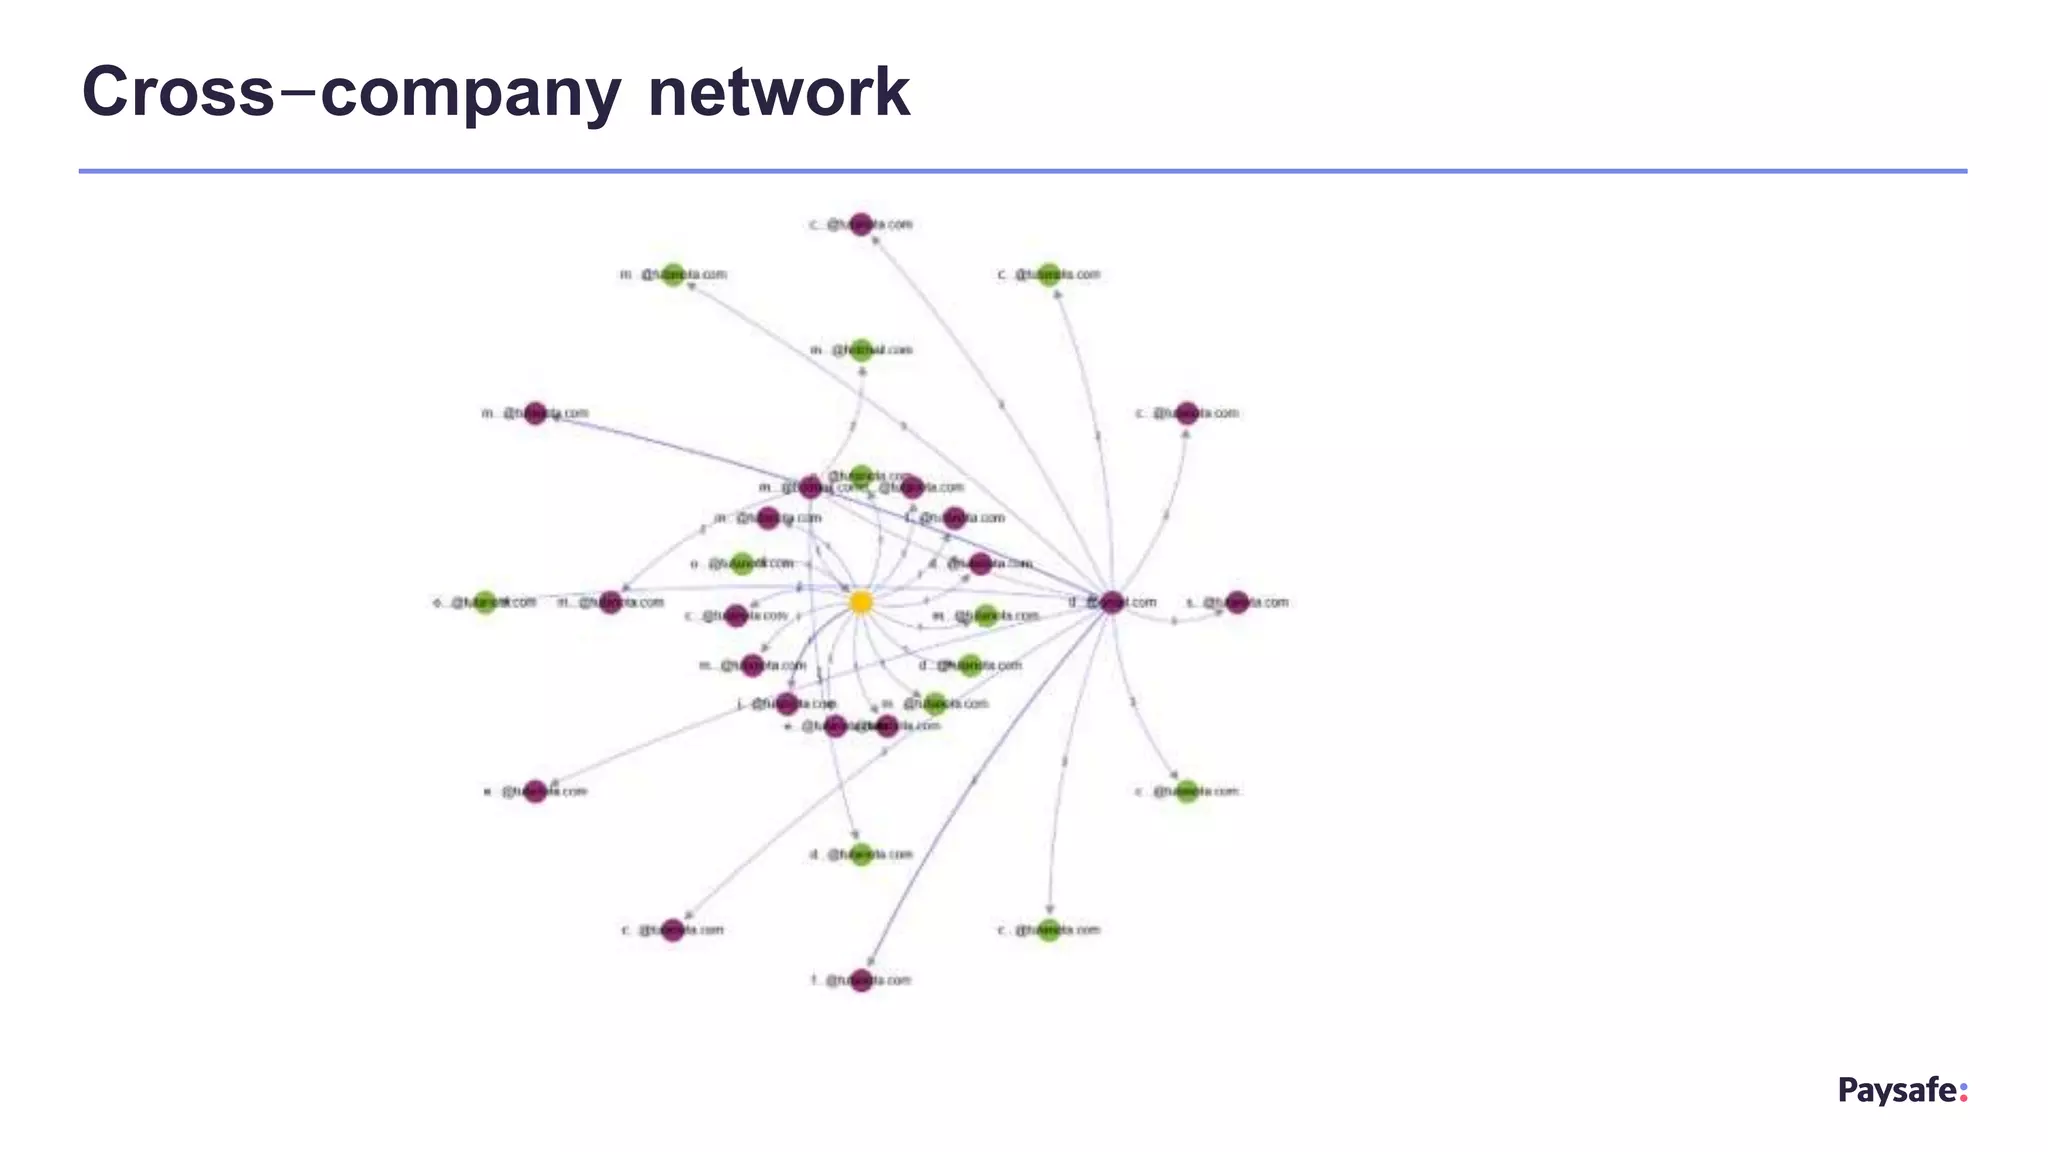
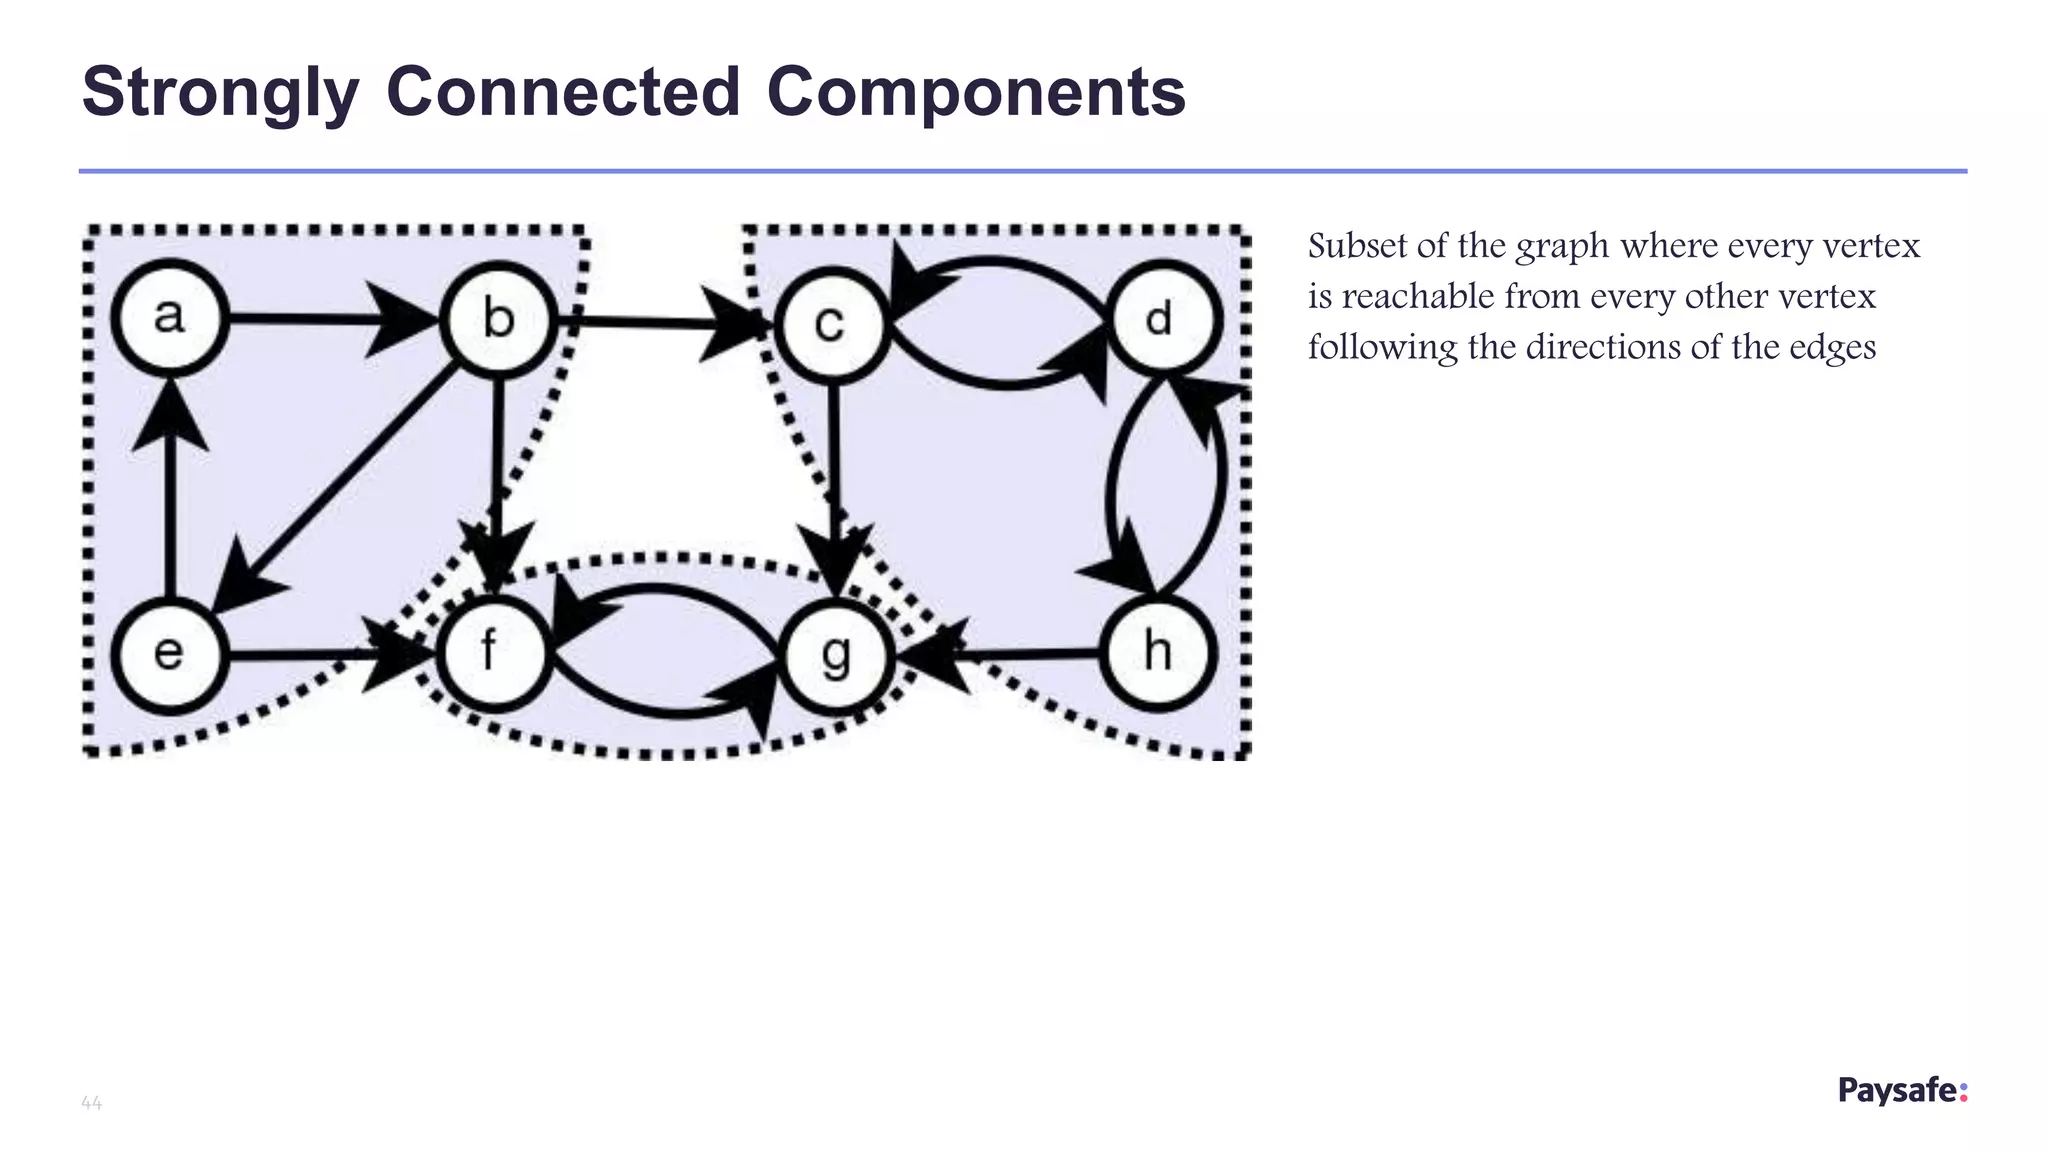
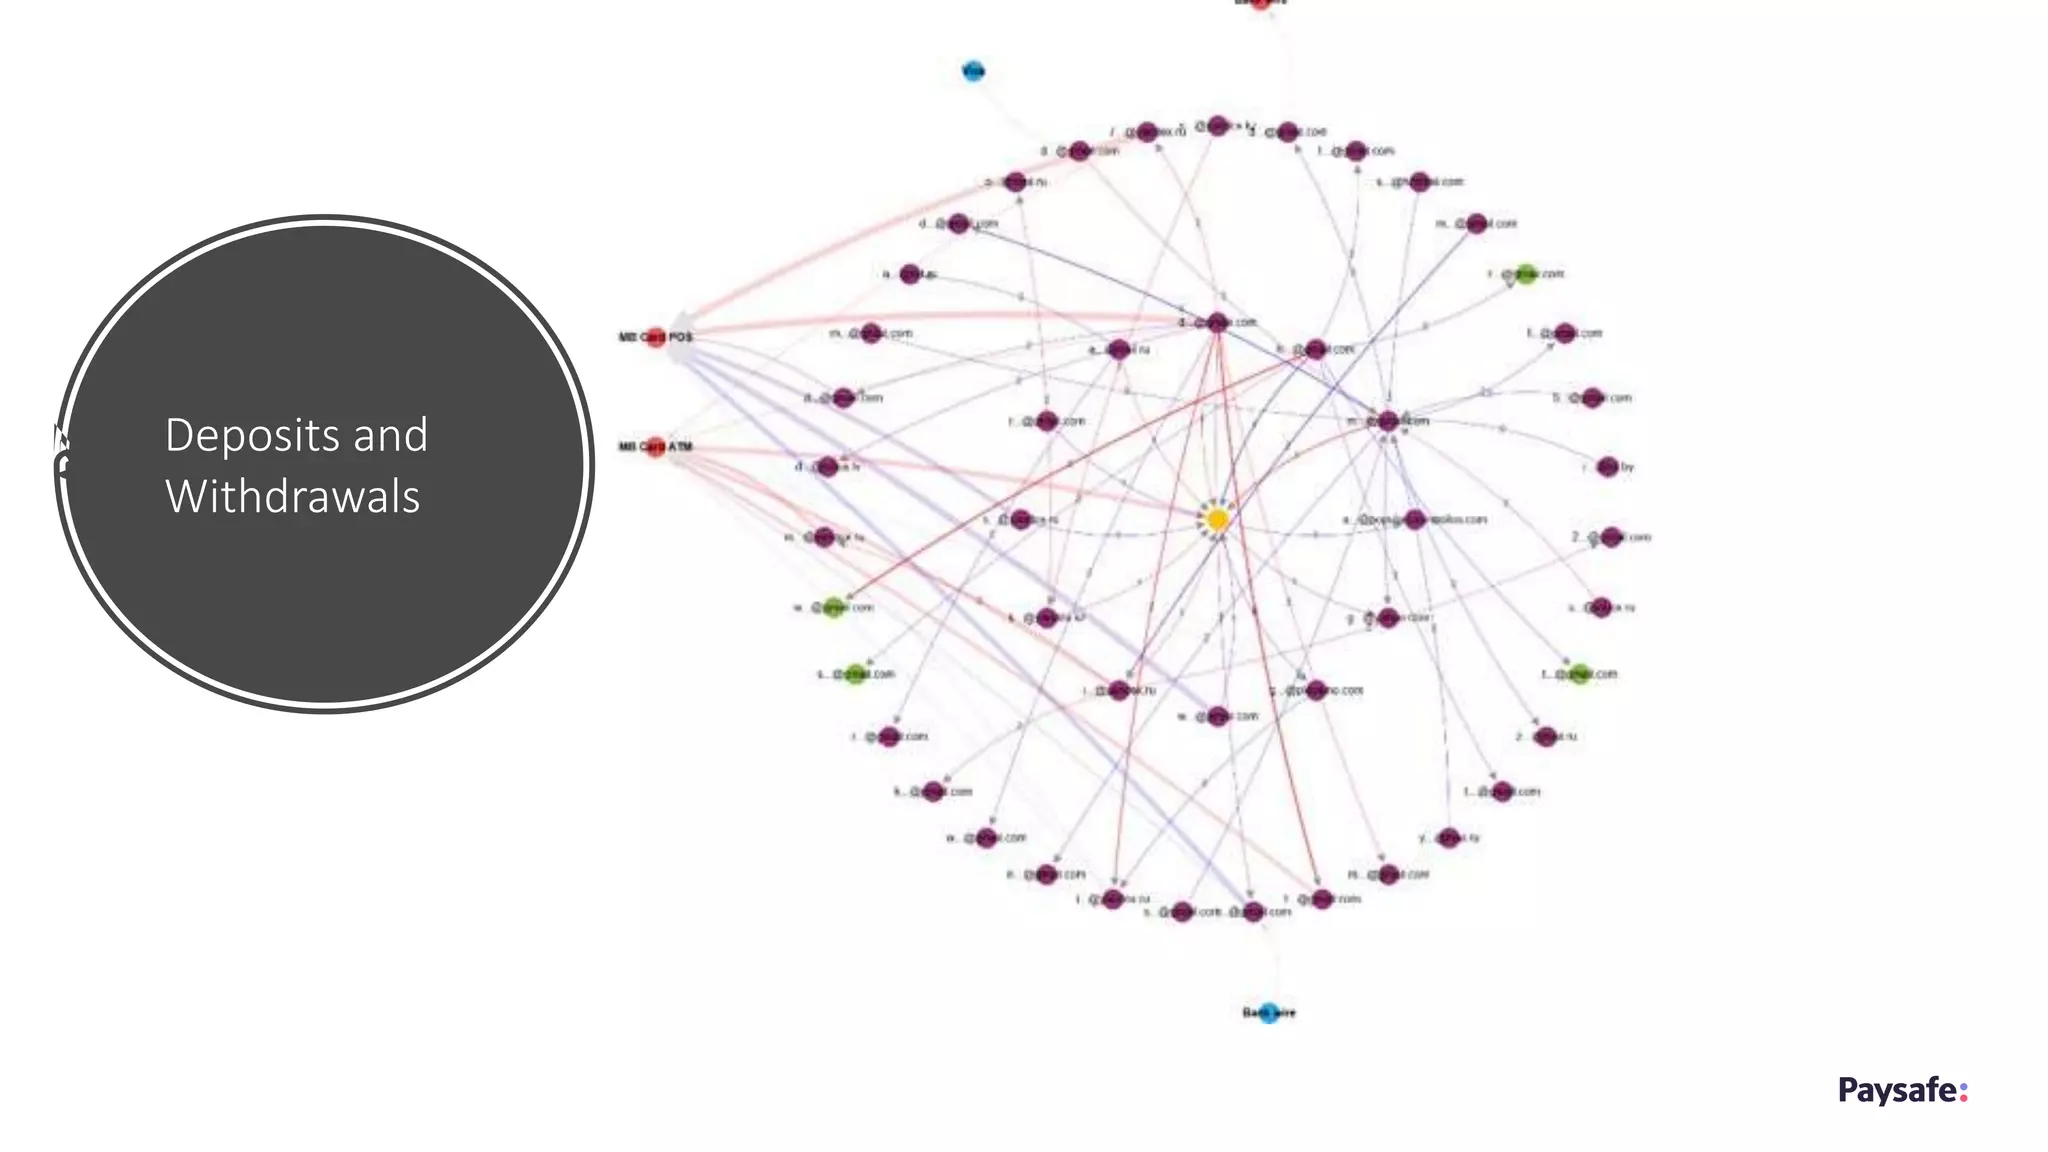
Every year the financial industry loses billions because of fraud while in the meantime fraudsters are coming up with more and more sophisticated patterns.
Financial institutions have to find the balance between fraud protection and negative customer experience. Fraudsters bury their patterns in lots of data, but the traditional technologies are not designed to detect fraud in real-time or to see patterns beyond the individual account.
Analyzing relations with graph databases helps uncover these larger complex patterns and speeds up suspicious behavior identification.
Furthermore, graph databases enable fast and effective real-time link queries and passing context to machine learning models.
The earlier fraud pattern or network is identified, the faster the activity is blocked. As a result, losses and fines are minimized.
1. 1
Follow the money – using graph databases for
fraud analytics
Stanka Dalekova, Yavor I. Ivanov, Dobroslav Hristov
@PlugIntoPaysafe
2. 2
• Atypical Combinations and Scientific Impact
Brian Uzzi, Satyam Mukherjee, Michael Stringer, Ben Jones
Science, 25 Oct 2013
• Studied 17.9 million research articles across five decades of the Web of Science, the
largest repository of scientific research
• Novelty is an essential feature of creative ideas, yet the building blocks of new ideas are
often embodied in existing knowledge
Innovation
3. 3
• Who are we
• Use Case
• Why we need graph databases?
• Our results so far
• What’s next
Agenda
4. 4
Who are Paysafe?
• Paysafe provides simple and secure payment solutions to businesses of all sizes around the world.
• 1 billion revenue in 2017
• Real-time Payments
• Two e-wallet services
Neteller
Skrill
5. 5
• ~ 500 000 payments per day
• Fines on any fraud payment
• Allowed ratio of fraud per channel
• Balance between fraud protection and negative customer experience
• Fraudsters bury their patterns in lots of data.
• Inter-service fraud
Use Case – Fast Fraud Analytics
7. 7
• Fraud Benchmark Report by Cybersouce from 2016
– 83 % of North Americans review 29% of the orders manually,
– Fraud analysts can give insights about fraud patterns and customer behavior
– After manual review, rule engines can be updated
– Manual Review are costly and time-consuming
– Decreasing customer experience by delaying the payment
• Fraud prevention industry benchmark by Kount.com from 2018
– 93 percent of merchants perform manual reviews
– nearly 30 percent have a manual review rate between 1 and 5 percent
– 16 percent review between 5 and 10 percent
– 20 percent review more than one-in-ten of their orders.
Manual Review Metrics
8. 8
Machine Learning (ML) is an efficient way for a business to predict which of its payments are likely to result in
chargebacks.
• Pros
– Continuous improvement as more data is processed and more patterns are discovered
– Adapt to new situations without the need of human intervention
• Challenges
– Hard to explain
– Ignorant to connection on data
– Imbalanced data
– Needs good-quality data in order to learn
– A poorly-crafted feature can do more harm than good
– Cold start - when model is retrained on more data, it gets more accurate
Fraud Screening Option – Machine Learning
9. 9
• Provide powerful instruments for investigation
• Enhance machine learning models with features on connected data
• Unlocking new possibilities from connected data
Business perspective and roadmap
13. 13
• Study on mathematical structures used to model pairwise relations between objects
• 250+ years of history - the paper written by Leonhard Euler on the Seven Bridges of
Königsberg and published in 1736 is regarded as the first paper in the history of graph theory
• Graphs are used to model many types of relations and process
• Graphs solve many real life problems - in computer science, social sciences, biology, etc.
• Hundreds of graph algorithms – strongly connected components, paths algorithms, nearest
neighbor, page rank, edge weight algorithms, etc.
Graph Theory
14. A tree is a minimally
connected graph
having only one
path between any two
vertices.
And these are all graphs
What exactly is a graph?
These are all plots
16. 16
Graph databases store data in terms of
• Entities (nodes or vertices)
• Relationships between entities (edges or arrows)
A better way to explore connected data.
Graph Database
18. 18
• TODO: sss of hot articals
Graphs are eating the world
Image courtesy DB-Engines
19. 19
So will Graph Databases EAT EVERYTHING?
Image courtesy medium.com
Not there yet, but
Having the right
instrument for the
right job
20. 20
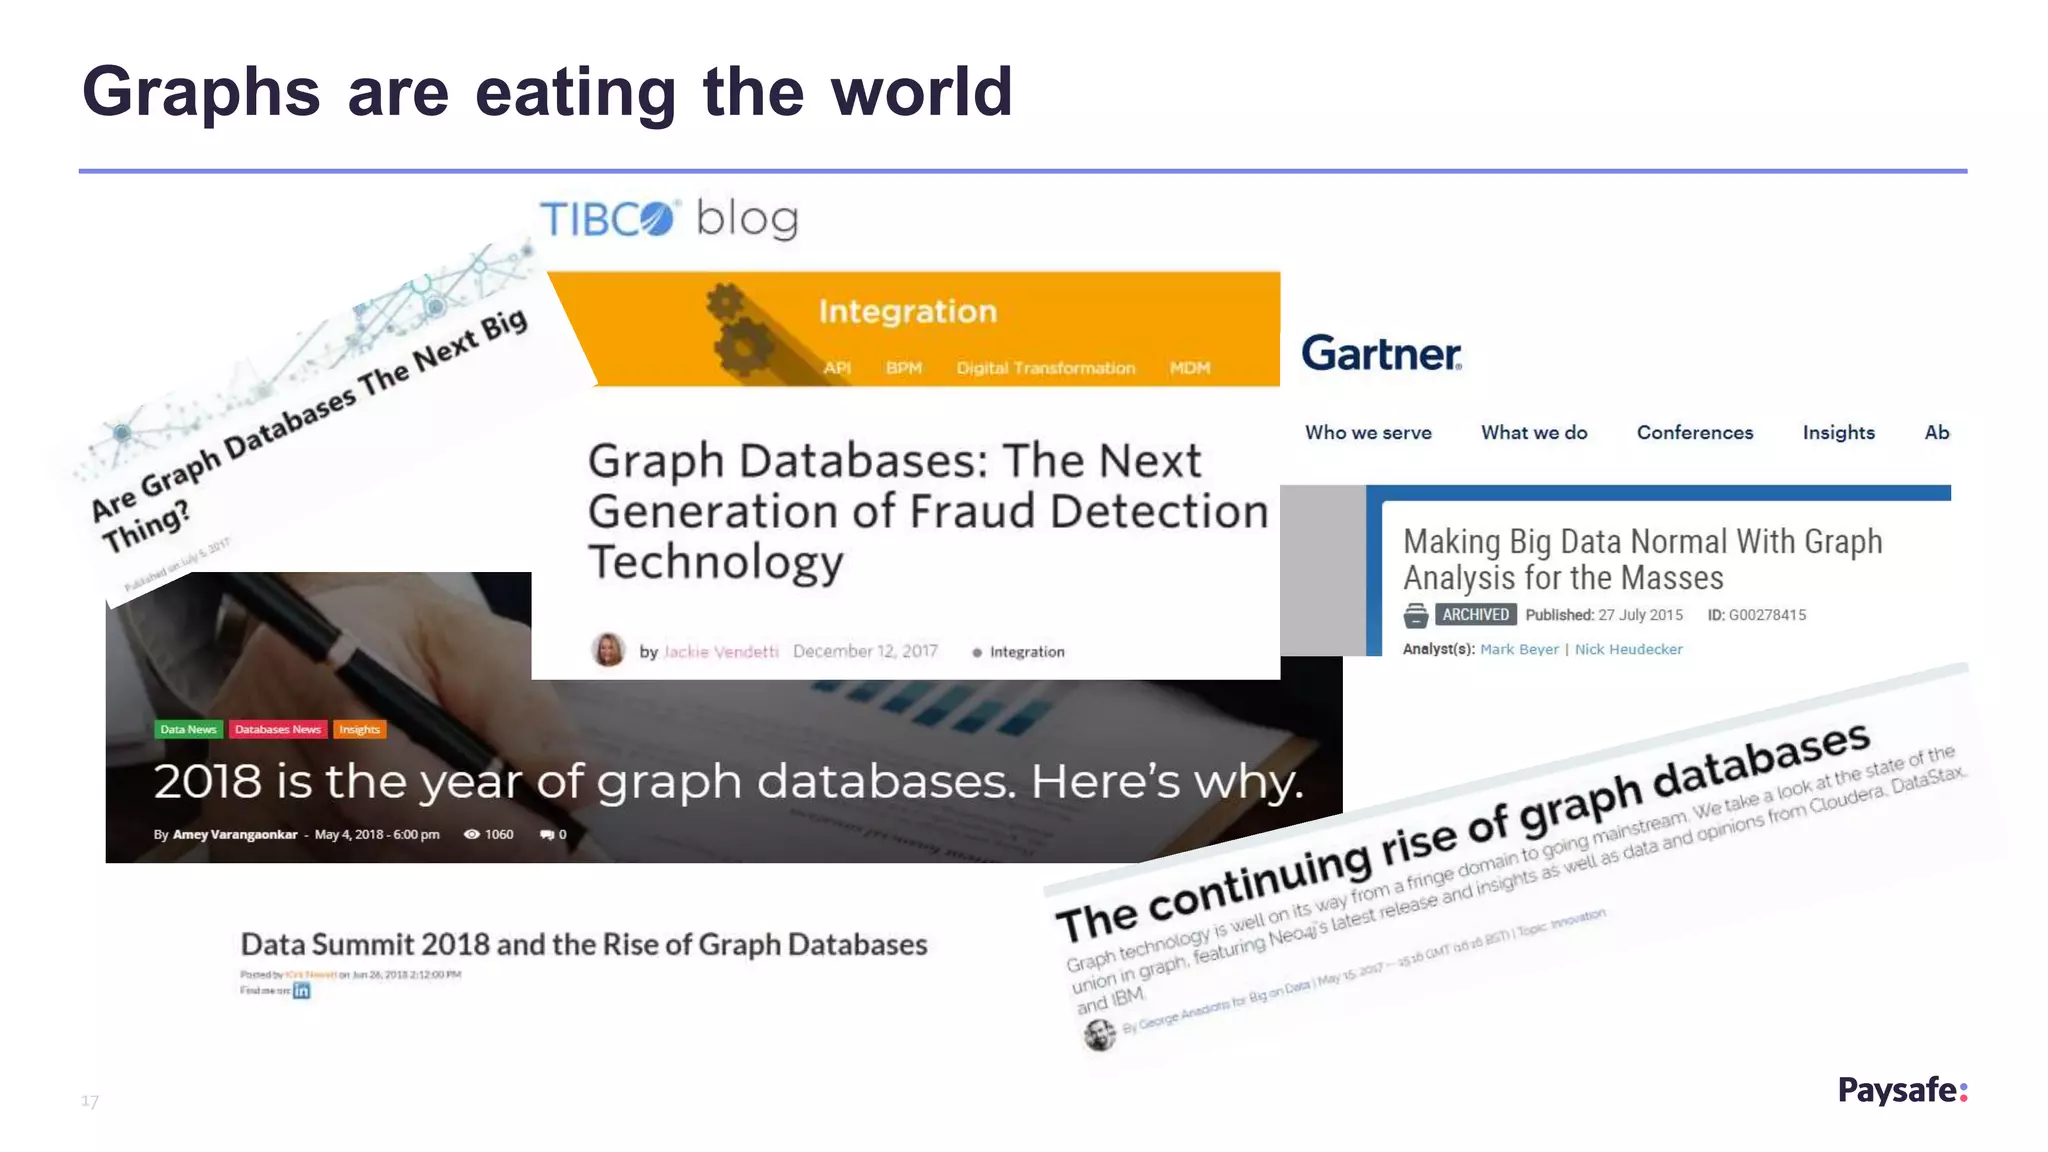
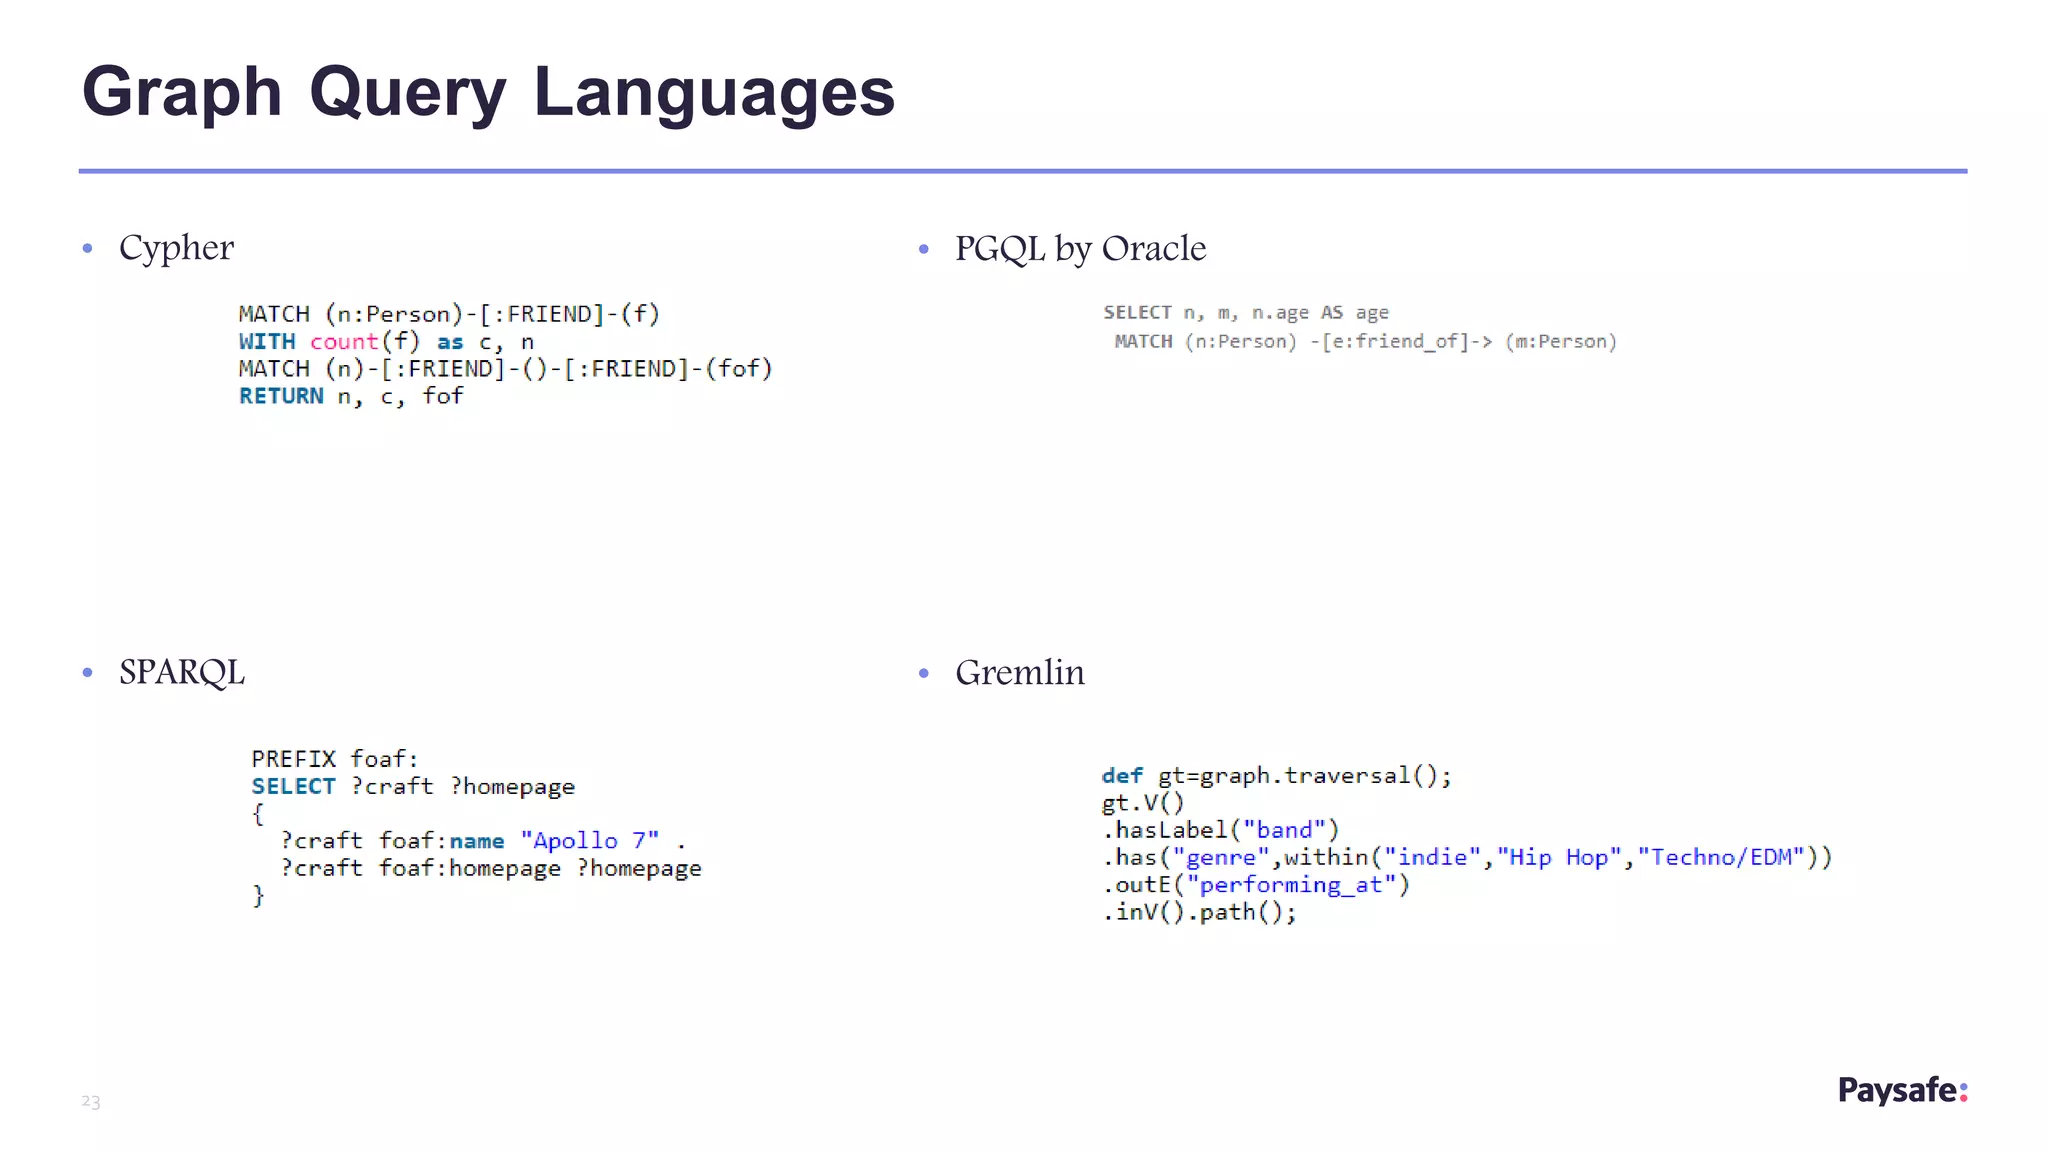
• Pioneer graph databases are several years old
– Neo4j [Cypher]
– IBM Graph [SPARQL and Gremlin]
– JanusGraph [Gremlin] (renamed from TitanDB)
• Gaining more traction recently – new players
– Oracle Spatial And Graph by Oracle (Property Graph 3+ years) [PGQL]
– AWS Neptune by Amazon announced on 30 May 2018 [SPARQL and GREMLIN]
– Azure Cosmos DB by Microsoft Graph API announced on 7 Feb 2018
– Apache Giraph 4+ years
– GraphX by Spark 3+ years
– RedisGraph
Graph databases go mainstream
21. 22
Graph Database Performance
Relational Table vs Graph
Q: Is user "9" connected to user “1“?
If you double the number of rows in the table,
you've doubled the amount of data to search,
and thus doubled the amount of time it takes
to find what you are looking for
You always walk the graph at most once.
Conversely, a graph database looks only at records
that are directly connected to other records. If it is
given a limit on how many "hops" it is allowed to
make, it can ignore everything more than that
number of hops away.
23. 24
SQL vs PGQL
SELECT T2.T AS "s1.fname$T",T2.V AS "s1.fname$V",T2.VN AS "s1.fname$VN",T2.VT AS "s1.fname$VT",
T3.T AS "s2.fname$T",T3.V AS "s2.fname$V",T3.VN AS "s2.fname$VN",T3.VT AS "s2.fname$VT"
FROM (/*Path[*/SELECT DISTINCT SVID, DVID FROM ( SELECT VID AS SVID, VID AS DVID FROM "GRAPH1VT$" UNION
ALL SELECT SVID,DVID
FROM (WITH RW (ROOT, SVID, DVID, LVL) AS ( SELECT ROOT, SVID, DVID, LVL FROM (SELECT SVID ROOT,
SVID, DVID, 1 LVL
FROM (SELECT T0.SVID AS SVID, T0.DVID AS DVID FROM "GRAPH1GT$" T0 WHERE (T0.EL = n'knows'))
) UNION ALL SELECT DISTINCT RW.ROOT, R.SVID, R.DVID, RW.LVL+1 FROM (SELECT T1.SVID AS SVID,
T1.DVID AS DVID FROM "GRAPH1GT$" T1 WHERE (T1.EL = n'knows')) R, RW WHERE RW.DVID = R.SVID )
CYCLE SVID SET cycle_col TO 1 DEFAULT 0 SELECT ROOT SVID, DVID FROM RW ))/*]Path*/) T6,
(/*Path[*/SELECT DISTINCT SVID, DVID FROM ( SELECT VID AS SVID, VID AS DVID FROM "GRAPH1VT$" UNION
ALL SELECT SVID,DVID
FROM (WITH RW (ROOT, SVID, DVID, LVL) AS ( SELECT ROOT, SVID, DVID, LVL FROM (SELECT SVID ROOT,
SVID, DVID, 1 LVL
FROM (SELECT T4.SVID AS SVID, T4.DVID AS DVID FROM "GRAPH1GT$" T4 WHERE (T4.EL = n'knows'))
) UNION ALL SELECT DISTINCT RW.ROOT, R.SVID, R.DVID, RW.LVL+1 FROM (SELECT T5.SVID AS SVID,
T5.DVID AS DVID FROM "GRAPH1GT$" T5 WHERE (T5.EL = n'knows')) R, RW WHERE RW.DVID = R.SVID )
CYCLE SVID SET cycle_col TO 1 DEFAULT 0 SELECT ROOT SVID, DVID FROM RW ))/*]Path*/) T7,
"GRAPH1VT$" T2, "GRAPH1VT$" T3
WHERE T2.K=n'fname' AND T3.K=n'fname' AND T6.SVID=T2.VID AND T6.DVID=T7.DVID AND T7.SVID=T3.VID
ORDER BY T6.SVID ASC NULLS LAST, T7.SVID ASC NULLS LAST
PATH knows_path := () -[:knows]-> ()
SELECT s1.fname, s2.fname
WHERE (s1) -/:knows_path*/-> (o) <-/:knows_path*/-(s2) ORDER BY s1,s2
• PGQL
• SQL
Find the pairs of people who are
connected to a common person
through the “knows” relation
24. 25
• Neo4J – completely new setup, transactional storage not needed, big community, easy to setup, expensive,
cypher is simple yet powerful language. Good visualization tools
• Dgraph – easy to setup, GraphQL hard for data scientists, lacks key features like DISTINCT
• Oracle Spatial and Graph – easy fit with our single source of truth - Oracle RDBMS, PGQL is simple yet powerful,
GoldenGate ingetration, Cytoscape visualization, D3, linkurious,Tom Sawyer, PgWiz?
• Redis Graph – supports open cypher, tested it but does not supported more then one outgoing edge at the time.
Still, nice product and actively developed.
• AgensGraph – runs on PostgreSQL
Graph Databases Considered
25. PGX Architecture in Paysafe
Graph storage management
PGX Graph Analytics
Java,Groovy,Python,…
REST/WebService/Notebooks
Java APIs
Java APIs/JDBC/SQL/PLSQL
Parallel In-Memory Graph
Analytics/Graph Query (PGX)
Oracle RDBMS
Parallel In-Memory Graph
Analytics/Graph Query (PGX)
PGX Graph Analytics
Vert.x Application Server
REST
Web User Interface Load Balancer
Vert.x Application Server
Graph storage management
27. • PGX (Parallel Graph AnalytiX) is a fast, parallel, in-memory graph analytic framework that allows users to load
up their graph data, run analytic algorithms on them, and to browse or store the result.
• Requires the whole graph and the properties needed for the analysis to be loaded into main memory
• Compressed sparse row (CSR) format, a data structure which has minimal memory footprint while providing
very fast read access.
• Our graph in size – initial load ~ 3GB for one year graph (15 623 078 edges, 6 properties and 3 133 540
vertices and 3 properties).
• More info on graph memory consumption can be found here
• On heap memory only string properties
• Off heap memory everything else – graph topology(edges and vertices) and properties
• Asynchronous Java API
Hardware requirements & sizing
28. Payments Flow Visualization
• Cytoscape is an open source software platform for visualizing complex networks and integrating these with
any type of attribute data.
• There is a JS library supporting many different layouts
• Make asynchronous call for any hop, display up to 10 hops in seconds
39. • Page rank
• Community detection
• Strongly connected components
• More built-in algorithms available
• Custom-defined algorithms with Green Marl
Graph Analytics
40. 44
Subset of the graph where every vertex
is reachable from every other vertex
following the directions of the edges
Strongly Connected Components
41. 45
Subset of the graph where every vertex
is reachable from every other vertex
(directions of the edges are ignored)
Weakly Connected Components
42. Finding sets of nodes such that each set of nodes is densely connected internally.
Community structures are quite common in real networks. Social networks
include community groups (the origin of the term, in fact) based on common
location, interests, occupation, etc.
Community Detection
43. PageRank (PR) is an algorithm used by Google Search to rank websites in
their search engine results. The PageRank algorithm outputs a probability
distribution used to represent the likelihood that a person randomly clicking
on links will arrive at any particular page
Page Rank
52. 56
• Finding all communities for a given day up to 3 minutes
Community detection for 24-hour period: 12:42:16 - 12:43:29 – 73 sec
SCC for the same period: 12:45:19 - 12:47:57 – 158 sec
Top 10 Customers Page Rank: ~0.4 sec
• Memory statistics
Total edges count: 17 .5 M with 100M properties
Edges size in DB: 20 GB (only the table)
Total vertices count: 3.5M with 10.5M properties
Vertices Size in DB: 1.6 GB (only the table)
Graph in size in PGX memory - 3GB
• Visualizing customer graph, up to seconds, but still depending on the relations
• Performing PGQL query in milliseconds – can be used in real-time
Use Case Performance Results
53. 57
Anti-Fraud Techniques Toolbox
• Rule Engines
• Graph Technologies and Databases
• ML algorithms
• Customer verifications
– Device Fingerprinting - A device fingerprint, machine fingerprint, or browser fingerprint is information collected about a
remote computing device for the purpose of identification
– Customer Data Verification (Address, Name, etc)
54. 58
Rule Engines
A business rules engine is a software component that allows non-programmers to add or change business logic in a business process
management system. A business rule is a statement that describes a business policy or procedure.
• Examples: Accertify, ReD, FeedZai, etc.
• Pros
– Most popular and widely spread; Easy to define velocity, legal, regulation checks, can be explained
– Easy to add and manipulate rules by non programmers, ex: fraud analysts
• Cons
– Rules-based engines require active management
– Hard to detect evolving patterns
– identifying new patterns
– removing outdated rules
– When more and more rules are added, e.g. if more than 1000, it gets hard to see the big picture
– Rules-based engines are one size fits all
Rules are hard to manage, even if they are grouped
55. 59
Machine Learning Models
• Examples: Identity, Behavior and Network Score implemented
using logistic regression, random forest, etc.
• Pros
– especially good at identifying patterns and
spotting anomalies in data.
• Cons
– Machine learning is not a silver bullet for
fraud prevention. It takes a significant amount of data
for machine learning models to become accurate.
– Machine learning lacks context on multi-hop relations
ARTIFICIAL INTELLIGENCE
Programs with the ability to learn and reason
like humans
MACHINE LEARNING
Algorithms with the ability to learn without
being explicitly programmed. Uses statistical
techniques that enables machines improve
at task with experience(a lot of data
examples)
DEEP LEARNING
Subset of ML in which artificial
neural networks adapt and learn
from vast amounts of data
56. Graph Technologies and Databases
Graph Databases are invented to solve the performance problems of connected data.
• Example
– If customer is linked with fraudster in range 2 hops, additional verification can be requested
– Is there a fraudster in range of 3hops, 4hops, etc. can be a highly predictive ML feature
• Pros
– Graph queries can be used as normal SQL queries to flag a risk transaction while the payment is being processed
– Graphs enhance AI by providing context by enabling connected features to ML. Relations or connected features tend
to be highly predictive.
• Cons
– Horizontal scaling remains a challenge
57. Modern Anti-Fraud Engines will be a synergy of all three
Rule Engine:
Takes decision
to process or fail
payment
Graph Query
Example: Is there fraudster in 3
payments distance?
Graph Query
Example: Do we have linked
by password customer in 3
payments distance?
Example: Pass fraud probability as
fact to the rule engine
Graph
Database
Machine
Learning
58. • Provide powerful instruments for investigation
• Enhance machine learning models with features on connected data
• Unlocking new possibilities with connected data
Business perspective and roadmap
60. • In a world of real-time payments, money processing becomes faster and more
automated. Fraud checks upon payment should happen fast and the time to identify
fraud patterns or networks is really narrow.
• Link analysis can enhance fraud detection by running queries using graph database
during key stages in the application lifecycle
– Upon money move
– Account creation
– During investigation
– When some thresholds are hit
• Traditional technologies are not designed to detect fraud in real-time. Graph databases
enable fast and effective real-time link queries real-time.
Summary
61. • Graphs are useful for real-time decision making on connected data
• Powerful data analytics
• Go step further with machine learning models
• You can do so much AI with Graph
Takeaways
64. Resources
O’Reilly’s Graph Databases: New Opportunities for Connected Data
O’Reilly’s Graph Algorithms Book
Graph Databases: The Next Generation of Fraud Detection Technology
Cypher – graph query language
Oracle Property Graph Query Language
Link Prediction
Graph Theory with Applications
Very interesting talk:
How Graph Technology Is Changing Artificial Intelligence and Machine Learning