Download to read offline


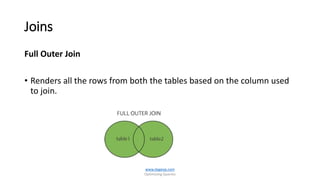


The document is a comprehensive guide on optimizing SQL queries, focusing on distinguishing among query types including point, multipoint, range, prefix match, extremal, ordering, grouping, and joins. It details the syntax and applications of spatial data types in SQL Server, along with examples for each query type. The author, Dr. Subramani Paramasivam, provides insights into effectively using these query types for data manipulation and analysis.