Download as PDF, PPTX


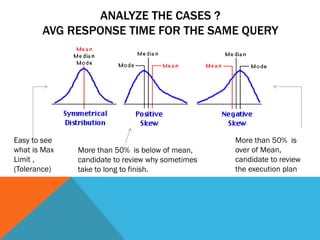

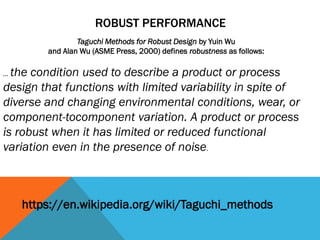


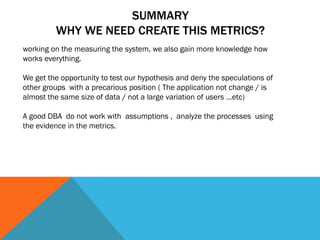
![FIND SLOWEST AND NOT PREDICTABLE
QUERIES
Column ct (Count times executed) = Bucket 1 + Bucket2 + Bucket3 + Bucket4 + Bucket5
Example
SQL_ID=1kahr9dw1rqbu ,executed = 3942 times, Avg = 7 Segs
Bucket1 = [0..98 Segs ] 3862 times 97% , Bucket5 [396-490 Segs] 20 times
Less predictable of SQL_ID 06amz8tcpwtuz and the VMR show this.](https://image.slidesharecdn.com/otn2015strategyrobustperformance1-150823132353-lva1-app6891/85/Crating-a-Robust-Performance-Strategy-17-320.jpg)


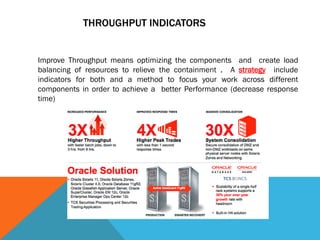
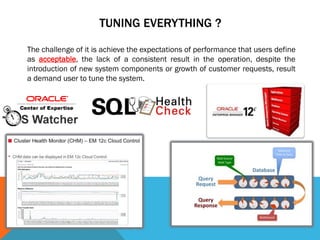
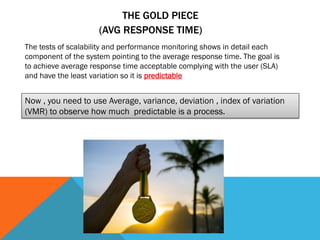
This document profiles an Oracle DBA with over 18 years of experience. It lists their work experience including being Vice President of an Oracle user group in Guatemala since 2014 and a member of various Oracle communities. It also references a blog they co-wrote with an Oracle Ace from Argentina. The rest of the document discusses performance tuning concepts and strategies including analyzing response times, throughput indicators, and using metrics like average, variance, and dispersion to understand predictability. It provides examples of using Oracle tools to collect job and query timings and demonstrates analyzing backups and elapsed times. The goal is to identify the slowest or least predictable processes or queries for further optimization.