Download as PDF, PPTX
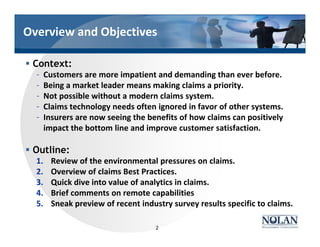
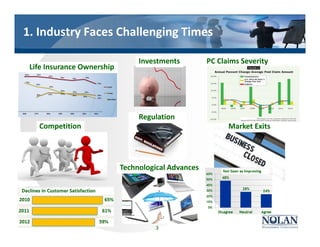
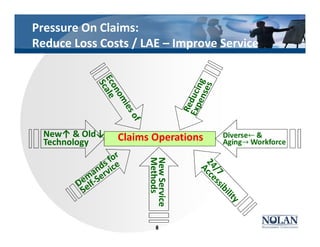
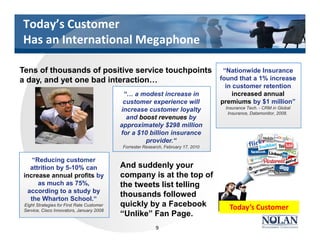
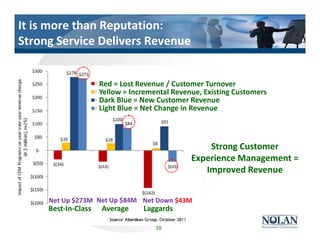
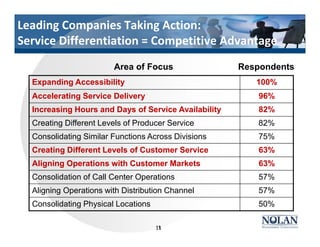
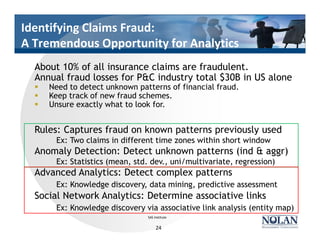
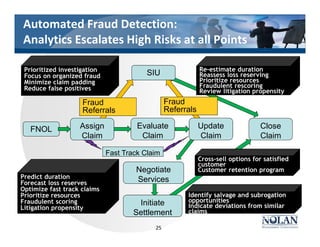
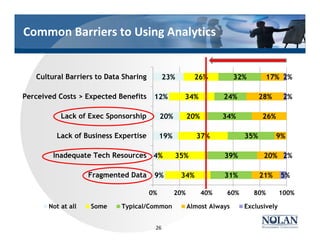
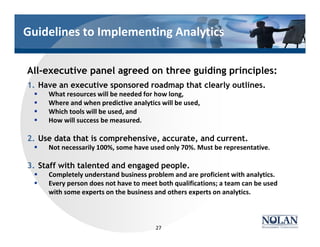

The document discusses the need for modernizing claims systems in the insurance industry to improve customer service and satisfaction, driven by rising customer expectations and competitive pressures. It outlines best practices, the importance of analytics in claims management, and highlights the opportunities provided by remote capabilities and mobile technology. Additionally, it presents recent survey results that emphasize the growing significance of effective claims management in enhancing profitability and customer loyalty.


