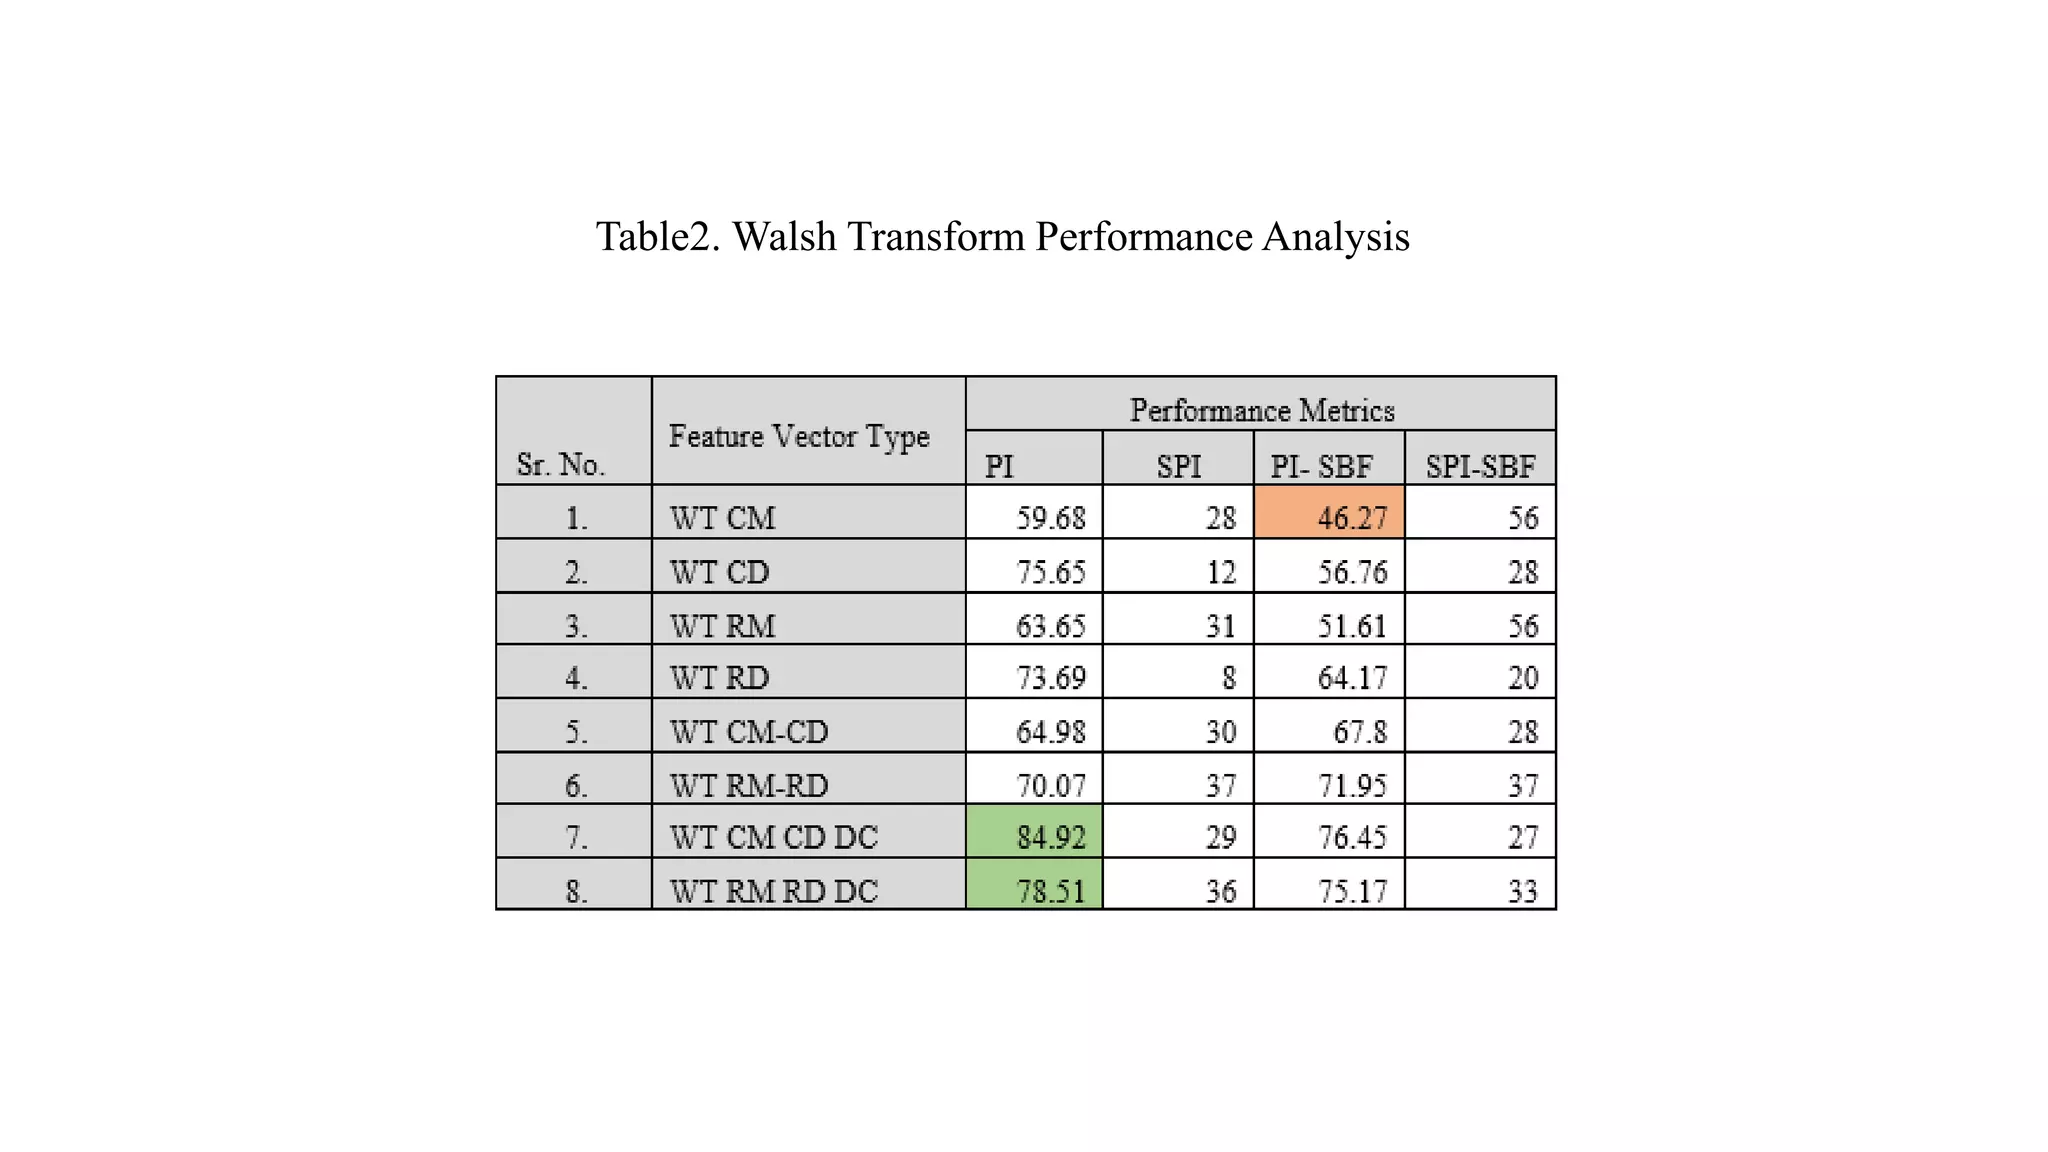
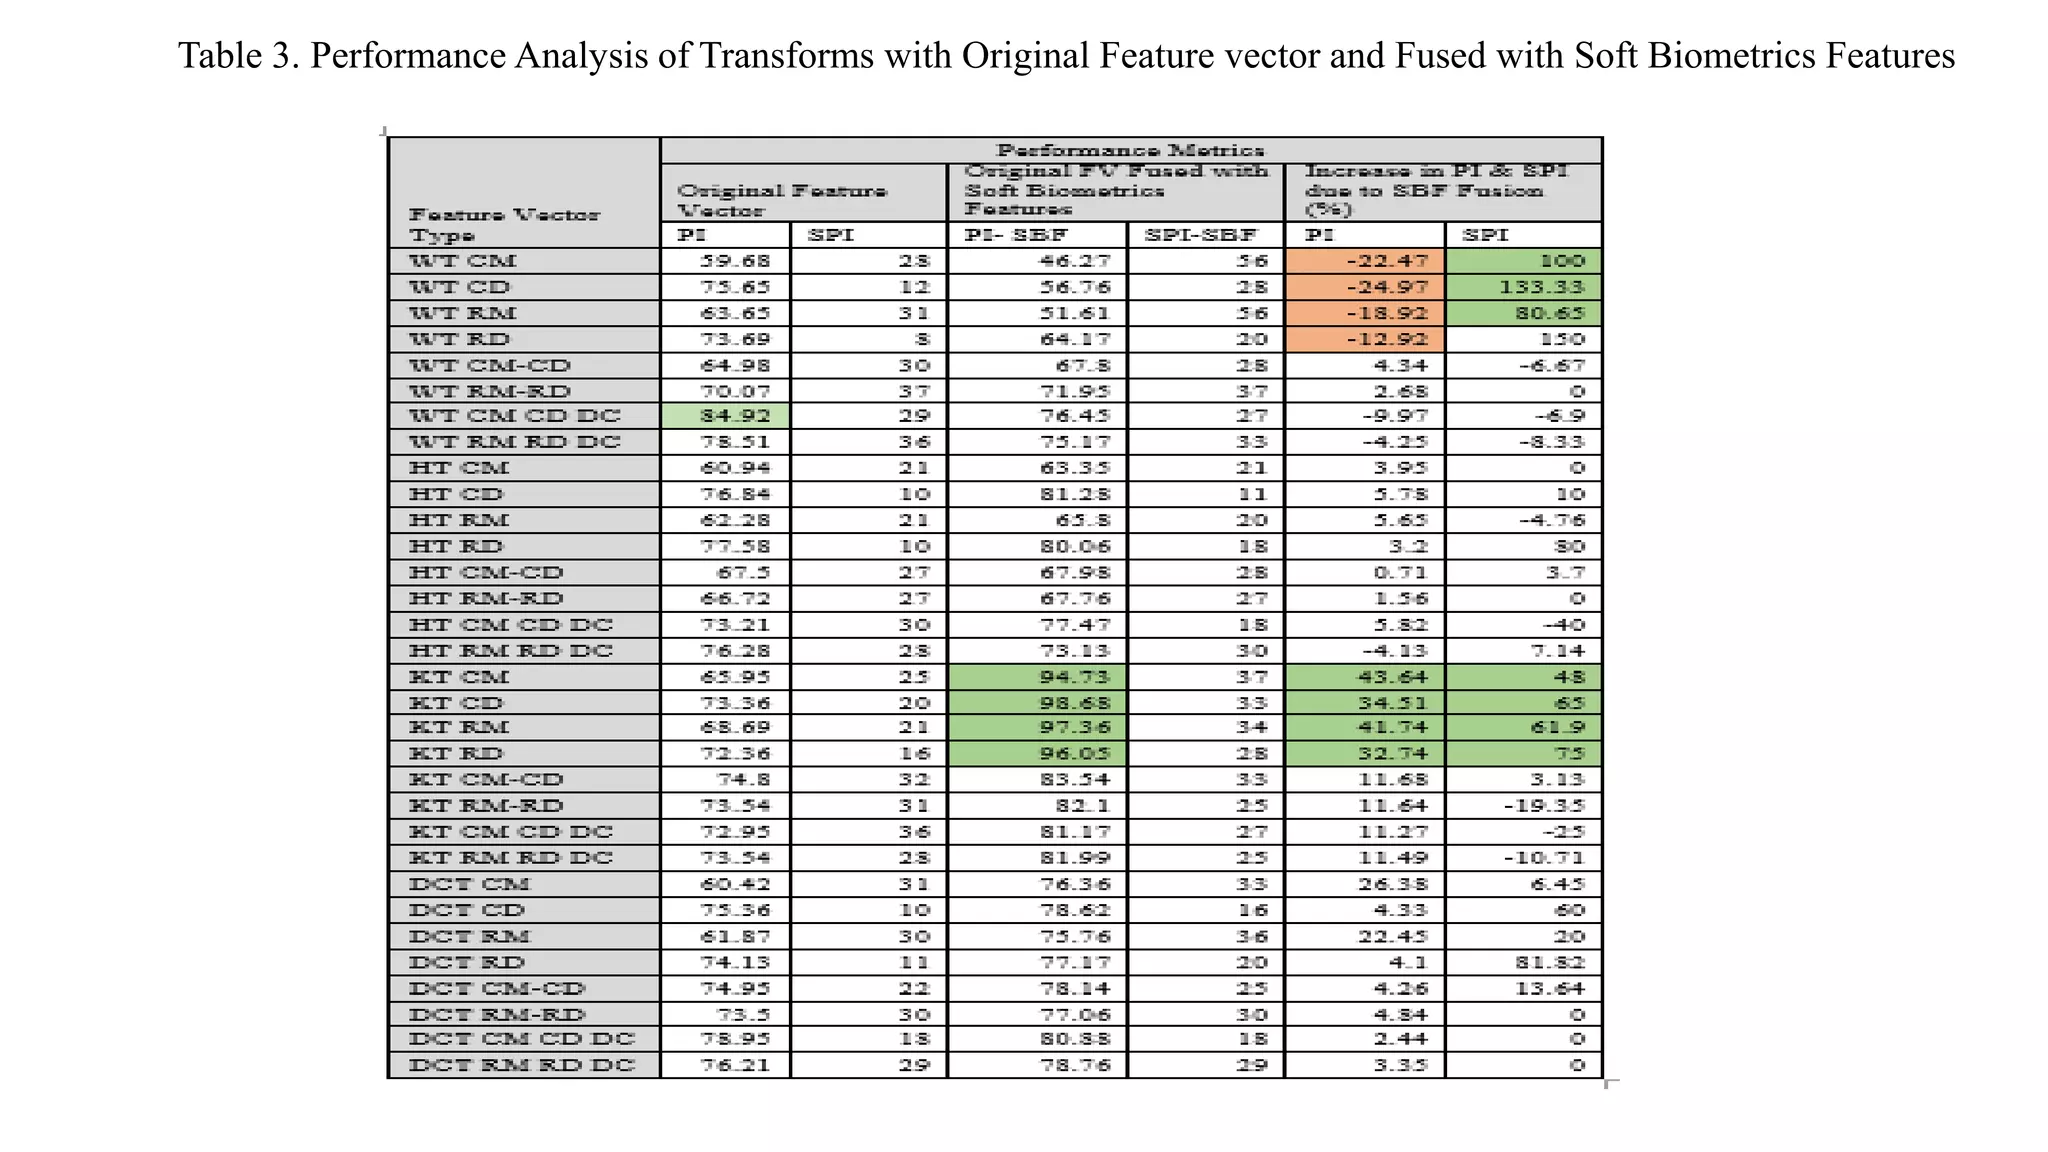
Online Signature Recognition Using Sectorization
of Complex Walsh Plane
By
Shah Avani
Guided By
Dr. Vinayak A. Bharadi
Abstract
• Online signature is one of the biometric trait which is used for verification and identification.
• The online reference signature acquired through a digitizing tablet with their Dynamic
characteristics along with it Modified Digital Difference Analyzer Algorithm (MDDA) has been
proposed to interpolate the dynamic signature point to reconstruct signature with maximum
possible points.
• For extracting the features of the signature intermediate transforms of Column and Row will be
evaluated. Sectorization of complex Walsh plane concept is used, on which the Cal and Sal
function are plotted for intermediate transform.
• Plotted in blocks which are square shaped and the mean values of the transform coefficients in
each block are calculated. Along with DC component and Sequency components of first and last
row/col separates means and density of the Cal (Cosine Walsh) and Sal (Sine Walsh) component
lastly they combine together to form the feature vector referred as Unimodal feature or as Multi
Algorithmic features.
Introduction
• Biometrics comprises methods for uniquely recognizing humans based upon
one or more intrinsic physical or behavioral traits.
• Physiological are related to the shape of the body.
• Behavioral are related to the behaviour of a person. Examples like Gait, Voice,
Signature and Key Stroke.
Physiological & Behavioral Biometric Traits
Fig. 1. Different types of Biometric Modalities
Problem Statement
• Online signature recognition can be done using unimodal and multi algorithmic based technique.
• The immediate transform have been used to generate feature vector which derived from CAL &
SAL functions and those functions are plotted on complex Walsh plane. mean values are evaluated
from each blocks through which first and last row/col separates Means and Density of the Cal and
Sal component.
• In unimodal concept the feature extracted and analysis will be done on this individuals features like
mean of last Col/Row, Density of Col/Row , DC components & Sequency values of last Col/Row
and these values are evaluated to form a feature vectors which are referred as Unimodal feature
vectors. Soft biometric features analysis done individually known as unimodal algorithm ,when
these features are combine together knows as multi algorithmic. Too improve the performance soft
biometric features are added.
• From 1080 samples genuine signatures are 2701 and 288901 for forgery signatures.
Online (Dynamic) Signature
• Online signature recognition limiting the use of a digitizing
tablet to the acquisition of the reference data.
• From the captured signature writing speed, strokes, pressure
points and acceleration can be extracted. Such features are
used for the verification secured system.
1..X, Y, Z Coordinates of the pen Tip.
2.Pressure – Pressure applied at the point
3.Tangent Pressure – tangent pressure of the tip.
4.Azimuth – Pen tip azimuth (corresponding to tip angle)
5.Altitude- Tip altitude corresponding to the different tip of pen.
6.Packet Serial- Packet serial number
7.Packet Timing – Timestamp
Fig. 2. Digitizer Tablet for On-line
Signature Scan (Wacom Intuos4)
Cont..
Fig. 3. Signature Feature Plot for Multidimensional features- X, Y, Z Co-ordinates, Pressure Azimuth &
Altitude parameter
Fig. 4. Signature Samples, first is Static Scanned Signature of a person and rest Dynamic Signature Scanned by
Wacom Intuos with Pressure Levels for the Dynamic Signatures Shown.
Signature Recognition
• Among all biometrics, Signature belongs to behavioral categories.
• Signature recognition mainly involves the following three tasks
1. Data Acquisition Stage
2. Feature Extraction Stage
3. Classification Stage
• While designing the pressure level of the signature need to be taken under consideration due to
different level of signature, it will not be processed further for the feature extraction stage.
Model Development
Fig. 5. Architecture of Proposed System.
Cont..
• User Enrolment: In this architecture of the proposed system Pre-Processing block is use to accept
the signature either from the database or from the digitizer. Form the 108 users 10 signature
samples are collected out of which 5 signatures are kept for training and rest for testing purpose.
• Data Acquisition: In this stage the signatures are captured using Digitizer Tablet Wacom Intuos 4.
The digitizer tablet is interfaced to the application using an ActiveX COM component VB Tablet.
The signature pre-processing is done by Modified Digital Difference Analyser Algorithm (MDDA)
which interpolate the dynamic signature point to reconstruct signature and counteracts the
sampling speed limitations.
• Feature Extraction: The signatures are processed using intermediate Walsh transform, to generate
a CAL-SAL based feature vectors. These feature vectors are stored on the file systems along with
captured signature data.
Cont..
• Classification: Classification will be done based on Accepted and Rejected. The extracted feature
vectors will be used for matching the signature in the database. The matching scores will be used
for classification of the signature using K Nearest Neighbour (KNN) classifier.
• The performance of the system is evaluated using TAR-TRR (True Acceptance Ratio-Truly
Rejection Ratio), FAR-FRR (False Acceptance Ratio-False Rejection Ratio) and SPI (Security
Performance Index) will be evaluated.
Feature Vector Generation
The feature vector represents the biometric
trait in a numerical form that can be matched
using a classifier. This is a crucial part of any
biometric system. Following are the steps of
feature vector extraction.
• Step1: Walsh Function
The Walsh functions are a set of orthogonal
functions which can be used to represent any
discrete-time signal.
Fig. 6. First Eight Walsh Functions
Cont..
• The Walsh functions (W0 - W7) are generated from square wave functions of different sequency
from which even functions (C0 - C3) are called Cal functions and the odd functions (S1-S4) are
called Sal functions.
• The basic square wave function S1, S2 and S4. C0 is DC component and the remaining functions
are generated from the basic square waves by EX-OR operation (equivalent to multiplication).
• Even Walsh functions named as Cal (k).
Cal (n, k) = W (n, 2k)
• Odd Walsh functions named as Sal (k),
Sal (n, k) = W (n, 2k+1)
• Then Walsh matrix is generated by sampling theses function at smaller interval time.
Cont..
• Step 2: Taking Intermediate of Walsh Transform
In the current approach, we are first generating the intermediate transform, i.e. the row transform (or
column transform) of a signature image as shown in Fig. 4, which have DC component as its first
row (or column) and higher sequency components (Sal and Cal) as the following rows (or columns).
Fig. 7. Transform of a 2D Function
Fig. 8. Row Transform and Column Transform of the input biometric trait
Cont..
• Step 3: Complex Walsh Plane & Feature Vector Generation
The spectral analysis using above mentioned intermediate transforms is performed on selected
signature data (Also called as Region of Interest ROI), currently the signature template is generated
and it has a size of 256*256 pixels. The Cal and the Sal components of the same sequency are
clustered together and are considered to be in the four quadrants of 2-D complex coordinate plane as
listed in below figure. This complex plane is now partitioned into different numbers of blocks.
Fig. 9. Complex Walsh Plane
• The values of Cal & Sal function they plotted in blocks which are square shaped. Feature vectors
generated using sectorization are much less in number and hence the reduction in processing time
and complexity. Currently there are 32*32 = 1024 blocks. For each block in the complex plane the
mean as well as Density of Cal & Sal function is calculated. Beside this DC value of First and Last
Col/Row and the sequency of last row of the intermediate transform is also calculated. Hence total
2S+3 feature points are calculated in all for Cal and Sal plots generated from complex Walsh plane.
Here S = 32, hence total 2051 elements are there in one feature vector. Besides this for actual
evaluation following combinations are tested
[1] Column Mean –CM
[2] Column Density – CD
[3] Row Mean – RM
[4] Row Density – RD
• The mean values of the transform coefficients in each block are calculated as in equation.
𝑀𝑘 =
1
𝑁 𝑁−1
𝑋=0
𝑊𝑖
• Similar way such concept can be implemented using Wavelet Transforms like Kekre Wavelets, Hybrid
wavelet I, Hybrid wavelet II. and other intermediate transforms like Kekre transform (KT), Discrete
cosine transform (DCT), Hartley Transform (HT).
Fig. 10. Partitioned Cal+jSal Function Plot of Row Transform & Column
Transform
Soft Biometrics Features
• The accuracy of the result will be boost up after adding soft biometric features with the generated
signature feature vectors.
• In this research we are generating the feature vector generation is done by getting the column and
row density as discussed before.
• We distinguish between local features, where one feature is extracted for each sample point in the
input domain.
• Global features, where one feature is extracted for a whole signature.
• In this approach global features has been generated from the signatures like Number of pixels,
Arch Length, Dominant Angle and Baseline shift length.
Conti..
• Number of pixels: Gives Total Number of black pixels in a signature template.
• Arch Length: Gives the arch length of signature from starting point to end point.
• Dominant Angle or Slope Angle: Dominant angle of the signature, angle formed by the centre of
masses with the baseline of the signature.
• Baseline shift: Baseline shift angle calculating by the centre of mass of left and right part of the
signature.
• Two signatures may have same dominant angle but at the same time they may have different
baseline shift. This helps for achieving classification accuracy.
Table1. Soft Biometric Features of Signature
Multi Algorithmic Signature Recognition
• The concept uses single algorithm no variants is called Unimodal whereas the results of the same
algorithm are combined together to generate more accurate result called as Multi Algorithmic.
• It proposes both the methods, for Unimodal directly the values are evaluated like Column & Row
Mean, Column & Row Density, Column & Row DC Components and Sequency results are
computed where in case of Multi Algorithmic the Column & Row Mean, Column & Row Density
and DC Components Sequency values of the Walsh Transform.
Result
• 1080 samples are collected from the 108 person (10 signatures of each person) has been used, from
which 1080 five signature used for training and five signatures for testing purpose of individuals.
• Total tests for genuine signatures are 2701 and 288901 for forgery signatures. While testing the
feature vector is generated in following variations:
[1] Column transform mean feature vector (Col TRF)
[2] Row transform mean feature vector (Row TRF)
[3] Column density feature vector (Col Density)
[4] Row density feature vector (Row Density)
[5] Fusion of all above Column & Row feature vector with DC & Sequency components
(Fusion)
[6] Fusion of all above feature vectors with SBF (Soft Biometrics Feature)
PERFORMANCE MATRIX
• To test the performance False Acceptance Rate –
False Rejection Rate Analysis (FAR-FRR) is
performed
• EER achieved is considered as one of the
performance index,
• Besides this Performance Index (PI) and
Security Performance Index (SPI) are used to
perform the performance of the feature vectors.
Walsh Transform Result
• Firstly Performance Index of the Column Mean, Row Mean, Column Density and Row Density
based feature vector generation.
0
10
20
30
40
50
60
70
80
90
100
1
3
5
7
9
11
13
15
17
19
21
23
25
27
29
31
33
35
37
39
41
43
45
47
49
51
53
55
57
59
61
63
65
67
69
71
73
75
77
79
81
83
85
87
89
91
93
95
97
99
Walsh Transform TAR TRR Plot for Unimodal FV - CM,CD, RM, RD
CM TAR CM TRR CD TAR CD TRR RM TAR RM TRR RD TAR RD TRR
Fig. 11. TAR-TRR Analysis for Walsh Cal-Sal based Unimodal Feature Vectors
• After generation of the unimodal feature vectors next multi algorithmic feature vectors are
generated with Soft Biometrics features, Fig. 12. shows the Performance Index of the multi
algorithmic feature vectors as Column Mean with Column Density and Row Mean with Row
Density along with Soft Biometrics features.
0
10
20
30
40
50
60
70
80
90
100
1 4 7 10 13 16 19 22 25 28 31 34 37 40 43 46 49 52 55 58 61 64 67 70 73 76 79 82 85 88 91 94 97 100
Walsh Transform with Multialgorithmic FV - CMCD, RMRD
CM CD TAR CM CD TRR RM RD TAR RM RD TRR
CM CD SBF TAR CM CD SBF TRR RM RD SBF TAR RM RD SBF TRR
Fig. 12. TAR-TRR Analysis for Walsh Cal-Sal of Multi Algorithmic and Soft Biometrics based Feature Vectors
• Fusion with the DC components. In the fusion technique the Multi Algorithmic and Soft
Biometrics features are combined with the DC components to evaluate the performance. After
evaluate the results of this Fusion technique the conclusion derived as fusion technique gives the
better performance as compared to the rest.
0
20
40
60
80
100
120
1 4 7 10 13 16 19 22 25 28 31 34 37 40 43 46 49 52 55 58 61 64 67 70 73 76 79 82 85 88 91 94 97 100
Walsh Transform with Fusion FV - CMCDDC, RMRDDC
CM CD DC TAR CM CD DC TRR RM RD DC TAR RM RD DC TRR
CM CD DC SBF TAR CM CD DC SBF TRR RM RD DC SBF TAR RM RD DC SBF TRR
Fig. 13. TAR-TRR Analysis for Walsh Cal-Sal Fusion of Multi Algorithmic and Soft Biometric based Feature Vectors
Table2. Walsh Transform Performance Analysis
Table 3. Performance Analysis of Transforms with Original Feature vector and Fused with Soft Biometrics Features
Table 4. Performance Analysis of Transforms with Original Feature vector and Fused with Soft
Biometrics Features
Conclusion
1. Due to addition of Soft Biometrics features general trend is that the PI and SPI is boosted.
Performance boost in PI is 43.64% is observed for Kekre Transform Column Mean. In case of
SPI it is observed up to 133% for Walsh Column Density. However few feature vector have
shown the drop in performance.
2. For Multi Algorithmic implementation simple method of weighted score fusion is applied. This
method gives increase in PI. Some exceptions are Kekre Transform and Kekre Wavelet
Transform.
3. The best performance is given by Kekre Transform Column Density based feature Vectors which
gives 98.68% PI. This is followed by Kekre Transform Row Mean 97.36% and Kekre
Transform Row Density 96.05%
4. In Wavelet category the best performance is given by Kekre Wavelet Transform, Kekre Wavelet
Transform Row Mean 85.37% and Kekre Wavelet Transform Column Mean Column Density
85.54% with Soft Biometrics feature.
5. As compared to existing technique table 5.10 the performance of Kekre Transform based feature
vector Kekre Transform Column Density is 98.68%.
Scope for future work
• Better design of classifier currently classification is done by simple KNN classifier
• Hybrid Wavelets are implemented using combination of Walsh and Kekre Transform so other
transforms can be used to generate the different variants of Hybrid Wavelet and their performance
is tested.
Thank you…

Online signature recognition using sectorization of complex walsh

  • 1.
    Online Signature RecognitionUsing Sectorization of Complex Walsh Plane By Shah Avani Guided By Dr. Vinayak A. Bharadi
  • 2.
    Abstract • Online signatureis one of the biometric trait which is used for verification and identification. • The online reference signature acquired through a digitizing tablet with their Dynamic characteristics along with it Modified Digital Difference Analyzer Algorithm (MDDA) has been proposed to interpolate the dynamic signature point to reconstruct signature with maximum possible points. • For extracting the features of the signature intermediate transforms of Column and Row will be evaluated. Sectorization of complex Walsh plane concept is used, on which the Cal and Sal function are plotted for intermediate transform. • Plotted in blocks which are square shaped and the mean values of the transform coefficients in each block are calculated. Along with DC component and Sequency components of first and last row/col separates means and density of the Cal (Cosine Walsh) and Sal (Sine Walsh) component lastly they combine together to form the feature vector referred as Unimodal feature or as Multi Algorithmic features.
  • 3.
    Introduction • Biometrics comprisesmethods for uniquely recognizing humans based upon one or more intrinsic physical or behavioral traits. • Physiological are related to the shape of the body. • Behavioral are related to the behaviour of a person. Examples like Gait, Voice, Signature and Key Stroke.
  • 4.
    Physiological & BehavioralBiometric Traits Fig. 1. Different types of Biometric Modalities
  • 5.
    Problem Statement • Onlinesignature recognition can be done using unimodal and multi algorithmic based technique. • The immediate transform have been used to generate feature vector which derived from CAL & SAL functions and those functions are plotted on complex Walsh plane. mean values are evaluated from each blocks through which first and last row/col separates Means and Density of the Cal and Sal component. • In unimodal concept the feature extracted and analysis will be done on this individuals features like mean of last Col/Row, Density of Col/Row , DC components & Sequency values of last Col/Row and these values are evaluated to form a feature vectors which are referred as Unimodal feature vectors. Soft biometric features analysis done individually known as unimodal algorithm ,when these features are combine together knows as multi algorithmic. Too improve the performance soft biometric features are added. • From 1080 samples genuine signatures are 2701 and 288901 for forgery signatures.
  • 6.
    Online (Dynamic) Signature •Online signature recognition limiting the use of a digitizing tablet to the acquisition of the reference data. • From the captured signature writing speed, strokes, pressure points and acceleration can be extracted. Such features are used for the verification secured system. 1..X, Y, Z Coordinates of the pen Tip. 2.Pressure – Pressure applied at the point 3.Tangent Pressure – tangent pressure of the tip. 4.Azimuth – Pen tip azimuth (corresponding to tip angle) 5.Altitude- Tip altitude corresponding to the different tip of pen. 6.Packet Serial- Packet serial number 7.Packet Timing – Timestamp Fig. 2. Digitizer Tablet for On-line Signature Scan (Wacom Intuos4)
  • 7.
    Cont.. Fig. 3. SignatureFeature Plot for Multidimensional features- X, Y, Z Co-ordinates, Pressure Azimuth & Altitude parameter Fig. 4. Signature Samples, first is Static Scanned Signature of a person and rest Dynamic Signature Scanned by Wacom Intuos with Pressure Levels for the Dynamic Signatures Shown.
  • 8.
    Signature Recognition • Amongall biometrics, Signature belongs to behavioral categories. • Signature recognition mainly involves the following three tasks 1. Data Acquisition Stage 2. Feature Extraction Stage 3. Classification Stage • While designing the pressure level of the signature need to be taken under consideration due to different level of signature, it will not be processed further for the feature extraction stage.
  • 9.
    Model Development Fig. 5.Architecture of Proposed System.
  • 10.
    Cont.. • User Enrolment:In this architecture of the proposed system Pre-Processing block is use to accept the signature either from the database or from the digitizer. Form the 108 users 10 signature samples are collected out of which 5 signatures are kept for training and rest for testing purpose. • Data Acquisition: In this stage the signatures are captured using Digitizer Tablet Wacom Intuos 4. The digitizer tablet is interfaced to the application using an ActiveX COM component VB Tablet. The signature pre-processing is done by Modified Digital Difference Analyser Algorithm (MDDA) which interpolate the dynamic signature point to reconstruct signature and counteracts the sampling speed limitations. • Feature Extraction: The signatures are processed using intermediate Walsh transform, to generate a CAL-SAL based feature vectors. These feature vectors are stored on the file systems along with captured signature data.
  • 11.
    Cont.. • Classification: Classificationwill be done based on Accepted and Rejected. The extracted feature vectors will be used for matching the signature in the database. The matching scores will be used for classification of the signature using K Nearest Neighbour (KNN) classifier. • The performance of the system is evaluated using TAR-TRR (True Acceptance Ratio-Truly Rejection Ratio), FAR-FRR (False Acceptance Ratio-False Rejection Ratio) and SPI (Security Performance Index) will be evaluated.
  • 12.
    Feature Vector Generation Thefeature vector represents the biometric trait in a numerical form that can be matched using a classifier. This is a crucial part of any biometric system. Following are the steps of feature vector extraction. • Step1: Walsh Function The Walsh functions are a set of orthogonal functions which can be used to represent any discrete-time signal. Fig. 6. First Eight Walsh Functions
  • 13.
    Cont.. • The Walshfunctions (W0 - W7) are generated from square wave functions of different sequency from which even functions (C0 - C3) are called Cal functions and the odd functions (S1-S4) are called Sal functions. • The basic square wave function S1, S2 and S4. C0 is DC component and the remaining functions are generated from the basic square waves by EX-OR operation (equivalent to multiplication). • Even Walsh functions named as Cal (k). Cal (n, k) = W (n, 2k) • Odd Walsh functions named as Sal (k), Sal (n, k) = W (n, 2k+1) • Then Walsh matrix is generated by sampling theses function at smaller interval time.
  • 14.
    Cont.. • Step 2:Taking Intermediate of Walsh Transform In the current approach, we are first generating the intermediate transform, i.e. the row transform (or column transform) of a signature image as shown in Fig. 4, which have DC component as its first row (or column) and higher sequency components (Sal and Cal) as the following rows (or columns). Fig. 7. Transform of a 2D Function
  • 15.
    Fig. 8. RowTransform and Column Transform of the input biometric trait
  • 16.
    Cont.. • Step 3:Complex Walsh Plane & Feature Vector Generation The spectral analysis using above mentioned intermediate transforms is performed on selected signature data (Also called as Region of Interest ROI), currently the signature template is generated and it has a size of 256*256 pixels. The Cal and the Sal components of the same sequency are clustered together and are considered to be in the four quadrants of 2-D complex coordinate plane as listed in below figure. This complex plane is now partitioned into different numbers of blocks. Fig. 9. Complex Walsh Plane
  • 17.
    • The valuesof Cal & Sal function they plotted in blocks which are square shaped. Feature vectors generated using sectorization are much less in number and hence the reduction in processing time and complexity. Currently there are 32*32 = 1024 blocks. For each block in the complex plane the mean as well as Density of Cal & Sal function is calculated. Beside this DC value of First and Last Col/Row and the sequency of last row of the intermediate transform is also calculated. Hence total 2S+3 feature points are calculated in all for Cal and Sal plots generated from complex Walsh plane. Here S = 32, hence total 2051 elements are there in one feature vector. Besides this for actual evaluation following combinations are tested [1] Column Mean –CM [2] Column Density – CD [3] Row Mean – RM [4] Row Density – RD • The mean values of the transform coefficients in each block are calculated as in equation. 𝑀𝑘 = 1 𝑁 𝑁−1 𝑋=0 𝑊𝑖
  • 18.
    • Similar waysuch concept can be implemented using Wavelet Transforms like Kekre Wavelets, Hybrid wavelet I, Hybrid wavelet II. and other intermediate transforms like Kekre transform (KT), Discrete cosine transform (DCT), Hartley Transform (HT). Fig. 10. Partitioned Cal+jSal Function Plot of Row Transform & Column Transform
  • 19.
    Soft Biometrics Features •The accuracy of the result will be boost up after adding soft biometric features with the generated signature feature vectors. • In this research we are generating the feature vector generation is done by getting the column and row density as discussed before. • We distinguish between local features, where one feature is extracted for each sample point in the input domain. • Global features, where one feature is extracted for a whole signature. • In this approach global features has been generated from the signatures like Number of pixels, Arch Length, Dominant Angle and Baseline shift length.
  • 20.
    Conti.. • Number ofpixels: Gives Total Number of black pixels in a signature template. • Arch Length: Gives the arch length of signature from starting point to end point. • Dominant Angle or Slope Angle: Dominant angle of the signature, angle formed by the centre of masses with the baseline of the signature. • Baseline shift: Baseline shift angle calculating by the centre of mass of left and right part of the signature. • Two signatures may have same dominant angle but at the same time they may have different baseline shift. This helps for achieving classification accuracy.
  • 21.
    Table1. Soft BiometricFeatures of Signature
  • 22.
    Multi Algorithmic SignatureRecognition • The concept uses single algorithm no variants is called Unimodal whereas the results of the same algorithm are combined together to generate more accurate result called as Multi Algorithmic. • It proposes both the methods, for Unimodal directly the values are evaluated like Column & Row Mean, Column & Row Density, Column & Row DC Components and Sequency results are computed where in case of Multi Algorithmic the Column & Row Mean, Column & Row Density and DC Components Sequency values of the Walsh Transform.
  • 23.
    Result • 1080 samplesare collected from the 108 person (10 signatures of each person) has been used, from which 1080 five signature used for training and five signatures for testing purpose of individuals. • Total tests for genuine signatures are 2701 and 288901 for forgery signatures. While testing the feature vector is generated in following variations: [1] Column transform mean feature vector (Col TRF) [2] Row transform mean feature vector (Row TRF) [3] Column density feature vector (Col Density) [4] Row density feature vector (Row Density) [5] Fusion of all above Column & Row feature vector with DC & Sequency components (Fusion) [6] Fusion of all above feature vectors with SBF (Soft Biometrics Feature)
  • 24.
    PERFORMANCE MATRIX • Totest the performance False Acceptance Rate – False Rejection Rate Analysis (FAR-FRR) is performed • EER achieved is considered as one of the performance index, • Besides this Performance Index (PI) and Security Performance Index (SPI) are used to perform the performance of the feature vectors.
  • 25.
    Walsh Transform Result •Firstly Performance Index of the Column Mean, Row Mean, Column Density and Row Density based feature vector generation. 0 10 20 30 40 50 60 70 80 90 100 1 3 5 7 9 11 13 15 17 19 21 23 25 27 29 31 33 35 37 39 41 43 45 47 49 51 53 55 57 59 61 63 65 67 69 71 73 75 77 79 81 83 85 87 89 91 93 95 97 99 Walsh Transform TAR TRR Plot for Unimodal FV - CM,CD, RM, RD CM TAR CM TRR CD TAR CD TRR RM TAR RM TRR RD TAR RD TRR CM TAR CM TRR CD TAR CD TRR RM TAR RM TRR RD TAR RD TRR Fig. 11. TAR-TRR Analysis for Walsh Cal-Sal based Unimodal Feature Vectors
  • 26.
    • After generationof the unimodal feature vectors next multi algorithmic feature vectors are generated with Soft Biometrics features, Fig. 12. shows the Performance Index of the multi algorithmic feature vectors as Column Mean with Column Density and Row Mean with Row Density along with Soft Biometrics features. 0 10 20 30 40 50 60 70 80 90 100 1 4 7 10 13 16 19 22 25 28 31 34 37 40 43 46 49 52 55 58 61 64 67 70 73 76 79 82 85 88 91 94 97 100 Walsh Transform with Multialgorithmic FV - CMCD, RMRD CM CD TAR CM CD TRR RM RD TAR RM RD TRR CM CD SBF TAR CM CD SBF TRR RM RD SBF TAR RM RD SBF TRR Fig. 12. TAR-TRR Analysis for Walsh Cal-Sal of Multi Algorithmic and Soft Biometrics based Feature Vectors
  • 27.
    • Fusion withthe DC components. In the fusion technique the Multi Algorithmic and Soft Biometrics features are combined with the DC components to evaluate the performance. After evaluate the results of this Fusion technique the conclusion derived as fusion technique gives the better performance as compared to the rest. 0 20 40 60 80 100 120 1 4 7 10 13 16 19 22 25 28 31 34 37 40 43 46 49 52 55 58 61 64 67 70 73 76 79 82 85 88 91 94 97 100 Walsh Transform with Fusion FV - CMCDDC, RMRDDC CM CD DC TAR CM CD DC TRR RM RD DC TAR RM RD DC TRR CM CD DC SBF TAR CM CD DC SBF TRR RM RD DC SBF TAR RM RD DC SBF TRR Fig. 13. TAR-TRR Analysis for Walsh Cal-Sal Fusion of Multi Algorithmic and Soft Biometric based Feature Vectors
  • 28.
    Table2. Walsh TransformPerformance Analysis
  • 29.
    Table 3. PerformanceAnalysis of Transforms with Original Feature vector and Fused with Soft Biometrics Features
  • 30.
    Table 4. PerformanceAnalysis of Transforms with Original Feature vector and Fused with Soft Biometrics Features
  • 31.
    Conclusion 1. Due toaddition of Soft Biometrics features general trend is that the PI and SPI is boosted. Performance boost in PI is 43.64% is observed for Kekre Transform Column Mean. In case of SPI it is observed up to 133% for Walsh Column Density. However few feature vector have shown the drop in performance. 2. For Multi Algorithmic implementation simple method of weighted score fusion is applied. This method gives increase in PI. Some exceptions are Kekre Transform and Kekre Wavelet Transform. 3. The best performance is given by Kekre Transform Column Density based feature Vectors which gives 98.68% PI. This is followed by Kekre Transform Row Mean 97.36% and Kekre Transform Row Density 96.05% 4. In Wavelet category the best performance is given by Kekre Wavelet Transform, Kekre Wavelet Transform Row Mean 85.37% and Kekre Wavelet Transform Column Mean Column Density 85.54% with Soft Biometrics feature. 5. As compared to existing technique table 5.10 the performance of Kekre Transform based feature vector Kekre Transform Column Density is 98.68%.
  • 32.
    Scope for futurework • Better design of classifier currently classification is done by simple KNN classifier • Hybrid Wavelets are implemented using combination of Walsh and Kekre Transform so other transforms can be used to generate the different variants of Hybrid Wavelet and their performance is tested.
  • 33.