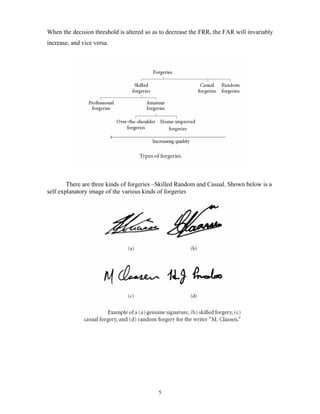
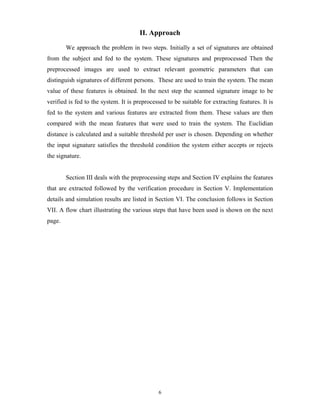
Handwritten Signature
Verification
ECE 533 – Project Report
by
Ashish Dhawan
Aditi R. Ganesan
2
Contents
1. Abstract 3.
2. Introduction 4.
3. Approach 6.
4. Pre-processing 8.
5. Feature Extraction 9.
6. Verification 11.
7. Implementation and Simulation Results 12.
8. Conclusion 15.
9. References 16.
10. Percentage Contributions. 17
3
Abstract
The fact that the signature is widely used as a means of personal verification
emphasizes the need for an automatic verification system. Verification can be performed
either Offline or Online based on the application. Online systems use dynamic
information of a signature captured at the time the signature is made. Offline systems
work on the scanned image of a signature. We have worked on the Offline Verification of
signatures using a set of shape based geometric features. The features that are used are
Baseline Slant Angle, Aspect Ratio, Normalized Area, Center of Gravity, number of edge
points, number of cross points, and the Slope of the line joining the Centers of Gravity of
two halves of a signature image. Before extracting the features, preprocessing of a
scanned image is necessary to isolate the signature part and to remove any spurious noise
present. The system is initially trained using a database of signatures obtained from those
individuals whose signatures have to be authenticated by the system. For each subject a
mean signature is obtained integrating the above features derived from a set of his/her
genuine sample signatures. This mean signature acts as the template for verification
against a claimed test signature. Euclidian distance in the feature space between the
claimed signature and the template serves as a measure of similarity between the two. If
this distance is less than a pre-defined threshold (corresponding to minimum acceptable
degree of similarity), the test signature is verified to be that of the claimed subject else
detected as a forgery. The details of preprocessing as well as the features depicted above
are described in the report along with the implementation details and simulation results.
4
I. Introduction
Signature has been a distinguishing feature for person identification through ages.
Signatures for long have been used for automatic clearing of cheques in the banking
industry. Despite an increasing number of electronic alternatives to paper cheques, fraud
perpetrated at financial institutions in the United States has become a national epidemic.
Since commercial banks pay little attention to verifying signatures on cheques—mainly
due to the number of cheques that are processed daily—a system capable of screening
casual forgeries will prove beneficial. Most forged cheques contain forgeries of this type.
We in our project have tried developing a robust system that automatically authenticates
documents based on the owner’s handwritten signature.
Approaches to signature verification fall into two categories according to the
acquisition of the data: On-line and Off-line. On-line data records the motion of the stylus
while the signature is produced, and includes location, and possibly velocity, acceleration
and pen pressure, as functions of time. Online systems use this information captured
during acquisition. These dynamic characteristics are specific to each individual and
sufficiently stable as well as repetitive. Off-line data is a 2-D image of the signature.
Processing Off-line is complex due to the absence of stable dynamic characteristics.
Difficulty also lies in the fact that it is hard to segment signature strokes due to highly
stylish and unconventional writing styles. The non-repetitive nature of variation of the
signatures, because of age, illness, geographic location and perhaps to some extent the
emotional state of the person, accentuates the problem. All these coupled together cause
large intra-personal variation. A robust system has to be designed which should not only
be able to consider these factors but also detect various types of forgeries. The system
should neither be too sensitive nor too coarse. It should have an acceptable trade-off
between a low False Acceptance Rate (FAR) and a low False Rejection Rate (FRR).
The false rejection rate (FRR) and the false acceptance rate (FAR) are used as
quality performance measures. The FRR is the ratio of the number of genuine test
signatures rejected to the total number of genuine test signatures submitted. The FAR is
the ratio of the number of forgeries accepted to the total number of forgeries submitted.
5
When the decision threshold is altered so as to decrease the FRR, the FAR will invariably
increase, and vice versa.
There are three kinds of forgeries –Skilled Random and Casual. Shown below is a
self explanatory image of the various kinds of forgeries
6
II. Approach
We approach the problem in two steps. Initially a set of signatures are obtained
from the subject and fed to the system. These signatures and preprocessed Then the
preprocessed images are used to extract relevant geometric parameters that can
distinguish signatures of different persons. These are used to train the system. The mean
value of these features is obtained. In the next step the scanned signature image to be
verified is fed to the system. It is preprocessed to be suitable for extracting features. It is
fed to the system and various features are extracted from them. These values are then
compared with the mean features that were used to train the system. The Euclidian
distance is calculated and a suitable threshold per user is chosen. Depending on whether
the input signature satisfies the threshold condition the system either accepts or rejects
the signature.
Section III deals with the preprocessing steps and Section IV explains the features
that are extracted followed by the verification procedure in Section V. Implementation
details and simulation results are listed in Section VI. The conclusion follows in Section
VII. A flow chart illustrating the various steps that have been used is shown on the next
page.
7
Fig: Flow Chart of the Approach.
8
III. Pre-processing
The scanned signature image may contain spurious noise and has to be removed
to avoid errors in the further processing steps. The gray image Io of size M*N is inverted
to obtain an image Ii in which the signature part consisting of higher gray levels forms the
foreground.
Ii(i,j) = Io,max - Io(i,j) …………………..(1)
Where Io,max is the maximum gray-level. The background, which should be ideally
dark, may consist of pixels or group of pixels with gray values between that of
background and foreground. These are removed by performing a row averaging process
to generate the row averaged image Ira, which is given by,
Ir(i,j) = Ii(i,j) - l=1∑M
Ii(l,j)/M
Ira(i,j) = Ir(i,j) if Ir(i,j) > 0
= 0 otherwise ……………………(2)
Further noise removal and smoothening is achieved using an n*n averaging filter
to generate the cleaned image Ia.
Ia(i,j) = 1/9 ( l=i-1∑i+1
k=j-1∑j+1
Ira(l,k) ) …………………..(3)
The gray image is converted into binary image by using automatic global
thresholding. Following algorithm [5] was used to automatically calculate the global
threshold:
1. An initial value, midway between the maximum and minimum gray level value, was
selected for the threshold T.
2. Image was segmented using T.
3. Average gray level values μ1 and μ2 for the two groups of pixels was computed.
4. Based on step 3, new threshold value was computed.
T = 0.5 * (μ1 + μ2). …………………..(4)
5. Steps 2 through 4 were repeated until the difference in T in successive iterations was
smaller than 0.5.
9
IV. Feature Extraction
We used a set of seven features to uniquely characterize a candidate signature.
These features are geometrical features based on the shape and dimensions of a signature
image. The various shape features that we used are:
1. Baseline Slant Angle
Baseline is the imaginary line about which the signature is assumed to rest. The
angle of inclination of this line to the horizontal is called the Slant Angle Θ. To determine
the slant angle the ratio of the maximum horizontal projection to the width of the
projection is maximized over a range of values of angle of rotation θ.
PH(i) = j=0ΣN-1
IT(i,j)
ρ(θ) = H(θ)/W(θ) -θ1<θ<θ2
H(θ) = Max PH(i)
W(θ) = number of non-zero elements in PH(i) …………..(5)
Θ is the value of θ at which ρ(θ) attains maximum. The ratio ρ(θ) is smaller at
every angle other than the baseline slant angle. The thresholded image IT is rotated by
this angle to obtain the slant normalized signature image IR.
2. Aspect Ratio
The aspect ratio (A) is the ratio of width to height of the signature. The bounding
box coordinates of the signature are determined and the width (Dx) and height (Dy) are
computed using these coordinates.
A = Dx/Dy …………………..(6)
3. Normalized area of the signature
Normalized area (NA) is the ratio of the area occupied by signature pixels to the
area of the bounding box.
NA = Δ/(DxDy) …………………(7)
where Δ is the area of signature pixels.
10
4. Center of Gravity
The Center of Gravity is the 2-tuple (X,Y) given by,
X = j=0∑N-1
PV(j)*j/Δ
Y = i=0∑M-1
PH(i)*i/Δ ……………………..(8)
Where PV and PH are the vertical and horizontal projections
respectively.
5. Slope of the line joining the Centers of Gravity of the two halves of signature image
We divide the signature image within its bounding box into left and right halves
and separately determine the centers of gravity of the two halves. We have seen that the
slope of the line joining the two centers can serve as an attractive feature to distinguish
signatures.
6. Number of Edge Points
The edge point is a point that has only one 8-neighbor. In order to extract the edge
points in a given signature, we used a 3 3× structuring element with all coefficients equal
to 1.
7. Number of Cross Points
Cross point is a point that has at least three 8-neighbors. The structuring element
that was used to extract edge points, was also used to extract the cross points in a
signature. Number of cross points is a nice feature to distinguish signatures.
11
V. Verification
The above described features are extracted from a sample group of signature
images of different persons. The values derived from each sample group are used in
deriving a mean signature for each subject. The mean values and standard deviations of
all the features are computed and used for final verification. A user defined threshold
corresponding to the minimum acceptable degree of similarity for each person was
manually estimated. Since users do not like their original signatures to get rejected, we
chose the threshold on the lower side to avoid rejection of original signatures.
Let μi and σi denote the mean and standard deviation for the ith
feature and Fi
denote its value for the query image. The Euclidian distance δ in the feature space
measures the proximity of a query signature image to the mean signature image of the
claimed person.
δ = (1/n) i=1∑n
[(Fi - μi)/σi]2
………………(9)
If this distance is below a certain threshold then the query signature is verified to
be that of the claimed person otherwise it is detected as a forged one.
12
VI. Implementation Details and Simulation Results
A database of about 450 signatures was built by collecting signatures from about
30 different persons.10 signatures per person was used for training. In addition to these 3
good signature samples were collected from each person for signature verification
purposes. Two signatures per person was also collected to identify forgeries. The
signatures were scanned with a precision of 1000X500 pixels.
The results of the algorithm for two specimens collected are shown.
Sample 1
Original Signature Thresholded Image
Bounding Box Rotated Image
Left Bounding Box Right Bounding Box
13
Sample 2
Original Signature Thresholded Image
Bounding Box Rotated Image
Left Bounding Box Right Bounding Box
Skilled Forgery
14
Mean Values of Features Sample 1 Sample2
Image Threshold 84 93.5
Slant Angle (SA) 15 20
Aspect Ratio (AR) 1.6500 2.8409
Normalized Area (NA) .0803 .0608
Center Of Gravity (COG) (482.2187,212.68) (512.4289, 318.7370)
COG - Left half (191.95,113.98) (260.4076, 189.4470)
COG -Right half (158.605,206.75) (184.571, 133.5464)
Slope -2.8715 0.7371
Number of Edge Points 10 28
Number of Cross Points 6 11
Table: Values of the various features Extracted for the two samples.
The results of our simulation for forged and genuine signatures are as shown in
the table below.
The system is robust; it rejected all the casual forgeries. Out of the 76 genuine
signatures that were fed in, 4 were rejected as forgeries. This yielded a False Rejection
Rate (FRR) of 5.26%. Also out of 50 skilled forgeries fed into the system, 5 signatures
were accepted. This gave us a False Acceptance Rate (FAR) of 10%.
Nature of Signature Samples False Acceptance Rate False Rejection Rate
Original 76 ----- 5.26%
Casual Forgery 75 0% -----
Skilled Forgery 50 10% -----
15
VII. Conclusions and Scope for Future Work
The algorithm developed by us, uses various geometric features to characterize
signatures that effectively serve to distinguish signatures of different persons. The system
is robust and can detect random, simple and semi-skilled forgeries but the performance
deteriorates in case of skilled forgeries.
Using a higher dimensional feature space and also incorporating dynamic
information gathered during the time of signature can also improve the performance. The
concepts of Neural Networks as well as Wavelet transforms hold a lot of promise in
building systems with high accuracy.
16
References
[1]. N. Papamarkos, H. Baltzakis. Off-line signature verification using multiple neural
network classification structures.
[2] R. Plamondon, G. Lorette, “Automatic Signature Verification and Writer
Identification The State of the Art, Pattern Recognition” 22 (2) (1989) 107-131.
[3] Gonzalez R.C., Woods E., 'Digital Image Processing', Addison-Wesley,
[4] G. Dimauro, S. Impedovo, M.G.Lucchese, R.Modugno and G. Pirlo “Recent
Advancements in Automatic Signature Verification”, Proceedings of the 9th Int’l
Workshop on Frontiers in Handwriting Recognition
[5] H. Baltzakis, N. Papamarkos, “A new signature verification technique based on a
two-stage neural network classifier”, Engineering Application of AI, Vol. 14 , 2001, pp.
95-103.
[6] R. Sabourin, R. Plamondon, L. Beaumier, "Structural interpretation of handwritten
signature images", IJPRAI, Vol. 8, 3, 1994, pp.709-748.
17
Percentage Contributions
Tasks performed Ashish Dhawan Aditi R. Ganesan
Literature search 50% 50%
Algorithm derivation 50% 50%
Matlab programs 50% 50%
Database Collection 50% 50%
Testing Signatures 50% 50%
Report writing 50% 50%
Power point presentation 50% 50%
Overall 50% 50%
Team Member #1: Ashish Dhawan _________________________________
Signature
Team Member #2: Aditi R. Ganesan _________________________________
Signature

Ganesan dhawanrpt

  • 1.
    Handwritten Signature Verification ECE 533– Project Report by Ashish Dhawan Aditi R. Ganesan
  • 2.
    2 Contents 1. Abstract 3. 2.Introduction 4. 3. Approach 6. 4. Pre-processing 8. 5. Feature Extraction 9. 6. Verification 11. 7. Implementation and Simulation Results 12. 8. Conclusion 15. 9. References 16. 10. Percentage Contributions. 17
  • 3.
    3 Abstract The fact thatthe signature is widely used as a means of personal verification emphasizes the need for an automatic verification system. Verification can be performed either Offline or Online based on the application. Online systems use dynamic information of a signature captured at the time the signature is made. Offline systems work on the scanned image of a signature. We have worked on the Offline Verification of signatures using a set of shape based geometric features. The features that are used are Baseline Slant Angle, Aspect Ratio, Normalized Area, Center of Gravity, number of edge points, number of cross points, and the Slope of the line joining the Centers of Gravity of two halves of a signature image. Before extracting the features, preprocessing of a scanned image is necessary to isolate the signature part and to remove any spurious noise present. The system is initially trained using a database of signatures obtained from those individuals whose signatures have to be authenticated by the system. For each subject a mean signature is obtained integrating the above features derived from a set of his/her genuine sample signatures. This mean signature acts as the template for verification against a claimed test signature. Euclidian distance in the feature space between the claimed signature and the template serves as a measure of similarity between the two. If this distance is less than a pre-defined threshold (corresponding to minimum acceptable degree of similarity), the test signature is verified to be that of the claimed subject else detected as a forgery. The details of preprocessing as well as the features depicted above are described in the report along with the implementation details and simulation results.
  • 4.
    4 I. Introduction Signature hasbeen a distinguishing feature for person identification through ages. Signatures for long have been used for automatic clearing of cheques in the banking industry. Despite an increasing number of electronic alternatives to paper cheques, fraud perpetrated at financial institutions in the United States has become a national epidemic. Since commercial banks pay little attention to verifying signatures on cheques—mainly due to the number of cheques that are processed daily—a system capable of screening casual forgeries will prove beneficial. Most forged cheques contain forgeries of this type. We in our project have tried developing a robust system that automatically authenticates documents based on the owner’s handwritten signature. Approaches to signature verification fall into two categories according to the acquisition of the data: On-line and Off-line. On-line data records the motion of the stylus while the signature is produced, and includes location, and possibly velocity, acceleration and pen pressure, as functions of time. Online systems use this information captured during acquisition. These dynamic characteristics are specific to each individual and sufficiently stable as well as repetitive. Off-line data is a 2-D image of the signature. Processing Off-line is complex due to the absence of stable dynamic characteristics. Difficulty also lies in the fact that it is hard to segment signature strokes due to highly stylish and unconventional writing styles. The non-repetitive nature of variation of the signatures, because of age, illness, geographic location and perhaps to some extent the emotional state of the person, accentuates the problem. All these coupled together cause large intra-personal variation. A robust system has to be designed which should not only be able to consider these factors but also detect various types of forgeries. The system should neither be too sensitive nor too coarse. It should have an acceptable trade-off between a low False Acceptance Rate (FAR) and a low False Rejection Rate (FRR). The false rejection rate (FRR) and the false acceptance rate (FAR) are used as quality performance measures. The FRR is the ratio of the number of genuine test signatures rejected to the total number of genuine test signatures submitted. The FAR is the ratio of the number of forgeries accepted to the total number of forgeries submitted.
  • 5.
    5 When the decisionthreshold is altered so as to decrease the FRR, the FAR will invariably increase, and vice versa. There are three kinds of forgeries –Skilled Random and Casual. Shown below is a self explanatory image of the various kinds of forgeries
  • 6.
    6 II. Approach We approachthe problem in two steps. Initially a set of signatures are obtained from the subject and fed to the system. These signatures and preprocessed Then the preprocessed images are used to extract relevant geometric parameters that can distinguish signatures of different persons. These are used to train the system. The mean value of these features is obtained. In the next step the scanned signature image to be verified is fed to the system. It is preprocessed to be suitable for extracting features. It is fed to the system and various features are extracted from them. These values are then compared with the mean features that were used to train the system. The Euclidian distance is calculated and a suitable threshold per user is chosen. Depending on whether the input signature satisfies the threshold condition the system either accepts or rejects the signature. Section III deals with the preprocessing steps and Section IV explains the features that are extracted followed by the verification procedure in Section V. Implementation details and simulation results are listed in Section VI. The conclusion follows in Section VII. A flow chart illustrating the various steps that have been used is shown on the next page.
  • 7.
    7 Fig: Flow Chartof the Approach.
  • 8.
    8 III. Pre-processing The scannedsignature image may contain spurious noise and has to be removed to avoid errors in the further processing steps. The gray image Io of size M*N is inverted to obtain an image Ii in which the signature part consisting of higher gray levels forms the foreground. Ii(i,j) = Io,max - Io(i,j) …………………..(1) Where Io,max is the maximum gray-level. The background, which should be ideally dark, may consist of pixels or group of pixels with gray values between that of background and foreground. These are removed by performing a row averaging process to generate the row averaged image Ira, which is given by, Ir(i,j) = Ii(i,j) - l=1∑M Ii(l,j)/M Ira(i,j) = Ir(i,j) if Ir(i,j) > 0 = 0 otherwise ……………………(2) Further noise removal and smoothening is achieved using an n*n averaging filter to generate the cleaned image Ia. Ia(i,j) = 1/9 ( l=i-1∑i+1 k=j-1∑j+1 Ira(l,k) ) …………………..(3) The gray image is converted into binary image by using automatic global thresholding. Following algorithm [5] was used to automatically calculate the global threshold: 1. An initial value, midway between the maximum and minimum gray level value, was selected for the threshold T. 2. Image was segmented using T. 3. Average gray level values μ1 and μ2 for the two groups of pixels was computed. 4. Based on step 3, new threshold value was computed. T = 0.5 * (μ1 + μ2). …………………..(4) 5. Steps 2 through 4 were repeated until the difference in T in successive iterations was smaller than 0.5.
  • 9.
    9 IV. Feature Extraction Weused a set of seven features to uniquely characterize a candidate signature. These features are geometrical features based on the shape and dimensions of a signature image. The various shape features that we used are: 1. Baseline Slant Angle Baseline is the imaginary line about which the signature is assumed to rest. The angle of inclination of this line to the horizontal is called the Slant Angle Θ. To determine the slant angle the ratio of the maximum horizontal projection to the width of the projection is maximized over a range of values of angle of rotation θ. PH(i) = j=0ΣN-1 IT(i,j) ρ(θ) = H(θ)/W(θ) -θ1<θ<θ2 H(θ) = Max PH(i) W(θ) = number of non-zero elements in PH(i) …………..(5) Θ is the value of θ at which ρ(θ) attains maximum. The ratio ρ(θ) is smaller at every angle other than the baseline slant angle. The thresholded image IT is rotated by this angle to obtain the slant normalized signature image IR. 2. Aspect Ratio The aspect ratio (A) is the ratio of width to height of the signature. The bounding box coordinates of the signature are determined and the width (Dx) and height (Dy) are computed using these coordinates. A = Dx/Dy …………………..(6) 3. Normalized area of the signature Normalized area (NA) is the ratio of the area occupied by signature pixels to the area of the bounding box. NA = Δ/(DxDy) …………………(7) where Δ is the area of signature pixels.
  • 10.
    10 4. Center ofGravity The Center of Gravity is the 2-tuple (X,Y) given by, X = j=0∑N-1 PV(j)*j/Δ Y = i=0∑M-1 PH(i)*i/Δ ……………………..(8) Where PV and PH are the vertical and horizontal projections respectively. 5. Slope of the line joining the Centers of Gravity of the two halves of signature image We divide the signature image within its bounding box into left and right halves and separately determine the centers of gravity of the two halves. We have seen that the slope of the line joining the two centers can serve as an attractive feature to distinguish signatures. 6. Number of Edge Points The edge point is a point that has only one 8-neighbor. In order to extract the edge points in a given signature, we used a 3 3× structuring element with all coefficients equal to 1. 7. Number of Cross Points Cross point is a point that has at least three 8-neighbors. The structuring element that was used to extract edge points, was also used to extract the cross points in a signature. Number of cross points is a nice feature to distinguish signatures.
  • 11.
    11 V. Verification The abovedescribed features are extracted from a sample group of signature images of different persons. The values derived from each sample group are used in deriving a mean signature for each subject. The mean values and standard deviations of all the features are computed and used for final verification. A user defined threshold corresponding to the minimum acceptable degree of similarity for each person was manually estimated. Since users do not like their original signatures to get rejected, we chose the threshold on the lower side to avoid rejection of original signatures. Let μi and σi denote the mean and standard deviation for the ith feature and Fi denote its value for the query image. The Euclidian distance δ in the feature space measures the proximity of a query signature image to the mean signature image of the claimed person. δ = (1/n) i=1∑n [(Fi - μi)/σi]2 ………………(9) If this distance is below a certain threshold then the query signature is verified to be that of the claimed person otherwise it is detected as a forged one.
  • 12.
    12 VI. Implementation Detailsand Simulation Results A database of about 450 signatures was built by collecting signatures from about 30 different persons.10 signatures per person was used for training. In addition to these 3 good signature samples were collected from each person for signature verification purposes. Two signatures per person was also collected to identify forgeries. The signatures were scanned with a precision of 1000X500 pixels. The results of the algorithm for two specimens collected are shown. Sample 1 Original Signature Thresholded Image Bounding Box Rotated Image Left Bounding Box Right Bounding Box
  • 13.
    13 Sample 2 Original SignatureThresholded Image Bounding Box Rotated Image Left Bounding Box Right Bounding Box Skilled Forgery
  • 14.
    14 Mean Values ofFeatures Sample 1 Sample2 Image Threshold 84 93.5 Slant Angle (SA) 15 20 Aspect Ratio (AR) 1.6500 2.8409 Normalized Area (NA) .0803 .0608 Center Of Gravity (COG) (482.2187,212.68) (512.4289, 318.7370) COG - Left half (191.95,113.98) (260.4076, 189.4470) COG -Right half (158.605,206.75) (184.571, 133.5464) Slope -2.8715 0.7371 Number of Edge Points 10 28 Number of Cross Points 6 11 Table: Values of the various features Extracted for the two samples. The results of our simulation for forged and genuine signatures are as shown in the table below. The system is robust; it rejected all the casual forgeries. Out of the 76 genuine signatures that were fed in, 4 were rejected as forgeries. This yielded a False Rejection Rate (FRR) of 5.26%. Also out of 50 skilled forgeries fed into the system, 5 signatures were accepted. This gave us a False Acceptance Rate (FAR) of 10%. Nature of Signature Samples False Acceptance Rate False Rejection Rate Original 76 ----- 5.26% Casual Forgery 75 0% ----- Skilled Forgery 50 10% -----
  • 15.
    15 VII. Conclusions andScope for Future Work The algorithm developed by us, uses various geometric features to characterize signatures that effectively serve to distinguish signatures of different persons. The system is robust and can detect random, simple and semi-skilled forgeries but the performance deteriorates in case of skilled forgeries. Using a higher dimensional feature space and also incorporating dynamic information gathered during the time of signature can also improve the performance. The concepts of Neural Networks as well as Wavelet transforms hold a lot of promise in building systems with high accuracy.
  • 16.
    16 References [1]. N. Papamarkos,H. Baltzakis. Off-line signature verification using multiple neural network classification structures. [2] R. Plamondon, G. Lorette, “Automatic Signature Verification and Writer Identification The State of the Art, Pattern Recognition” 22 (2) (1989) 107-131. [3] Gonzalez R.C., Woods E., 'Digital Image Processing', Addison-Wesley, [4] G. Dimauro, S. Impedovo, M.G.Lucchese, R.Modugno and G. Pirlo “Recent Advancements in Automatic Signature Verification”, Proceedings of the 9th Int’l Workshop on Frontiers in Handwriting Recognition [5] H. Baltzakis, N. Papamarkos, “A new signature verification technique based on a two-stage neural network classifier”, Engineering Application of AI, Vol. 14 , 2001, pp. 95-103. [6] R. Sabourin, R. Plamondon, L. Beaumier, "Structural interpretation of handwritten signature images", IJPRAI, Vol. 8, 3, 1994, pp.709-748.
  • 17.
    17 Percentage Contributions Tasks performedAshish Dhawan Aditi R. Ganesan Literature search 50% 50% Algorithm derivation 50% 50% Matlab programs 50% 50% Database Collection 50% 50% Testing Signatures 50% 50% Report writing 50% 50% Power point presentation 50% 50% Overall 50% 50% Team Member #1: Ashish Dhawan _________________________________ Signature Team Member #2: Aditi R. Ganesan _________________________________ Signature