This study evaluated the performance of six cotton genotypes across four locations based on vegetative branches, fruiting branches, plant height, bolls per plant, and yield. The results showed significant variations among genotypes and locations for most traits. Genotype UKM 08 exhibited the highest number of vegetative branches but lower yields. Genotype NTA 93-21/IL85/AUBURN 56(08)1-5-5 performed best overall, with consistently high yields across locations. Location also influenced traits, with Mwaukoli-Meatu generally showing taller plants and higher yields than other locations. The study highlights the importance of selecting suitable genotypes and growing conditions for optimal cotton cultivation.
Induced Mutagenesis of Flowering, Phenology and Yield in M1 Generation of Bam...ijtsrd
A highly cherished Bambara groundnut variety, ‘Caro’ was treated with different concentrations of ethyl methane sulphonate EMS for different durations to raise an M1 generation. In the M1 generation, the mutagenic effect of EMS on seed germination, growth and seed yield at different doses 0.01 , 0.1 , 0.25 and 0.5 and for different durations 6 hours, 12 hours and 24 hours were studied. Characters like days to first flowering, days to 50 flowering, number of flowers per plant, number of leaves, number of nodes per plant, number of stems per plant, plant spread, plant height, number of branches per plant, pod length, pod width, number of pods per plant, number of seeds per plant, seed length, seed width and seed yield were measured. Data collected were subjected to analysis of variance ANOVA and means were separated using least significant difference LSD . The result showed that there was significant effect p 0.05 of ethyl methane sulphonate concentrations in all the parameters except on number of days to maturity. The concentration, 0.1 and soaking duration of 6 hours was more promising in creating variability. Apparently, could Ethyl methane sulphonate significantly improved the performance and create genetic variability of Bambara groundnut and therefore can be employed in breeding programme for Bambara groundnut. Grace O. Chimdi | Michael I. Uguru | Peter. E. Ogbonna | Nwakuche C. Onwubiko "Induced Mutagenesis of Flowering, Phenology and Yield in M1 Generation of Bambara Groundnut (Vigna Subterrnea (L.) Verdc)" Published in International Journal of Trend in Scientific Research and Development (ijtsrd), ISSN: 2456-6470, Volume-6 | Issue-2 , February 2022, URL: https://www.ijtsrd.com/papers/ijtsrd49327.pdf Paper URL: https://www.ijtsrd.com/other-scientific-research-area/other/49327/induced-mutagenesis-of-flowering-phenology-and-yield-in-m1-generation-of-bambara-groundnut-vigna-subterrnea-l-verdc/grace-o-chimdi
DOI: 10.21276/ijlssr.2016.2.3.19
ABSTRACT- By using gamma rays (physical) & EMS (chemical) mutagens the various genetic variability parameters
were estimated of two soybean cultivars i.e. PKV-1 & JS-335. Characters studied i.e. Plant height, no. of branches per
plant, no. of clusters per plant, no. of pods per plant, yield per plant, 100 grain wt. shows that genotypic coefficient of
variation (G.C.V.) & phenotypic coefficient of variation (PCV), heritability was significantly high. In both the varieties, all
the mutagenic treatments were effective in inducing genetic variability.
Key-words- Gamma rays, EMS, Mutagens, Genetic Variability
Combining ability analysis and nature of gene action for grain yield in Maize...Agriculture Journal IJOEAR
Abstract— In the present investigation combining ability analysis and nature of gene action was studied for twenty lines, four testers and eighty hybrids, which were obtained from Line x tester biparental crossing scheme. The twelve characters were studied for winter maize under this experiment. Parental variance, Line variance, and line x tester variance revealed that there were significant differences in all the characters, whereas only tester variance showed three non-significant characters, namely days to 50% anthesis, days to maturity and cob length. The nature and magnitude of gene action showed that the dominance variance major reason towards hybrid performance for all characters. This means that non-additive action is important for the hybrid performance. The most promising crosses for higher yield per ha were L8 x T1 (27.63), L9 x T4 (23.44), L3 X T3 (23.41), L16 x T2 (23.03), L3 x T3 (22.81), L1 x T3 (22.51), L20 x T2 (19.48), L13 x T4 (19.47), L7 x T1 (18.22) and L17 x T4 (17.58) which have shown high SCA effects for grain yield which high parental GCA effects can be exploited for the development of SCHs because of non-additive gene action.
This study aims to determine the genetic components like Vg(Variance of genotype), Vp ( Variance of phenotype), GCV (Genotypic co-efficient of variation), PCV (Phenotypic coefficient of variation), Hb (Heritability) and GA% (Genetic advance in percentage of means) in F2 generation of the cross Nagina x Bushbeef-steak for predicting quantitative traits. Data was collected on P1, P2 F1 and F2 generation for various yield components and were analyzed. Analyzed data showed relatively high difference between, GCV, Vp and PCV for the traits: Flowers/cluster, Fruits/cluster and Fruit weight and relatively low difference was noted for Vg, GCV and Vp, PCV values in the traits: Fruit diameter, Fruit length and fruits/plant. Highest value of GCV (79.90%) and PCV (92.79%) were noted in the trait: yield/plant and the lowest values of GCV (14.68%) and PCV (16.78%) were noted for fruit-length. Highest value (84.08%) of broad sense heritability %(Hb%) was noted in fruit diameter and the lowest value of heritability(27.58) was noted for the trait fruits/cluster. Moderate value of heritability (74.13%) along with low value (15.22) of GA% was noted for yield/plant.
Grain Yield Stability in Three-way Cross Hybrid Maize Varieties using AMMI an...Premier Publishers
A study to evaluate three-way cross hybrid maize varieties for wide adaptability and stability was conducted in eight environments in Sierra Leone using AMMI and GGE biplot analysis. There were significant genotype and environment main effects, and genotype x environment interactions (GEI) effects. Differences due to environments accounted for 70.1% of the total treatments sum of squares while genotypes and genotype x environment interaction accounted for 9.9% and 20.0%, respectively. The first four interaction principal component axes (IPCA) were also highly significant and accounted for 38.7%, 25.2%, 14.3% and 8.6%, respectively of the total genotype x environment interaction variation. The polygon view of the GGE biplot revealed that hybrid G14 produced the highest grain yield in environments E1, E5 and E7 whereas G24 was adaptive in environments E6, E8, E3, E4 and E2. Hybrids G24, G9, G17 and G6 also produced high grain yields and were relatively stable. Both AMMI and GGE biplot effectively partitioned treatments sum of squares and were more appropriate in explaining genotype x environment interaction. The models also identified G24 as the most desirable hybrid in terms of high grain yield and stability across environments. Therefore, this hybrid is recommended for commercial release.
Advances in host plant resistance and identification of broad-based stable so...ICRISAT
Host Plant Resistance is the most effective and economical management option for Fusarium wilt (Fusarium udum Butler) of pigeonpea (Figure 1) either alone or as a major component of IDM. The disease can cause yield losses of up to 100% in susceptible cultivars. ICRISAT has developed large numbers of high yielding wilt resistant lines by selecting them under high disease pressure in field screening. These resistant lines if found to possess stable resistance across locations, could be utilized in pigeonpea disease resistance breeding program.
Correlation and path analysis for genetic divergence of morphological and fib...Innspub Net
Seventy five genotypes of cultivated cotton (Gossypium hirsutum L.) were studied for morphological characteristics i-e plant height, monopodial branches, sympodial branches, boll weight, seed volume, seed density, seed index and fiber characters. Data were subjected to analysis of variance and estimates were made for genetic advance, broad sense heritability and coefficient of variance for the traits. ANOVA revealed highly significant variability among genotypes for all the characteristics studied. The estimates for heritability were
higher for seed index (0.93) and plant height (0.93). The highest value (6.4) for genetic advance was observed for
sympodial branches whereas lowest value was (0.17) for boll weight. Correlation analysis revealed positive and significant for most of the parameters. In path coefficient, the number of sympodial branches, boll weight, lint index and lint weight had maximum direct and positive effect on fiber fineness of seed cotton. Whereas, the number of monopodial branches, plant height, seed index, seed volume, seed density, staple length, fiber strength and ginning out turn (G.O.T%) had direct and negative effects on fiber of seed cotton. The principle component analysis (PCA) revealed significant differences between genotypes and the first four components with Eigen
values greater than 1 contributed 66.68% of the variability among the genotypes. The grouping of genotypes
possessing excelled traits signifies genetic potential of the germplasm for the improvement of seed and fiber characteristics in cotton crop. Get more articles at: http://www.innspub.net/volume-7-number-4-october-2015-ijaar/
Seed morphometric studies of some Kenaf ( Hibiscus canabinus ) accessions researchagriculture
Fifteen kenaf lines collected from kenaf and Jute Improvement Programme
of Institute of Agricultural Research and Training (I.A.R.& T.) were subjected to digital
imaging analysis using USB microscope with digital imaging software (Veho™ UK) and
Vernier caliper to study the seed morphometric of available kenaf accession and the
possibility of using the morphometric data to determine variations between the
accessions. Ten seeds in four replicates of each seed lot were randomly selected and
measurement of the seed length, seed width, seed angle and seed thickness were
taken. The measurements were inputted and saved into Microsoft excel from where
the mean value of each parameters were calculated for each replicates. Data were
subjected to Analysis of variance, correlation analysis, principal component analysis
and clustering analysis. Variation exit among seed of kenaf accessions though they
had similar microscopic appearance features. Seed area, which was a function of seed
length and seed width contributed largely to the variation that exist between the seed
of kenaf accessions. Accession HC
-
583
-
31
2
, clearly distinguished itself from others and
therefore can be used in parent selection during breeding programmes. The inclusion
of this seed morphometrics trait in taxonomic description of kenaf is recommended to
increase the accuracy of morphological classification of kenaf.
The development of more efficient and sustainable technologies in the production of materials in ‘in vitro’ cassava (Manihot esculenta Crantz), favor the improvement of seed quality and sanitation of the plant material. The purpose of the research is to evaluate the effectiveness of Pectimorf® (mixed oligo-galacturonide), it’s safe and natural availability in Cuba. It is used as a possible complement or substitute for growth regulators traditionally used in the culture medium for the propagation of this crop in vitro. In this study, the results obtained indicate that, at least, under the experimental conditions, the Pectimorf®, altered patterns of development and distribution of stomata in the leaves of cassava plants, where the effect was most evident when the product is added to the culture medium. The new results contribute to the elucidation of the mechanisms of action of this substance.
Variability in seed testing results, factors affecting the variability, application and use of tolerance tables and seed standards and Sequential sampling
Correlation and Path analysis studies among yield and yield related traits in...Premier Publishers
The16 Soybean genotypes were evaluated for Association of characters and path coefficient analysis on eleven important yield and grain yield contributing characters at Bako Tibe during the main cropping season of 2015/16. The experiment was designed as RCBD with three- replication. Generally, the magnitudes of genotypic correlation coefficients for most of the characters were higher than their corresponding phenotypic correlation coefficients that indicate the presence of inherent association among various characters. In this study yield was positively correlated with hundred seed weight, number of seed/pod and number of pod per plant so, increasing these traits ultimately increases in grain yield and days to maturity can be exploited through improvement and selection program. Based on findings it can be concluded that pod length, number of pod /plant, biological yield, grain yield and days to maturity can be exploited through selection and improvement program to develop high yielding soybean genotypes.
Many ways to support street children.pptxSERUDS INDIA
By raising awareness, providing support, advocating for change, and offering assistance to children in need, individuals can play a crucial role in improving the lives of street children and helping them realize their full potential
Donate Us
https://serudsindia.org/how-individuals-can-support-street-children-in-india/
#donatefororphan, #donateforhomelesschildren, #childeducation, #ngochildeducation, #donateforeducation, #donationforchildeducation, #sponsorforpoorchild, #sponsororphanage #sponsororphanchild, #donation, #education, #charity, #educationforchild, #seruds, #kurnool, #joyhome
Grain Yield Stability in Three-way Cross Hybrid Maize Varieties using AMMI an...Premier Publishers
A study to evaluate three-way cross hybrid maize varieties for wide adaptability and stability was conducted in eight environments in Sierra Leone using AMMI and GGE biplot analysis. There were significant genotype and environment main effects, and genotype x environment interactions (GEI) effects. Differences due to environments accounted for 70.1% of the total treatments sum of squares while genotypes and genotype x environment interaction accounted for 9.9% and 20.0%, respectively. The first four interaction principal component axes (IPCA) were also highly significant and accounted for 38.7%, 25.2%, 14.3% and 8.6%, respectively of the total genotype x environment interaction variation. The polygon view of the GGE biplot revealed that hybrid G14 produced the highest grain yield in environments E1, E5 and E7 whereas G24 was adaptive in environments E6, E8, E3, E4 and E2. Hybrids G24, G9, G17 and G6 also produced high grain yields and were relatively stable. Both AMMI and GGE biplot effectively partitioned treatments sum of squares and were more appropriate in explaining genotype x environment interaction. The models also identified G24 as the most desirable hybrid in terms of high grain yield and stability across environments. Therefore, this hybrid is recommended for commercial release.
Advances in host plant resistance and identification of broad-based stable so...ICRISAT
Host Plant Resistance is the most effective and economical management option for Fusarium wilt (Fusarium udum Butler) of pigeonpea (Figure 1) either alone or as a major component of IDM. The disease can cause yield losses of up to 100% in susceptible cultivars. ICRISAT has developed large numbers of high yielding wilt resistant lines by selecting them under high disease pressure in field screening. These resistant lines if found to possess stable resistance across locations, could be utilized in pigeonpea disease resistance breeding program.
Correlation and path analysis for genetic divergence of morphological and fib...Innspub Net
Seventy five genotypes of cultivated cotton (Gossypium hirsutum L.) were studied for morphological characteristics i-e plant height, monopodial branches, sympodial branches, boll weight, seed volume, seed density, seed index and fiber characters. Data were subjected to analysis of variance and estimates were made for genetic advance, broad sense heritability and coefficient of variance for the traits. ANOVA revealed highly significant variability among genotypes for all the characteristics studied. The estimates for heritability were
higher for seed index (0.93) and plant height (0.93). The highest value (6.4) for genetic advance was observed for
sympodial branches whereas lowest value was (0.17) for boll weight. Correlation analysis revealed positive and significant for most of the parameters. In path coefficient, the number of sympodial branches, boll weight, lint index and lint weight had maximum direct and positive effect on fiber fineness of seed cotton. Whereas, the number of monopodial branches, plant height, seed index, seed volume, seed density, staple length, fiber strength and ginning out turn (G.O.T%) had direct and negative effects on fiber of seed cotton. The principle component analysis (PCA) revealed significant differences between genotypes and the first four components with Eigen
values greater than 1 contributed 66.68% of the variability among the genotypes. The grouping of genotypes
possessing excelled traits signifies genetic potential of the germplasm for the improvement of seed and fiber characteristics in cotton crop. Get more articles at: http://www.innspub.net/volume-7-number-4-october-2015-ijaar/
Seed morphometric studies of some Kenaf ( Hibiscus canabinus ) accessions researchagriculture
Fifteen kenaf lines collected from kenaf and Jute Improvement Programme
of Institute of Agricultural Research and Training (I.A.R.& T.) were subjected to digital
imaging analysis using USB microscope with digital imaging software (Veho™ UK) and
Vernier caliper to study the seed morphometric of available kenaf accession and the
possibility of using the morphometric data to determine variations between the
accessions. Ten seeds in four replicates of each seed lot were randomly selected and
measurement of the seed length, seed width, seed angle and seed thickness were
taken. The measurements were inputted and saved into Microsoft excel from where
the mean value of each parameters were calculated for each replicates. Data were
subjected to Analysis of variance, correlation analysis, principal component analysis
and clustering analysis. Variation exit among seed of kenaf accessions though they
had similar microscopic appearance features. Seed area, which was a function of seed
length and seed width contributed largely to the variation that exist between the seed
of kenaf accessions. Accession HC
-
583
-
31
2
, clearly distinguished itself from others and
therefore can be used in parent selection during breeding programmes. The inclusion
of this seed morphometrics trait in taxonomic description of kenaf is recommended to
increase the accuracy of morphological classification of kenaf.
The development of more efficient and sustainable technologies in the production of materials in ‘in vitro’ cassava (Manihot esculenta Crantz), favor the improvement of seed quality and sanitation of the plant material. The purpose of the research is to evaluate the effectiveness of Pectimorf® (mixed oligo-galacturonide), it’s safe and natural availability in Cuba. It is used as a possible complement or substitute for growth regulators traditionally used in the culture medium for the propagation of this crop in vitro. In this study, the results obtained indicate that, at least, under the experimental conditions, the Pectimorf®, altered patterns of development and distribution of stomata in the leaves of cassava plants, where the effect was most evident when the product is added to the culture medium. The new results contribute to the elucidation of the mechanisms of action of this substance.
Variability in seed testing results, factors affecting the variability, application and use of tolerance tables and seed standards and Sequential sampling
Correlation and Path analysis studies among yield and yield related traits in...Premier Publishers
The16 Soybean genotypes were evaluated for Association of characters and path coefficient analysis on eleven important yield and grain yield contributing characters at Bako Tibe during the main cropping season of 2015/16. The experiment was designed as RCBD with three- replication. Generally, the magnitudes of genotypic correlation coefficients for most of the characters were higher than their corresponding phenotypic correlation coefficients that indicate the presence of inherent association among various characters. In this study yield was positively correlated with hundred seed weight, number of seed/pod and number of pod per plant so, increasing these traits ultimately increases in grain yield and days to maturity can be exploited through improvement and selection program. Based on findings it can be concluded that pod length, number of pod /plant, biological yield, grain yield and days to maturity can be exploited through selection and improvement program to develop high yielding soybean genotypes.
Similar to On-farm trials report 2022-2023.docx (20)
Many ways to support street children.pptxSERUDS INDIA
By raising awareness, providing support, advocating for change, and offering assistance to children in need, individuals can play a crucial role in improving the lives of street children and helping them realize their full potential
Donate Us
https://serudsindia.org/how-individuals-can-support-street-children-in-india/
#donatefororphan, #donateforhomelesschildren, #childeducation, #ngochildeducation, #donateforeducation, #donationforchildeducation, #sponsorforpoorchild, #sponsororphanage #sponsororphanchild, #donation, #education, #charity, #educationforchild, #seruds, #kurnool, #joyhome
Russian anarchist and anti-war movement in the third year of full-scale warAntti Rautiainen
Anarchist group ANA Regensburg hosted my online-presentation on 16th of May 2024, in which I discussed tactics of anti-war activism in Russia, and reasons why the anti-war movement has not been able to make an impact to change the course of events yet. Cases of anarchists repressed for anti-war activities are presented, as well as strategies of support for political prisoners, and modest successes in supporting their struggles.
Thumbnail picture is by MediaZona, you may read their report on anti-war arson attacks in Russia here: https://en.zona.media/article/2022/10/13/burn-map
Links:
Autonomous Action
http://Avtonom.org
Anarchist Black Cross Moscow
http://Avtonom.org/abc
Solidarity Zone
https://t.me/solidarity_zone
Memorial
https://memopzk.org/, https://t.me/pzk_memorial
OVD-Info
https://en.ovdinfo.org/antiwar-ovd-info-guide
RosUznik
https://rosuznik.org/
Uznik Online
http://uznikonline.tilda.ws/
Russian Reader
https://therussianreader.com/
ABC Irkutsk
https://abc38.noblogs.org/
Send mail to prisoners from abroad:
http://Prisonmail.online
YouTube: https://youtu.be/c5nSOdU48O8
Spotify: https://podcasters.spotify.com/pod/show/libertarianlifecoach/episodes/Russian-anarchist-and-anti-war-movement-in-the-third-year-of-full-scale-war-e2k8ai4
This session provides a comprehensive overview of the latest updates to the Uniform Administrative Requirements, Cost Principles, and Audit Requirements for Federal Awards (commonly known as the Uniform Guidance) outlined in the 2 CFR 200.
With a focus on the 2024 revisions issued by the Office of Management and Budget (OMB), participants will gain insight into the key changes affecting federal grant recipients. The session will delve into critical regulatory updates, providing attendees with the knowledge and tools necessary to navigate and comply with the evolving landscape of federal grant management.
Learning Objectives:
- Understand the rationale behind the 2024 updates to the Uniform Guidance outlined in 2 CFR 200, and their implications for federal grant recipients.
- Identify the key changes and revisions introduced by the Office of Management and Budget (OMB) in the 2024 edition of 2 CFR 200.
- Gain proficiency in applying the updated regulations to ensure compliance with federal grant requirements and avoid potential audit findings.
- Develop strategies for effectively implementing the new guidelines within the grant management processes of their respective organizations, fostering efficiency and accountability in federal grant administration.
Jennifer Schaus and Associates hosts a complimentary webinar series on The FAR in 2024. Join the webinars on Wednesdays and Fridays at noon, eastern.
Recordings are on YouTube and the company website.
https://www.youtube.com/@jenniferschaus/videos
Presentation by Jared Jageler, David Adler, Noelia Duchovny, and Evan Herrnstadt, analysts in CBO’s Microeconomic Studies and Health Analysis Divisions, at the Association of Environmental and Resource Economists Summer Conference.
Jennifer Schaus and Associates hosts a complimentary webinar series on The FAR in 2024. Join the webinars on Wednesdays and Fridays at noon, eastern.
Recordings are on YouTube and the company website.
https://www.youtube.com/@jenniferschaus/videos
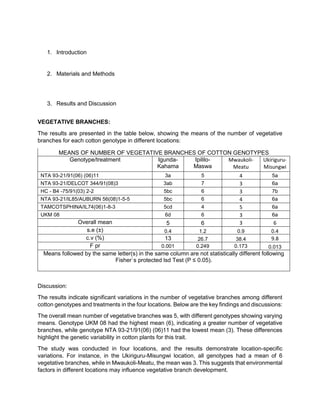
1. 1. Introduction
2. Materials and Methods
3. Results and Discussion
VEGETATIVE BRANCHES:
The results are presented in the table below, showing the means of the number of vegetative
branches for each cotton genotype in different locations:
MEANS OF NUMBER OF VEGETATIVE BRANCHES OF COTTON GENOTYPES
Genotype/treatment Igunda-
Kahama
Ipililo-
Maswa
Mwaukoli-
Meatu
Ukiriguru-
Misungwi
NTA 93-21/91(06) (06)11 3a 5 4 5a
NTA 93-21/DELCOT 344/91(08)3 3ab 7 3 6a
HC - B4 -75/91(03) 2-2 5bc 6 3 7b
NTA 93-21/IL85/AUBURN 56(08)1-5-5 5bc 6 4 6a
TAMCOTSPHINA/IL74(06)1-8-3 5cd 4 5 6a
UKM 08 6d 6 3 6a
Overall mean 5 6 3 6
s.e (±) 0.4 1.2 0.9 0.4
c.v (%) 13 26.7 38.4 9.8
F pr 0.001 0.249 0.173 0.013
Means followed by the same letter(s) in the same column are not statistically different following
Fisher`s protected lsd Test (P ≤ 0.05).
Discussion:
The results indicate significant variations in the number of vegetative branches among different
cotton genotypes and treatments in the four locations. Below are the key findings and discussions:
The overall mean number of vegetative branches was 5, with different genotypes showing varying
means. Genotype UKM 08 had the highest mean (6), indicating a greater number of vegetative
branches, while genotype NTA 93-21/91(06) (06)11 had the lowest mean (3). These differences
highlight the genetic variability in cotton plants for this trait.
The study was conducted in four locations, and the results demonstrate location-specific
variations. For instance, in the Ukiriguru-Misungwi location, all genotypes had a mean of 6
vegetative branches, while in Mwaukoli-Meatu, the mean was 3. This suggests that environmental
factors in different locations may influence vegetative branch development.
2. The analysis of variance (F pr) shows that there are significant differences in vegetative branch
means among genotypes in Igunda-Kahama (p = 0.001), while in other locations (Ipililo-Maswa,
Mwaukoli-Meatu, and Ukiriguru-Misungwi), the differences were not statistically significant.
The standard error and coefficient of variation provide insights into the precision and reliability of
the means. The s.e values are relatively small, indicating that the means are reliable. The c.v
values vary among locations, with the highest being in Mwaukoli-Meatu (38.4%), suggesting
higher variability in this location.
The study reveals significant variations in the number of vegetative branches among different
cotton genotypes and locations. Genotype UKM 08 exhibited the highest number of vegetative
branches, while genotype NTA 93-21/91(06) (06)11 had the lowest. These findings emphasize
the importance of genotype selection and consideration of environmental factors in cotton
cultivation.
FRUITING BRANCHES
The results of the study, shown in the table below, reveal the mean number of fruiting branches
for each cotton genotype at the four different locations.
MEANS OF NUMBER OF FRUITING BRANCHES COTTON GENOTYPES
Genotype/treatment Igunda-
Kahama
Ipililo-
Maswa
Mwaukoli-
Meatu
Ukiriguru-
Misungwi
TAMCOTSPHINA/IL74(06)1-8-3 6 11 8 7
NTA 93-21/91(06) (06)11 7 9 9 7
NTA 93-21/DELCOT 344/91(08)3 7 9 9 7
UKM 08 7 9 12 7
NTA 93-21/IL85/AUBURN 56(08)1-5-5 9 9 10 7
HC - B4 -75/91(03) 2-2 9 9 10 7
Overall mean 7 9 10 7
s.e (±) 1.5 0.7 1.6 0.6
c.v (%) 29.6 9.2 23.5 13.1
F pr 0.388 0.146 0.167 0.823
Means followed by the same letter(s) in the same column are not statistically different following
Fisher`s protected lsd Test (P ≤ 0.05).
Discussion:
The results of this study suggest that the number of fruiting branches in cotton genotypes can
vary, and this variation is influenced by both genotype and location. The overall mean fruiting
branch count of 7 suggests that, on average, cotton plants in this study produced seven fruiting
branches. However, it is essential to note that this mean is an aggregate, and the specific counts
varied between genotypes and locations.
The low F-ratio values indicate that, in most cases, the differences in fruiting branches between
genotypes and locations were not statistically significant. This implies that the genotypes tested
3. in this study showed similar performance in terms of fruiting branches, and the choice of location
did not significantly impact the fruiting branch count.
The coefficient of variation (c.v) values provide insights into the variability within each dataset.
Locations Mwaukoli-Meatu and Ukiriguru-Misungwi exhibited higher c.v values compared to
Igunda-Kahama and Ipililo-Maswa, indicating greater variability in fruiting branch counts in the
former locations.
Overall, while there were differences in fruiting branch counts among the cotton genotypes and
locations, these differences were not statistically significant. This suggests that other factors, such
as weather conditions, soil quality, and pest management, may have a more substantial impact
on cotton yield.
PLANT HEIGHT
The mean plant heights for each cotton genotype/treatment, along with the overall mean, standard
error, coefficient of variation, and F-test results, are summarized in the table below:
MEANS FOR PLANT HEIGHT (cm) OF COTTON GENOTYPES
Genotype/treatment Igunda-
Kahama
Ipililo-
Maswa
Mwaukoli-
Meatu
Ukiriguru-
Misungwi
UKM 08 94.6a 94.33 99.9b 93.55bc
TAMCOTSPHINA/IL74(06)1-8-3 96.4a 94.73 79.1a 83.6ab
NTA 93-21/IL85/AUBURN 56(08)1-5-5 97.5a 87.67 102.2b 82.85ab
NTA 93-21/DELCOT 344/91(08)3 106.8b 82.87 105.8bc 78.25a
HC - B4 -75/91(03) 2-2 108.6b 90 108bc 96.05c
NTA 93-21/91(06) (06)11 121.6c 91.87 117c 85.2abc
Overall mean 104.25 90.2 102 86.6
s.e (±) 1.519 5.57 5.32 5.34
c.v (%) 2.1 7.6 7.4 8.7
F pr <.001 0.338 <.001 0.034
Means followed by the same letter(s) in the same column are not statistically different following
Fisher`s protected lsd Test (P ≤ 0.05).
Discussion:
The analysis of the data reveals several important findings:
Genotypes showed significant variations in their mean plant heights. Genotype NTA 93-21/91(06)
(06)11 exhibited the tallest plants with an average height of 121.6 cm, followed by HC - B4 -
75/91(03) 2-2 (108.6 cm) and NTA 93-21/DELCOT 344/91(08)3 (106.8 cm).
TAMCOTSPHINA/IL74(06)1-8-3 had the shortest plants on average (79.1 cm).
The data suggests that the effect of location and treatment on plant height is not consistent across
genotypes. For instance, genotype UKM 08 had its tallest plants in the Mwaukoli-Meatu treatment
(99.9 cm) but the shortest in the Ukiriguru-Misungwi treatment (93.55 cm). Genotype NTA 93-
4. 21/IL85/AUBURN 56(08)1-5-5 showed the highest variability across locations with an average
height ranging from 87.67 cm in Ipililo-Maswa to 102.2 cm in Mwaukoli-Meatu.
The overall mean plant height for all genotypes and treatments was 104.25 cm. The coefficient of
variation (c.v) was relatively low, indicating low variability in the overall dataset.
The F-test results demonstrate statistical significance for genotype and location/treatment (except
for Ipililo-Maswa). Moreover, the analysis reveals that different genotypes respond differently to
various locations in terms of plant height. This information can be crucial for cotton breeders and
farmers in selecting the most suitable genotypes to optimize cotton plant growth.
AVERAGE NUMBER OF BOLLS PER PLANT:
The means for the number of bolls per plant for each genotype/treatment, along with the overall
mean, standard error, coefficient of variation, and F-value, are presented in the table below:
MEANS FOR NUMBER OF BOLLS PER PLANT OF COTTON GENOTYPES
Genotype/treatment Igunda-
Kahama
Ipililo-
Maswa
Mwaukoli-
Meatu
Ukiriguru-
Misungwi
TAMCOTSPHINA/IL74(06)1-8-3 8a 7 8 9
UKM 08 9ab 10 13 10
NTA 93-21/DELCOT 344/91(08)3 11bc 8 10 8
HC - B4 -75/91(03) 2-2 13c 10 11 11
NTA 93-21/IL85/AUBURN 56(08)1-5-5 13c 8 10 10
NTA 93-21/91(06) (06)11 13c 10 11 9
Overall mean 11 9 10 9
s.e (±) 1.2 1.4 1.9 1.4
c.v (%) 15.3 20.2 25.1 21.5
F pr 0.002 0.479 0.213 0.619
Means followed by the same letter(s) in the same column are not statistically different following
Fisher`s protected lsd Test (P ≤ 0.05).
Discussion:
The analysis of the data reveals several key findings:
There are significant differences in the number of bolls per plant among the different cotton
genotypes. Genotypes like HC - B4 -75/91(03) 2-2 and NTA 93-21/IL85/AUBURN 56(08)1-5-5
consistently produce a higher number of bolls compared to others.
The locations subjected to each genotype have varying effects on boll production. For example,
the UKM 08 genotype produces significantly more bolls under location 3 (Mwaukoli-Meatu) (13
bolls) compared to other locations and other genotypes. The overall mean for the number of bolls
per plant across all genotypes and treatments is 11. This value provides a baseline for evaluating
the performance of individual genotypes.
5. The coefficient of variation (c.v) represents the relative variability in boll production within each
genotype and treatment. Higher c.v values indicate greater variability. In this study, Mwaukoli-
Meatu has the highest c.v value (25.1%), suggesting that it exhibits the most variable boll
production.
The F-value indicates the overall significance of the differences observed. In this study, the F-
values are relatively low, suggesting that the differences in boll production among genotypes and
treatments are statistically significant at Igunda-Kahama while the case is opposite in other
locations.
These findings have practical implications for cotton growers and breeders. Genotypes that
consistently produce more bolls can be targeted for further cultivation and breeding programs.
Additionally, the choice of location can impact boll production, highlighting the importance of
selecting the right growing conditions for specific cotton genotypes.
AVERAGE YIELDS:
The results of the study, shown in the table below, reveal the mean yield for each cotton genotype
at the four different locations.
YIELD MEANS (Kg/ha) OF COTTON GENOTYPES
Genotype Igunda-
Kahama
Ipililo-
Maswa
Mwaukoli-
Meatu
Ukiriguru-
Misungwi
UKM 08 1603 2149 2584 1251
NTA 93-21/DELCOT 344/91(08)3 1660 2211 2606 1592
TAMCOTSPHINA/IL74(06)1-8-3 1846 2048 2042 1143
NTA 93-21/91(06) (06)11 2161 2058 2369 1300
HC - B4 -75/91(03) 2-2 2195 2113 3206 1174
NTA 93-21/IL85/AUBURN 56(08)1-5-5 2275 2061 2403 1438
Overall mean 1957 2106.7 2534.9 1316.54
s.e (±) 382.4 181.149 841.464 153.365
c.v (%) 27.6 10.5 46.9 16.5
F pr 0.372 0.93 0.827 0.079
Means followed by the same letter(s) in the same column are not statistically different following Fisher`s
protected lsd Test (P ≤ 0.05).
6. Discussion:
The overall mean yield of all genotypes combined is 1957 Kg/ha in Igunda-Kahama, 2106.7 Kg/ha
in Ipililo-Maswa, 2534.9 Kg/ha in Mwaukoli-Meatu, and 1316.54 Kg/ha in Ukiriguru-Misungwi.
Among the genotypes, "NTA 93-21/IL85/AUBURN 56(08)1-5-5" consistently showed the highest
yield in all locations. "HC - B4 -75/91(03) 2-2" also demonstrated strong performance, especially
in Mwaukoli-Meatu, where it had the highest yield. "TAMCOTSPHINA/IL74(06)1-8-3" had the
lowest yields in most locations, particularly in Ukiriguru-Misungwi. The location significantly affects
cotton yield, with Mwaukoli-Meatu showing the highest overall mean yield, while Ukiriguru-
Misungwi has the lowest.
The coefficient of variation (c.v) indicates the variability in yields. A higher c.v suggests greater
variability, which can be seen in Mwaukoli-Meatu and Ukiriguru-Misungwi. The standard error
(s.e) is highest in Mwaukoli-Meatu, indicating that the mean yield values in this location are less
precise.
The F-ratio (F pr) tests the significance of differences between genotypes. A lower F-ratio
suggests that the differences are not statistically significant. In this case, the differences in yield
between genotypes are generally not statistically significant.
Genotypes like "NTA 93-21/IL85/AUBURN 56(08)1-5-5" and "HC - B4 -75/91(03) 2-2" show
promise and may be preferred in regions with similar climatic conditions to those in the study. The
choice of cotton genotype can significantly impact yield.