SlideShare a Scribd company logo
1 of 131
1. INTRODUCTION
Cheap food has been taken for granted for almost 30 years.
From their peak in the 1970s crisis, real food prices steadily
declined in the 1980s and 1990s and eventually reached an all-
time low in the early 2000s (Heady and Fan, 2010). Since 2003,
the international prices of a wide range of commodities have
surged upwards in dramatic fashion, often more than doubling
within a few years, in some cases even within a few months
(Heady and Fan, 2008).Food prices based on the International
Monetary Fund (IMF) food price index increased by 9.5 %
between April 2006 and April 2007 and by 45.6 % over the next
12 months. The increase has been particularly very sharp for
staple foods. Rice prices doubled in the five months between
November 2007 and March 2008, wheat prices increased more
than twofold in the 12 months after March 2007 and maize
prices doubled in one and half year after August 2006. These
increases in prices of staple foods have led to emergencies and
rationing in a large number of countries and there are frequent
reports of food riots from various parts of the globe (Chand,
2008).In 2007 the food price index calculated by the Food and
Agriculture Organization of the United Nations (FAO) rose by
nearly 40 %, compared with 9 % the year before, and in the first
months of 2008 prices again increased drastically. Nearly every
agricultural commodity is part of this rising price trend. Since
2000—a year of low prices—the wheat price in the international
market has more than tripled and maize prices have more than
doubled. The price of rice jumped to unprecedented levels in
March 2008. Dairy products, meat, poultry, palm oil, and
cassava have also experienced price hikes (von Braun, 2008). In
2007-08, world food prices reached record levels, rising 80% in
18 months. Following this peak, food prices fell, but since 2009
the cost of food has been climbing steadily in global markets,
reaching record highs again in 2011. Over the last five years,
the FAO food price index has risen by 92%, threatening the
lives and livelihoods of millions of people (FAO,
2012).Although food prices are now lower than their 2008 peak,
real prices have remained significantly higher in 2009 and 2010
than they were prior to the crisis, and various simulation models
predict that real food prices will remain high until at least the
end of the next decade. Needless to say, the stability and
effectiveness of the world food system are no longer taken for
granted (Heady and Fan, 2010).
Source: IMF, Data & Statistics
Figure 1.1. World Food Price Index (base 2005=100)
Although food commodities are not unique in undergoing such
rapid price rises (energy and mineral prices have also surged), a
sharp escalation in the price of basic foods has been a burden on
the poor in developing countries, who spend roughly half of
their household incomes on food. Sharply rising prices offer
few means of substitution and adjustment, especially for the
urban poor, so there are justifiable concerns that millions of
people may be plunged into poverty by this crisis, and that
those who are already poor may suffer further through increased
hunger and malnutrition (Mitchell, 2008; Heady and Fan, 2010).
Yet surging food prices have caused panic and protest in several
countries and led to policy actions such as the banning of grain
and other food exports by a number of countries and tariff
reductions on imported foods in others. The policy actions
reflect the concern of governments about the impact of food
price increases on the poor in developing countries who, on
average, spend half of their household incomes on food
(Mitchell, 2008; Heady and Fan, 2010).
In its 2008 state of food insecurity publication, FAO (2008)
estimatesthat the number of chronically hungry people in 2007
increased by 75 millionover its estimate of 848 million
undernourished in 2003–05, with muchof the increase attributed
to high food prices. Equally grave concerns have been felt with
respect to the impacts that rising food and fuel prices may have
had on macroeconomic stability and economic growth. And
although the food and fuel crises have largely abated since mid-
2008 and have taken a back seat to the ongoing global financial
crisis, food prices have remained high by historical standards
and are predicted to stay high in the years to come (Heady and
Fan, 2010).Moreover, the evidence of large household surveys
since the 1970s generally indicates that food prices will have a
negative impact on the welfare of not just urban areas, because
many rural poor in developing countries are also net food
consumers (World Bank 2008b). These facts have prompted
some development agencies to suggest that rising food prices
plunge millions more into poverty and deepen poverty still
further for those already struggling (World Bank 2008a).
A wide range of research has examined the (potential) impacts
of higher food prices on poverty (Ahmed et al., 2007; Aksoy
and Isik-Dikmelik, 2010; Dessus et al., 2008; Headey and Fan,
2008; IMF, 2008; Ivanic and Martin, 2008; Wodon et al., 2008;
Wodon and Zaman, 2008; World Bank, 2008; Zezza et al.,
2008). Although we still do not know the accurate welfare
effect of higher food prices on urban, rural and country level
poverty, the findings of the studies suggest that the overall
impact of higher food prices on poverty is generally adverse.
Many of the countries in the study samples of Ivanic and Martin
(2008) and Wodon et al. (2008) experience significant increases
in poverty. However for some studies this conclusion is much
more obvious for urban consumers, for some other studies
changes in rural poverty are larger than those in urban poverty,
especially in Africa. Surprisingly, the study by Ivanic and
Martin (2008) shows that rural poverty increases more than
urban poverty does, for two out of three countries examined. In
Zambia, for example, the incidence of rural poverty increases
three times as much as urban poverty. However Aksoy and Isik-
Dikmelik (2010) analyze some of the same household surveys as
Ivanic and Martin (2008), and they end up with different
results. They conclude that (i) although most poor households
are net food buyers, almost 50 % are marginal net buyers and
(ii) net buyers typically have higher average incomes than net
food sellers in eight of the nine countries surveyed, so that a
rise in food prices would generally have progressive effects on
income distribution.
The real welfare effect of higher food prices depends on
whether the poor are net buyers or net sellers of food. Since
rural populations also have large numbers of net buyers of food,
it depends on whether they are marginal net buyers or sellers.
Low prices on the world market benefit net buyers and hurt net
sellers of the specific product. However, a straightforward
implication of these basic principles is that urban consumers
lose and rural farmers gain in post-2007 period, and vice versa
in pre-2007 period (according to the Figure 1); media coverage
of food crisis is limited to food price inflation (i.e. urban
consumers).Since public officials react to media news because
they see it as a reflection of public opinion (Kim, 2005), the
media are important actors in policy-making. Paying a
disproportionate amount of attention to the problems of urban
consumers and yet not paying any attention to the problems of
rural farmers (i.e. media bias) will translate into bad policies
(i.e. policy bias).
2. THE CAUSES AND CONSEQUENCESOF FOOD CRISIS
2.2 The Causes of Food Crisis
The factors driving recent food price increases are complex.
Notwithstanding, looking at the interplay of the forces driving
food prices display a clearer picture for understanding the issue.
A wide range of research has attempted to identify which
factors might have caused the recent surge in food prices
(Abbott et al., 2009; Baltzer et al., 2008; Chand, 2008; Headey
and Fan, 2008; Headey and Fan, 2010; Helbling et al., 2008;
Mitchell, 2008; Schnepf, 2008; Trostle, 2008; von Braun, 2008).
In this study, driving factors are investigated by their impacts
on the demand and supply of agricultural products.
2.2.1 Demand-side Factors
Numerous studies recognize biofuels production as a major
driver of food prices. Biofuel production has surged since 2003,
and consumed 25% of the US corn crop in 2007; two-thirds of
global maize exports are from the US. This explanation is
strong for corn, less so for wheat, despite the fact that
substitution effects could account for rises in other products
(Headey and Fan, 2008).
Another driving factor is rapid economic growth in developing
countries, thus rising demand, especially from China and India.
This factor partly explains rising oil prices and partly explains
demand for oilseeds. The weakness of this explanation is
thatChina and India are self-sufficient in most major grains, but
have not increased imports of any staple foods (Headey and
Fan, 2008).
Financial market speculation is a widely discussed explanation
of the causes of food crisis. Increased financial market activity
corresponds with the rise in food prices. Despite the fact that
futures markets may have exacerbated the volatility in
agriculturalmarkets, they are unlikely to be a main reason for
the overall price surge, since there is little proof that these
markets essentially impact “real” supply and demand factors.
There is not yet clear evidence of a causal link (Headey and
Fan, 2008).
Another explanation is the depreciation of the U.S. dollar
(USD) over the last years, especially against the Euro. Real
agricultural trade-weighted index for US depreciated 22% over
2002-2007; USD and commodity prices are covariate. Mitchell
(2008) calculates that this factor probably increased dollar-
denominated prices by 20% (Headey and Fan, 2008). Yet,
Abbott et al. (2009) argue that causality is difficult to sort out
since both prices and the exchange rate are determined
simultaneously by macroeconomic performance and policy.
Another explanation of surging prices is that low real interest
rates, especially in the US, have brought about a general price
increase in a wide range of commodities. Low interest rates
ought to increase demand for storable commodities, increase
stocks, and shift investors from treasury bills to commodity
contracts. The weakness of this explanation is that there is no
clear evidence that futures markets are affecting spot prices.
Gold and oil stocks are reasonably high, but stocks of staples
are low (Headey and Fan, 2008).
2.2.1.1 Biofuels demand
Biofuels have pushed the demand for specific food crops up. An
outstanding factor supporting the differencebetween this boom
and earlier ones is the role of biofuels.High oil prices in recent
years, together with generous policysupport in the United States
and the European Union, have ledto a surge in the use of
biofuels as a supplement to transportationfuels, particularly in
the advanced economies (Helbling et al., 2008).
Historically, energy and agricultural markets were largely
independent, each influenced by their relevant supply and
demand situations. That is no longer the case. Since biofuels
production surged in 2006, energy and agricultural markets
became closely linked. Ethanol and biodiesel were linked as
energy substitutes for gasoline and diesel. Usage of crops for
these biofuels became large enough to influence world prices
(Abbott et al., 2009).
Once oil prices reached $60 a barrel, biofuels became more
competitive against oil. The increase in oil prices appears to
have prompted the increase in biofuel demand (Schmidhuber,
2006). This dramatic increase in the prices of fossil fuels
required a search for alternative sources of energy, and liquid
biofuel is seen as an important alternative. Developed countries
like the U.S. and EU took advantage of this situation. These
countries can give support and subsidies to their producers for
producing biofuel crops for domestic use without any problems
with the WTO. The trend towards biofuel production helps in
reducing subsidies and tariff as it leads to higher prices.
Substitution of fossil by biofuel is also helpful in meeting the
requirements of the Kyoto Protocol on climate change to reduce
greenhouse gas emissions. As a long-term energy strategy, the
U.S. is looking for energy security and is working hard to
reduce its dependence for oil on the petroleum exporting
countries, especially on Organisation of Petroleum Exporting
Countries (OPEC). To achieve this goal, liquid biofuel is seen
as a viable substitute (Chand, 2008).
In recent decades, small amounts of biofuels have been
produced and used in several countries. Biofuel production grew
slowly until after the turn of the century. Ethanol production in
the U.S. began to increase more rapidly in 2003; biodiesel
production in the EU began to increase more rapidly in 2005.
The U.S. and Brazil are the global leaders for ethanol. They
account for about threefourths of global ethanol production
(Trostle, 2008). The main biofuels are ethanol from corn or
sugarcane and biodiesel from oilseeds or palm. U.S. ethanol is
mainly from corn while Brazil ethanol is mainly from
sugarcane. The U.S. overtook Brazil as the leading ethanol
producer in the world in 2007. However the European Union,
China and India also produce ethanol, Brazil and the U.S.
together covered most of global ethanol production. The EU is
the major global player for biodiesel with more than
threefourths of global production. The U.S. had 20 % of global
production in 2006. The EU pays more attention to biodiesel
than ethanol because a much higher percentage of the
automobile fleet is diesel. On the other hand the U.S. pays more
attention to ethanol because its fleet is predominantly gasoline.
Rapeseed is the primary feedstock in the EU, whereas soybeans
are used in the United States. Rapeseed contains about 40 % oil,
and soybeans about 18 % (Abbott et al., 2009).
When the substitution effect is considered, the increase in
biofuel production is a powerful explanation for the rapid rise
in the price of many agricultural products, such as corn,
soybeans and some oilseeds. Despite all the differences in
approach, many studies(Abbott et al., 2009; Chand, 2008;
Collins, 2008; Glauber, 2008; Helblinget al., 2008; Lipsky,
2008; Mitchel, 2008; Rosegrant, et al. 2008; Shnepfh, 2008;
Trostle, 2008; van der Mensbrugghe, 2006)recognize biofuels
production as a major driver of food prices.Glauber
(2008)argues that the increase in farm prices of maize and
soybeans is linked to biofuels production. Mitchell (2008)
remarks that the increased demand for biofuels accounted for
the increase in maize and soybean prices (Collins, 2008; Lipsky,
2008; Mitchell, 2008; Rosegrant, et al., 2008; van der
Mensbrugghe, 2006). The estimations of the impact of biofuels
on the price index of all food are differentiate in many studies.
According to Mitchell (2008) these differences depend largely
on how broadly the food basket is defined and what is assumed
about the interaction between prices of maize and vegetable oils
to prices of other crops such as rice through substitution on the
supply or demand side (Mitchell, 2008).
Until recently, the balance of consumption and production of
the energy obtained from ethanol was negative. The energy used
to achieve a unit of ethanol was higher than a unit of energy
provided by ethanol. In the U.S. ethanol production has
benefited from both the high protection and price support.
Biodiesel produced from plant materials has enjoyed a greater
subsidy than ethanol. Even with the higher subsidy, biodiesel
generally is not profitable because soy oil prices have risen to
the point that it cannot be economically converted to biodiesel
in most circumstances. Soybean and palm prices have moved
together and have increased proportionately more than corn
prices (Abbott et al., 2009).According to Schmidhuber (2006)
the U.S. corn ethanol has been competitive to crude oil on the
price of about 58 US $ per barrel. However, this breakeven
point reflects the instant corn prices; when raw material prices
change this value also change. Many studies argue that
diversion of the U.S. corn crop to biofuels is the largest biofuel
demand, hence the largest demand-induced price pressure
(Abbott et al., 2009; Mitchell, 2008; Schnepf, 2008; von Braun,
et al., 2008).
The problem is not how much corn used in ethanol production,
but it is how much soil withdrawn from food production to
produce raw materials. A rough estimate by Trostle (2008)
suggests that about 47.8 million acres were used to provide
biofuel feedstocks in the 6 major producing countries in 2007.
This would account for about 3-4 %t of arable land in these
countries (Trostle, 2008). In the US, rapid expansion of maize
area by 23 % in 2007 resulted in a 16 % decline in soybean
area, which reduced soybean production and contributed to the
75 % rise in soybean prices from April 2007 to April 2008
(Mitchell, 2008). In Europe, other oilseeds displaced wheat for
the same reason. Biofuels have contributed to substantially
depleting grain stocks, especially in the U.S. (Helbling et al.,
2008). On the other hand, there are studies which argue that
aditional farm income to be generated by biofuel production
may contribute to solutions of many problems, however biofuel
production competes with food production.
2.2.1.2 Rapid economic growth in developing countries
Since the early 1990s economic growth has been strong for
developing countries and since the late 1990s global economic
growth has been strong. In addition to these growth in Asia has
been exceptionally strong for more than a decade. With having
nearly 40 % of the world’s population, rapid economic growth
in China and India has provided a strong and sustained increase
in the demand for agricultural products (Trostle, 2008).
Urbanisation accompanied with economic growth has led a
dietary transition from traditional staplestowardhigher-value
foods like meat and milk. Many reports (Abbott et al., 2009;
Chand, 2008; Mitchell,2008; Schnepf, 2008; von Braun, et al.,
2008) on the crisis have specifically referred to changing
consumption patterns in China and India, particularly the rapid
growth in meat and vegetable consumption.
In China, between 1990-2006, per capita annual urban
household consumption of milk increased from 5 liters to 18
liters. However, the change is not limited to China. Likewise,
milk consumption increased by 20% in India, 30% in Nigeria
between 1990-2005. At the same time red meat consumption in
Brazil increased by 70% ( von Braun, 2008).
There are two aspects in changes in dietary patters. The first is
the increase in income per capita. The second issue is that there
is an increased consumption of livestock products that purely
by the independent decision of consumers. This can also be
caused by a shift in preference from lowly priced caloric foods
like cereal to more epensive caloric foods like meat and egg
which ultmately leads to the increase in the consumption of
cerealdue tothe price. The conversion ratio between feed to
meat varies widely depending on the type of meat. For example
int he U.S, approximately 7 kilograms of corn produces either
one kilogram of beef or pork, chicken is considerably lower
with one kilogram of corn producing 2.6 kg of chicken (ERS,
2008). This means that increased consumption of beef
represents increase in consumption of cereal several fold.
(Chand, 2008).
While China and India have received much attention, some
studies differ with the others on the impacts of China and India.
Abbott et al. (2009) argue that world prices are formed by those
who trade. China and India have both followed policies aimed at
agricultural self-sufficiency, and neither are major traders of
most agricultural commodities. However, China’s rapidly
growing oil imports have had an indirect effect on food prices
by impacting world prices for crude oil. Mitchell (2008) argued
that rapid income growth in developing countries has not led to
large increases in global grain consumption and was not a major
factor responsible for the large grain price increases.However,
it has contributed to increased oilseed demand and higher
oilseedprices as China increased soybean imports for its
livestock and poultry industry. BothChina and India have been
net grain exporters since 2000, although exports have
declinedas consumption has increased. Global consumption of
wheat and rice grew by only 0.8and 1.0 % per annum,
respectively, from 2000 to 2007 while maize consumptiongrew
by 2.1 % (excluding the demand for biofuels in the U.S.). This
was slower than demand growth during 1995-2000 when wheat,
rice and maize consumption increased by 1.4, 1.4 and 2.6 % per
annum, respectively.
China imported less wheat in 2000-2007 (33.8 million metric
tons) than it did in the preceding eight years (40.3 million mt),
and its rice imports also declined slightly from already low
levels (just over 5 million mt). Indian imports of wheat and corn
have also been negligible, and India is generally a net exporter
of rice. If China and India have contributed to the crisis, they
have done so through very indirect channels, such as by
influencing the demand for oil and global trends in stocks. The
one agricultural commodity group for which China and India
have sizably increased their demand is oilseeds, but this surge
began in the mid 1990s. This increased oilseeds demand from
Asia had had some effect on global markets. For example,
soybean imports within the developing world rose from 20.4 to
33.5 million metric tons from the mid 1990s to the present, a
trend which contributed to US farmers increasing their soybean
production area by over 11 million hectares. (Headey and Fan,
2008).
Headey and Fan (2010) argue that this research theme was
prominent prior to, and independent of the 2008 food crisis.
However, surging demand from China and India turns out not to
present any compelling linkages to the crisis. At the national
level both countries are largely food secure, so they rarely rely
on substantial food imports, except some oilseeds. It is true that
both countries, especially China, have experienced greatly
increased demand for energy and other minerals, but their
demand is by no means the only cause of rising oil prices and is
perhaps not even the main cause (Headeys and Fan, 2010).
2.2.1.3 Financial market speculation
Another factor that is said to have played a role in the current
crisis is speculation in financial markets. This explanation has
been widely discussed, but it is poorly understood and has been
only superficially researched, with the exception of a recent
Conference Board of Canada working paper (CBC, 2008) that
provides an authoritative review of the issue (Headey and Fan,
2008).
Commodities-related financial markets have expanded rapidly
and gained importance in recent years. The expansion of
commodity financial markets creates new opportunities as well
as challenges. On the one hand, financial markets can enhance
the liquidity, depth, and fluidity of commodity trades, which
helps price discovery. Commodity financial markets also
contribute to the efficient allocation of risk. Financial hedging,
as a form of insurance, can be used by commodity market
participants to reduce risks associated with excessive
commodity price volatility that complicate budgetary, financial,
and investment plans. On the other hand, the simultaneous
increase in prices and in investor interest, especially by
speculators and index traders, in commodity futures markets in
recent years can potentially magnify the impact of supply-
demand imbalances on prices. Some have argued that high
investor activity has increased price volatility and pushed prices
above levels justified by fundamentals, thus increasing the
potential for instability in the commodity and energy markets.
Despite the the difficulty of identifying speculative and
hedging-related trades, a number of recent studies seem to
suggest that speculation has not systematically contributed to
higher commodity prices or increased price volatility. Some
studies show that speculative activity tends to respond to price
movements, suggesting that the causality runs from prices to
changes in speculative positions (IMF, 2006). In addition, the
Commodity Futures Trading Commission has argued that
speculation may have reduced price volatility by increasing
market liquidity, which allowed market participants to adjust
their portfolios, thereby encouraging entry by new participants.
Finally, although many transactions are described as
speculative, they may in fact reflect a precautionary desire to
hedge exposures in the face of uncertainty (Helbling et al.,
2008).
The role of speculation in futures markets has been much
discussed as a cause for extreme shifts in agricultural and
energy prices from 2006 to 2008. The factors identified played a
more important role in price shifts than did speculation in
futures markets. This does not infer that speculation may have
played a role in the volatility, but it clearly was not the primary
cause as some imply. Markets tend to overshoot—both by going
up and going down—and additional funds in the commodity
markets may have accentuated these short-term impacts (Abbott
et al., 2009).
Several reports in the international media indicate that
professional speculators and hedge funds drive up the prices of
basic commodities in commodity futures following the collapse
of the financial derivatives markets. These dealers are reported
to be shifting investments out of equities and mortgage bonds
and ploughing them into food and raw materials. However, the
impact of such investments is expected to peter out in the long
run with fundamentals assuming a determining influence on the
market (Chand, 2008).
One of the principal reasons for concern over futures markets is
that their emergence has brought the increasing participation of
“noncommercial” participants in agricultural markets, or
speculators. However, causal linkages between futures and spot
prices are unclear (Headey and Fan, 2008).A reflection of
speculative and investor activity was the quadrupling of
thenumber of wheat futures contacts traded on the Chicago
Board of Trade from 2002 to2006. However, the increase in
futures contracts does not coincideclosely with the increase in
wheat prices, which raises doubts about the impact on prices.
The impact on prices is hard to quantify and most studies do not
find that such activitychanges prices from the levels which
would have prevailed without such activity (Mitchell, 2008
from Gilbert, 2007), however, they may change the rate of
adjustment to a new equilibrium whenfundamental factors
change (Mitchell, 2008).
Headey and Fan (2008) argue that speculation may be more a
symptom of underlying volatility than a cause of that volatility.
Also, many of the charges made against financial markets relate
to their efficient function more than their effect on spot prices
per se. Headey and Fan (2010) argue also that it is impossible to
discern causality in the context of futures markets, even from
time series econometrics, as futures-market variables represent
expectations of the future. Thus the usual Granger-causality
tests are potentially irrelevant, because expectations of price
rises at time t might be noncausally associated with higher
prices at time t + 1. However, whether or not futures market
activities were a cause of the crisis, they find it unlikely that
they were a driving force, if only because they have substantial
confidence in several of the more tangible explanations of the
crisis: oil prices, biofuels demand, a depreciating U.S. dollar,
and various trade shocks, in particular.
Finally, what evidence there is of impacts on spot prices is
largely anecdotal, and again, rarely indicative of causality. The
contract price volatilities of corn and wheat futures price
indexes have increased from 19.7% and 22.2% since 1980 to
28.8% and 31.4% in 2006–2007, respectively (Schnepf, 2008),
and both the price level and volatility formost agricultural
commodities have continued to rise in 2008. However, a study
of the emerging lack of convergence between cash and futures
prices has not identified any significant causal factor (Irwin et
al., 2007). Other analysts have suggested that agricultural
commodity markets are now playing a role traditionally
reserved for gold and other precious metals—a safe haven for
investors—but data from the U.S. Commodity Futures Trading
Commission (CFTC) suggest that the balance between long
(noncommercial) and short (commercial) positions has been
more or less maintained. Another charge is that securitized
foods have experienced more price volatility than
nonsecuritized foods (van Ark, 2008). Yet several
nonsecuritized foods have indeed experienced rapid price
increases,4 and the fact that the securitized commodities may
have been selected for futures markets precisely because of
some distinguishing characteristics—for example, rising or less
elastic demand, greater volatility, larger U.S. production—
suggests that simple comparisons of securitized and
nonsecuritized futures prices may not be valid in any case. In
summary, although futures markets may have exacerbated the
volatility in agriculturalmarkets, they are unlikely to be a
leading cause of the overall price surge, since there is little
evidence that these markets significantly influence “real”
supply and demand factors (Headey and Fan, 2008).
2.2.1.4 Depreciation of the USD
Another commodity-wide explanation of surging prices is the
depreciation of the U.S. dollar (USD) over the last years,
especially against the euro. The effects of dollar depreciation
became stronger when more currencies than just the euro began
to appreciate against the dollar and, starting about August 2007
when the U.S. Federal Reserve Bank began to loosen monetary
policy to fight impending recession, further weakening the
dollar. Since July 2008, the dollar has appreciated against the
euro and against many other currencies, especially those of
developing countries. This has contributed to rapid agricultural
commodity price declines in dollar terms, though less so in
other currencies (Abbott et al., 2009). The U.S. dollar
depreciated about 35% against the euro from January2002 to
June 2008 (Mitchell, 2008). The depreciation of the USD can
clearly account for the rise in dollar-denominated food prices in
an arithmetical sense, cutting off 20-30% of the nominal dollar
increase in the case of conversion from USD to Euros (Headey
and Fan, 2008).
The depreciation of the dollar has been shown to increase
dollar-denominated commodity prices with an elasticity of
between 0.5 and 1.0 (Gilbert, 1989). Shane and Liefert (2007)
argues thatthe elasticity should beless than 1.0, because the
exchange rate does not pass-through completely in
manycountries due to policies.If the elasticity istaken as the
mid-point of the range from 0.5 to 1.0, the increase in food
prices due to thedecline of the dollar would have been about 20
percent (with an elasticity of 0.75) between January2002 and
June 2008 (Mitchell, 2008).
TheU.S. dollar exchange rate affects commodity pricesbecause
most commodities—in particular, crude oil, preciousmetals,
industrial metals, and grains such as wheatand corn—are priced
in U.S. dollars. The effective dollardepreciation seen over the
past few years therefore has madecommodities less expensive
for consumers outside the dollararea, thereby increasing the
demand for the commodities (Helbling et al., 2008). As Abbott
et al. (2009) discuss, when the dollar weakens, agricultural
exports (particularly grain and oilseeds) also increase, ceteris
paribus. Abbott et al. (2009), find that the dollar depreciated
22% and the value of agricultural exports increased 54% from
2002 to 2007. Considering that the US is a large country in
international agricultural markets, especially in the case of
wheat, corn and soybeans, depreciation of the USD should lead
to higher prices in the US, but lower prices in the rest of the
world. Abbott et al. also show that in the current crisis the
divergence between the dollar and many other currencies has
been quite stark compared to previous increases in nominal
dollar-denominated food prices.
When the U.S. dollar declines in value in international exchange
markets relative to the currency of. export competitors of the
U.S. (e.g., Canada, Australia, or the EU) or importing nations
(e.g., Japan, Taiwan, etc.), it makes U.S. export products
cheaper and, therefore, more competitive. Since January 2002,
the U.S. dollar has lost over 44% of its value against the EU’s
euro and the Australian dollar, and nearly 37% against the
Canadian dollar.A key result of the declining value of the U.S.
dollar has been a dramatic surge in U.S. exports of agricultural
products, particularly of bulk commodities. Record exports in
the face of historically high commodity prices seems somewhat
counterintuitive. However, the decline in the foreign exchange
value of the U.S. dollar has been so dramatic that, in some
cases, it has completely offset the rise in commodity prices,
thereby making U.S. grains and oilseed very attractive. The
record shipments of grains and oilseeds have helped to draw
down U.S. stocks and fuel higher commodity prices (Schnepfh,
2008).
On the supply side, the declining profits in local currencyfor
producers outside the dollar area have put price pressureson the
commodities. A decline in the effective value ofthe dollar also
reduces the returns on dollar-denominatedfinancial assets in
foreign currencies, which can make commodities a more
attractive class of “alternative assets” toforeign investors.
Finally, dollar depreciation canlead to monetary policy easing
and lower interest rates inother economies, especially in
countries whose currenciesare pegged to the dollar, which also
raises the demand forcommodities (Helbling et al., 2008).
Causality is difficult to sort out since both the exchange rate
and commodity prices are determined simultaneously by
macroeconomic performance and policy in the United States and
abroad. Macroeconomic forces, such as global recession and
financial crisis, are critical to explaining the recent evolution of
the dollar, crude oil prices, and agricultural commodity prices,
although market specific factors also matter in each case
(Abbott et al., 2009).
2.2.1.5 Low Interest Rates
Another explanation is that low real interest rates, especially in
the US, have caused a general price increase in a wide range of
commodities. With the rapid expansion of commodity financial
markets in recent years, many commodity prices are more
directly exposed to various macrofinancial shocks. The main
reason is that spot prices of a growing number of commodities
are determined in exchange-based trading. Although such
trading has long existed for some agricultural commodities such
as grains, it has recently become more prevalent for other
commodities. Moreover, with many futures contracts settled in
cash rather than through the delivery of the underlying
commodity, investors outside the commodity business can now
use commodities to diversify their portfolio, thereby more
closely linking futures markets for commodities with other
financial markets. This has opened up new opportunities for
market participants but also led to challenges (Helbling et al.,
2008).
Low interest rates increase the demand for storable
commodities, increase the desires of firms to carry inventories,
and encourage speculators to shift out of treasury bills and into
commodity contracts. All three of these mechanisms work to
increase the market price of commodities, in what is often
known as “carry trade.” It is questionable, however, whether
this explanation is actually consistent with the evidence. One
inconsistency is that agricultural inventories are low rather than
high. Moreover, the diversion of assets from treasury bills and
the like to commodities may have influenced agricultural
futures prices,but the jury is still out as to whether this has had
a substantial effect on spot prices (Heady and Fan, 2008).
Low interest rates can spur aggregate demand, which would
increase the demand for commodities. Besides this
growthrelated effect, the favorable liquidity conditions
associated with low interest rates also tend to increase both
asset demand for commodities (partly because low-yielding
treasury bills are less attractive) and incentives for holding
commodity inventories by lowering holding costs, everything
else being equal (Helbling et al., 2008).
2.2.2 Supply-Side Factors
Increased demand alone cannot explain the large and persistent
rise in commodity prices seen in recent years.Supply factors
also play a role. Slow supply responses have amplified price
pressures. The slow supply response in the initial phases of this
primarily demand-driven boom did not come as a surprise, given
limits to production increases in the short term. Excess demand
is accommodated by inventorydrawdowns while prices increase
- a pattern that was seen in many commodity markets in recent
years. Because the demand for commodities tends to be price
inelastic - that is, a large change in the prices of commodities
leads to only a small change in the demand for them, especially
in the short term - the feedback effects of rapid price increases
on demand during these phases tend to be limited, which
partlyexplains the large spikes often seen in commodity
markets. Besides initial supply-response problems, however, a
new key feature that has emerged in the current broad-based
commodity market boom is the increasingly prominent role of
the slow supply adjustment to increased demand. Such
structural problems have been particularly acute in the case of
oil, where capacity growth in response to persistently higher
prices has been disappointing in recent years. And, as the
pessimistic prospects for capacity growth have seemed more
certain, these expectations have further fueled price pressures.
This was particularly the case in 2007. Key handicaps have been
the declining average size of fields and the technological
challenges involved in the increasing reliance on exploiting
nonconventional fields. These supply rigidities, together with
soaring demand for oil equipment and services, have pushed up
costs dramatically (Helbling et al., 2008).
Sharply risenoil prices have a direct impact on cereal prices,
especially on wheat and corn prices in several ways – through
an increase in prices of fertilisers and agriculture chemicals
used as inputs, through an increase in the cost of operation of
farm power and machinery, and through an increase in transport
cost and also an indirect impact through substitution
effects.This explanation has no critical weaknesses, even
thought there are several authors who expect the effects of
rising oil prices on food prices to be more delayed and to have a
larger impact via biofuel demand (Heady and Fan, 2008).
Weather-related production shortfalls offer another commodity-
specific explanation for world cereals price rises, specifically
for wheat (Headey and Fan, 2008), especially in Australia, U.S.,
EU, Canada, Russiaand Ukraine. Australian wheat production
was 50- 60% below trend growth rates in 2005 and 2006; there
were also moderately poor harvests in US, Russia and Ukraine.
The weakness of this explanation is that it only explains wheat
prices (Heady and Fan, 2008).
Another supply-side explanation is decline of stocks, which is
traditionally associated with increased sensitivity to shocks;
stocks of all major cereals declined prior to the price surge.
This might constitute a crop-specific explanation, especially
given that stocks have declined for maize, wheat and rice. The
weaknesses of this explanation are that netting out China makes
the decline in stocks less dramatic and unless stock declines
result from policies, declines only represent the effects of other
factors (Heady and Fan, 2008).
Export bans and restrictions which are imposed by Argentina,
India, Kazakhstan,Pakistan, Ukraine, Russia and Vietnam fueled
the price increases by restricting access to supplies.Price rises
for rice were preceded by export restrictions in countries that
account for 40% of global rice exports. The weaknesses of this
explanation are that wheat, maize and soybean price rises
generally preceded restrictions, and the biggest players did not
impose restrictions (Heady and Fan, 2008).
2.2.2.1. Rising Oil Prices
The increase in prices of crude oil, gas and such sources of
energy affects almost all sectors. It has a direct impact on cereal
prices in several ways – through an increase in prices of
fertilisers and agriculture chemicals used as inputs, through an
increase in the cost of operation of farm power and machinery,
and through an increase in transport cost. Between 2004 and
2007, crude oil prices increased by 89 % (Chand, 2008). Higher
oil prices have also had an important effect on other
commodities, not only through the traditional cost-push
mechanism (because oil is used as an input in agriculture and
the production of metals such as aluminum) but also through
substitution effects. For example, natural rubber prices have
risen because its substitute is petroleum-based synthetic rubber.
Uranium price increases have been driven by demand for
nuclear energy, whereas coal prices have recently risen because
of utilities’ switching from more expensive fuel oil to coal for
power generation. And, of course, biofuels are substitutes for
gasoline and diesel at the margin (Helbling et al., 2008).
Historically, energy and agricultural markets were largely
independent, each influenced by their respective supply and
demand situations. That is no longer the case. Since 2006,
energy and agricultural markets became closely linked as
biofuels production surged. Ethanol and biodiesel were linked
as energy substitutes for gasoline and diesel, and usage of crops
for these biofuels became large enough to influence world
prices (Abbott et al., 2009). Energy and agricultural prices have
become increasingly intertwined. With oil prices at an all-time
high of more than US$100 a barrel and the U.S. government
subsidizing farmers to grow crops for energy, U.S. farmers have
massively shifted their cultivation toward biofuel feedstocks,
especially maize, often at the expense of soybean and wheat
cultivation (von Braun, 2008). The long-run association
between the prices of crude oil and food can be seen fromFigure
2.1by Chand (2008) using IMF and USDA’s data. This presents
the index of food and crude oil prices with base 2005 = 100 and
shows that fluctuations in crude oil prices are much higher and
bigger than fluctuations in food prices.
Source: Chand, 2008
Figure 2.1. Crude Oil Price Index and Food Price Index (base
2005=100)
Food prices are not affected by small fluctuations in crude
prices, but a large and consistent decrease or increase exerts a
very strong influence on food prices. This is evident from the
correlation between crude and food prices in different phases of
the trend in crude prices. When crude prices fluctuated around a
flat trend then food prices followed an almost independent
trend, affected by other factors. This was in the period 1987 to
1999 (with a correlation of 0.244). However, when crude prices
followed a sharp decline for a couple of years, then food prices
also declined, though less sharply than crude prices (1980 to
1986). Conversely, when crude oil prices rise sharply for couple
of years, food prices also increase sharply as is evident from the
correlation for the period 2000 to 2007, which was as high as
0.95. The impact varies across commodities, regions and
farming practices (Chand, 2008).
Mitchell (2008) argues that high energy prices have contributed
about 15-20% to higher U.S. food commodities production and
transport costs. Production costs per acre for U.S.
corn,soybeans and wheat increased 32.3, 25.6 and 31.4 %,
respectively, from 2002 to2007.However, yield increases during
this period reduced the per bushel costincreases to 17.0, 24.1
and 6.7 %, respectively. The contribution of the energy
intensivecomponents of production costs—fertilizer, chemicals,
fuel, lubricants andelectricity—were 13.4 % for corn, 6.7 % for
soybeans and 9.4 % forwheat per bushel. The production-
weighted average increase in the cost of productiondue to these
energy-intensive inputs for these crops was 11.5 % between
2002 and 2007. In addition to the increase in production costs,
transport costs also increased due tohigher fuel costs and the
margin between domestic and export prices reflect this cost.
Thus, the combined increase inproduction costs and transport
costs for the major U.S. food commodities—corn, soybeans and
wheat—was at most 21.7 %, and this amount likely overstates
the increase, because transport costs are not estimated
separately. It therefore seems reasonable to conclude that higher
energy and related costs increased export prices of major U.S.
food commodities by about 15-20 % between 2002 and 2007
(Mitchell, 2008).
Finally, the energy used in agricultural production is mostly oil-
related, and oil prices have risen faster than the prices of other
energy sources. Moreover, US food production– which
dominates world food production and export markets– is
especially oil-intensive. Oil prices also affect the prices of
fertilizers and other chemicals used in crop production. For
wheat and corn, fertilizer prices alone account for over a third
of total operating costs and 15-20% of total costs (Headey and
Fan, 2008). Factoring in the rising costs of fuel, fertilizers and
other oil-related farm productions, Headey and Fan (2008)
estimate that oil prices increased the costs of US production of
corn, wheat and soybeans by 30-40% over 2001-2007 relative to
a baseline scenario in which oil-related prices only increased by
the inflation of the US GDP deflator. These fuel-based cost
increases correspond to about 8% of the observed corn price
increases, 11% of soybean price increases, and about 20% of
wheat price increases.
2.2.2.2 Weather-Related Production Shortfalls
Weather shocks offer another commodity-specific explanation
for World cereals price rises, specifically for wheat (Headey
and Fan, 2008), especially in Australia, U.S., EU, Canada,
Russiaand Ukraine (OECD-FAO, 2007).
Global grain production declined in both 2005 and 2006 —
primarily due to declining global productivity — cutting into
existing stocks and reducing exportable supplies. A major
tipping point occurred in 2007 when Australia — traditionally a
major wheat and barley exporter — suffered a second
consecutive year of sharply lower grain production due to
drought. With stocks already low, Australia’s 2007 grain
exports were dramatically curtailed for a second year
(Schnepfh, 2008). The back-to-back droughts in Australia in
2006 and 2007 reduced grain exports by an average of 9.2
million tons per year compared with2005 (Mitchell, 2008).
Meanwhile, grain crops in the U.S., Canada, EU, Eastern
Europe, and some countries of the former Soviet Union were
also reduced by weather conditions (Schnepfh, 2008). Poor
crops in the EU and Ukraine reduced their exports by an
additional 10million tons in 2007 (Mitchell, 2008). In the EU,
declining grain supplies forced livestock producers to import
substantial volumes of wheat and other feed grains for feed
rations. As a result, the EU switched from its traditional status
as a major net exporter of grains into a net importer in 2007.
The cumulation of these events severely drew down global grain
supplies (Schnepfh, 2008).
Theproduction shortfall was most significant in wheat, where
global production declined 4.5percent in 2006 and then
increased only 2 percent in 2007. Global oilseed production
rose5.4 percent in 2006/07 and declined 3.4 percent in 2007/08
(Mitchell, 2008). Australian wheat production was 50-60%
below trend growth rates in 2005 and 2006. The U.S. also
experienced a poor harvest in 2006, some 14% lower than the
previous year, and more modest declines were seen in Russian
and Ukrainian production. However, a closer inspection of the
data suggests that this intuitively attractive explanation is not as
convincing as it first appears. The main problem is that annual
production shortfalls are a normal occurrence in agricultural
production in general and in wheat production in particular.
Global wheat production declined by 5% in 2006/07, but it also
declined by 11% in 2000/01 and 6% in 1993/94. The U.S. wheat
production fell by bigger margins in 1991/92 (27%), 2001/02
(13%) and 2002/03 (18%), and a closer inspection of Australia’s
wheat production since 1990 shows other years when harvests
were well below trend: by 51% in 2002, and by 50-100% from
1993 to 1995. Moreover, the output declines seen in several
countries in 2007 were offset by large crops in Argentina,
Kazakhstan, Russia and the U.S., whose wheat exports increased
by around 13% (or an additional 7.5 million mt) compared to
those in 2006. Therefore, while overall global grain production
declined by 1.3% in 2006, it then increased 4.7% in 2007
(Headey and Fan, 2008).
Thus theproduction shortfall in grains would not, by itself, have
been a major contributor to theincrease in grain prices. But
when combined with large increases in biofuels production,land
use changes, and stock declines it undoubtedly contributed to
higher prices (Mitchell, 2008).
2.2.2.3Decline of Stocks
Another supply-side explanation is stock declines, which could
influence price volatility by determining the stability of supply.
This might constitute a crop-specific explanation, especially
given that stocks have declined for maize, wheat and rice.
World stocks for maize, for example, declined from 26% of
usage over 1990-2000 to just 14% of consumption from 2005-
2008, but excluding China from the global figures suggests that
world stocks remained the same over the two periods, at just
12%. Nevertheless, a large number of major producing and
exporting countries have incurred substantial stock declines in
recent years (Headey and Fan, 2008). The period from 1998 to
2005 was one of high stocks and low prices. The world was
reducing stocks as production dropped below usage in most of
those years. By 2006, excess grain and oilseed stocks had been
eliminated. Low world production in 2006 and 2007, in
combination with on-going food demand growth and large added
demands for biofuels, drove global stocks to extremely low
levels by mid-2008 with expectations of continued low stocks
until 2009. Going into the spring of 2008, expectations were for
dangerously low stocks. High prices helped stimulate
production with larger area and greater use of inputs. Over time,
high prices also reduced world usage. Revisions in supply and
use estimates since June 2008 have generally increased world
output and reduced usage (Abbott et al., 2009).
Recent data and strong historical covariance between prices and
stocks superficially suggest that stock declines could
substantially account for recent price movements. However,
there are some significant caveats to this conclusion. Most
importantly, declining stocks might simply reflect increased
demand or reduced production levels. Biofuel production offers
a promising explanation for declines in maize stocks, and bad
weather, stagnating production growth and low prices seem to
account for the almost pervasive decline in wheat stocks
(Headey and Fan, 2008). Headey and Fan (2008) argue that for
stock declines to be causally related to the current crisis, they
must therefore be associated with exogenous policy decisions,
or other forces. And they see three such policy decisions that
could support a causal relationship. First, it may be that stocks
were so high and prices were so low prior to 2000 that there
appeared to be a need to reduce stocks. Second, the increasing
use of just-in-time inventory systems may have led to lower
stocks. These two explanations are plausible but generally
difficult to prove.
Headey and Fan (2008) also argue that stock declines are
consistent with rising prices but not as causally convincing as it
might appear at first glance, partly because they are a symptom
of deeper causes, and partly because their effects on prices are
enacted through interactions with other factors. It is also
possible that excessively high stocks in the 1990s (and before
the 1974 crisis) were actually an underlying cause of the crisis:
The use of stocks to satisfy increasing demand may have
delayed price rises that would otherwise have provided a
stronger signal of rising demand. In terms of policy
implications, it is therefore not altogether clear that increasing
stocks once more would prevent further food crises.
2.2.2.4 Export Bans and Restrictions
Export bans and restrictions fueled the price increases by
restricting access to supplies.A number of countries have
imposed export restrictions or bans on grainexports to contain
domestic price increases. These include Argentina, India,
Kazakhstan,Pakistan, Ukraine, Russia and Vietnam (Mitchell,
2008). Since late 2007, several traditional wheat and rice
exporting countries — in an effort to ensure domestic food
availability and temper rising internal inflation — have
instituted policies designed to limit exports of domestic
supplies. These policies, albeit implemented to dampen internal
prices for domestic consumers, have had exactly the opposite
effect on international market prices, pushing them higher than
supply and demand conditions would otherwise dictate by
limiting access to available supplies by international buyers
(Schnepfh, 2008).
For rice, in particular, export restrictions are a very compelling
explanation, first because a number of important exporting
countries that imposed restrictions, and second because rice is
much more thinly traded relatively to other staples, with only
around 7% of global production being traded over the last five
years (Heady and Fan, 2008). In the international rice market,
the traditional exporters including Vietnam, India, China, and
Egypt, (the world’s second-, fourth-, sixth-, and eighthleading
rice exporters in 2007), along with minor exporter Cambodia,
have all set in place policies to limit exports. The combined
effect of these bans is to remove over a third of available export
supplies from world markets and to drive international rice
prices sharply higher (Schnepfh, 2008).
A closer look at the timing of export restrictions and rice price
increases also suggests causality. From August 2005 until
November 2007, rice prices increased steadily and significantly,
by about 50% (in real terms) from an all-time low in 2005. In
November of 2007, India imposed the first major export
restriction. This appears to have been the turning point for rice
prices. From November 2007 to May 2008, rice prices increased
by 140%, despite an all time production high in 2007, the
complete absence of any significant increase in demand, and
fairly stable rice stocks (with the exception of non-trading
China). In early 2008, panic ensued as the rise in other
commodity prices began to attract much more concern in Asian
markets. This prompted further export restrictions from
Vietnam, Cambodia and Egypt, and precautionary rice purchases
by the Philippines, which imported 1.3 million metric tons of
rice in just the first four months of 2008 (an amount that
exceeded their entire import bill of 2007). This surge continued
until May, when Japan released 200,000 tons of rice to the
Philippines. Prices fell almost immediately. This was followed
by further price declines after Cambodia lifted its export ban in
June. Hence, it appears that the remarkable and very costly
surge in rice prices in 2008 was largely due to the traders’
reactions to export restrictions, plus hoarding by a number of
important players in what was already an unusually thin market
(Heady and Fan, 2008).
Similar action in the international wheat market includes both
Ukraine and Argentina which, in the spring of 2007, initiated
wheat export restrictions in efforts to control food price
inflation. Pakistan placed taxes on wheat exports. By late
February 2008, Kazakhstan officials set in place policies to
slow their country’s wheat export pace(via higher custom
duties), also due to declining supplies. By mid-April,
Kazakhstan had converted its export slowdown into an outright
ban. According to Schnepfh (2008) Argentina’s government
policy of banning wheat and beef exports, slowing corn exports
through procedural barriers at customs, and heavily taxing
exports of soybeans is particularly noteworthy for three reasons.
First, the export controls resulted in a nationwide farmers’
strike whereby producers refused to bring to market any
agricultural products. Second, although the strike was
temporarily suspended for 30 days starting on April 3, 2008, in
an agreement between farmers and government that essentially
left the export controls in place, the uncertainty surrounding
Argentina as a reliable export supplier resulted in a substantial
amount of purchase contracts being diverted to U.S. suppliers.
Thus, already huge U.S. export numbers were further bolstered
by the shift in demand from Argentinean to U.S. commodities.
Third, Argentina’s strict export controls have had a major
impact on that country’s agricultural prospects, at least in the
short run, as most market analysts are now predicting a
significant decline in Argentina’s planted area for wheat in
2008 (Schnepfh, 2008).
Similar outcomes were observed in the 1974 crisis as a result of
export restrictions on soybeans, wheat, rice and fertilizers. The
tragedy of these restrictions is that they effectively sacrifice
international price stability for the sake of domestic price
stability, as Johnson (1975) noted after the 1974 crisis (Heady
and Fan, 2008).
2.2.3. The Consequences of The Crisis
A number of factors suggest that the recent surge in food prices
had-an may still be having- a severe impact on the poorer
populations of the world, perhaps even throwing more than 100
million people into poverty (Headey and Fan, 2008 from Ivanic
and Martin, 2008; World Bank, 2008). All assumptions and
predictions concerning the concequences of sharply rising food
prices require much closer examination and often significant
qualification. The group most vulnerable to rising food prices is
generally the urban poor, but this group is also far more
vociferous than the rural poor (Headey and Fan, 2008 from
Bezemer and Headey, 2008). Thus, protests may be evidence of
suffering, but not of net suffering: price changes always create
winners and losers, and judging who is who requires accurate
data and careful analysis at both the macro and micro level
(Heady and Fan, 2008).
Several studies estimated the impacts of rising food prices, but
according to Heady and Fan (2010) they often generated
unconvincing results, and most were limited by the absence of
general equilibrium effects, country-specific price changes, and
other relevant shocks, such as rising fuel prices. Moreover,
judging who is negatively affected requires accurate data and
careful analysis of food dependency, poverty/vulnerability, and
price changes at both the micro and macro levels. A great deal
of progress has already been made especially in micro-level, but
a large gap still exists between micro- and macroassessments of
the consequences of the crisis. A further distinction must also
be made between the short and long terms. In the short term the
adjustment costs of responding to rapid price changes may be
prohibitively high and painfully slow. But even in the long term
the ability of the poor to make adjustments depends on their
access to productive assets and on national and international
policies aimed at raising agricultural output or successfully
pursuing other strategies to increase food security (Heady and
Fan, 2010).
Ideally, a full assessment of the short-term impacts of the crisis
on poverty requires consideration of both macroeconomic
impacts and transmissions, as well as household and
intrahousehold effects, for both food and fuel price increases.
However to partially bridge this gap, Heady and Fan (2010)
analyze the Global Information and Early Warning System
(GIEWS 2009) dataset on food prices in developing countries,
the impacts on farmers remain unclear.
OECD (X) reports that the impact of high food prices on
developing countries depends on the interplay of various
factors. In general, commercial producers of these commodities
will benefit directly from higher prices. Livestock producers, on
the other hand, are squeezed by both higher feed and energy
costs and relatively flat prices. For farm households producing
mainly for their own consumption or for local markets insulated
from price fluctuations on national and international markets,
the impacts will be mitigated. But for the urban poor and the
major food importing developing countries, the impacts will be
strongly negative as an even higher share of their limited
income will be required for food. Each 10% increase in the
prices of all cereals adds nearly USD 4.5 billion to the
aggregate cereals import bill of those developing countries that
are net importers of cereals.
The impact of high agricultural commodity prices on developed
countries is relatively modest, overall. The agricultural
commodity price component of final food product prices is
relatively small (very probably less than 35%), as is the
proportion of disposable income spent on food (For many OECD
countries its between 10 to 15 %). Of course these averages
mask much more significant impacts on lower income
consumers who spend a larger share of their expenditure on
food. In addition, and to the extent that high prices persist and
hence do not reduce the future rate of inflation, indirect
economic impacts might also be important (OECD, 2008).
2.2.3.1. Macroeconomic impacts
Many studies on the impacts refer solely to food prices, but any
comprehensive assessment of current poverty trends needs to
incorporate changes in a range of prices, including fuel costs
and fertilizers. By effecting transport costs, exchange rates,
foreign reserves, and domestic inflation oil prices have a
pervasive effect on a country’s vulnerability to the recent crisis.
That is why the most relevant macroeconomic assessments of
the crisis incorporate the effects of rising oil prices (Heady and
Fan, 2010).
This section reviews the studies which cover the
macroeconomic impacts such as Headey and Fan’s (2010)
review of impact studies; Dawe’s (2008) study on the strength
of transmission from international to domestic prices and IMF
report (2008) and Aksoy and Ng’s (2008) study on the impact of
rising food prices on import bills.
2.2.3.1.1. Import bills
Aksoy and Ng (2008) calculate both food and general
agricultural net import bills for low-, middle-, and high-income
countries. While doing this, they disaggregate within each
category by oil exporters, conflict states, small islanders, and
“normal” countries. According to their study, once the three
special groups are omitted, the typical “normal” low- and
middle-income country has gone from being a net food importer
in 1980/1981 to being a net food exporter in 2004/2005.
However, Africa still contains a large number of oil exporters
and conflict states, as well as other exceptions, meaning that
most African countries (35 of 47) are still net importers of food,
even though most are also net exporters of all agricultural goods
(32 of 47). Moreover, only six low-income countries have food
deficits that are more than 10 % of their imports, so most net
food importing developing countries are marginal net food
importers. Aksoy and Ng (2008) also identify countries with
considerable potential to switch from being net exporters of
non-food agricultural products to net exporters of food.This
switch is much less relevant to the short-term impacts of the
crisis, since switching from cash crops to food production may
be time-consuming and costly. According to Aksoy and Ng
(2008) the severity of food dependence is often overstated.
One might regard the rise in oil prices as a more serious threat
to macroeconomic stability in developing countries (Headey and
Fan, 2010). According to IMF (2008), oil import costs are 2.5
times larger than food imports for low-income countries and
twice as large for middle-income countries, so the impact of
commensurate price increases is much greater for oil. The study
argues that the absence of policy responses, the impacts of oil
prices are considerably larger than those of increases in food
prices. It estimates that for 33 net food-importing countries with
available data, the adverse balance of payments impact of the
increase in food prices from January 2007 to April 2008 is 0.5
% of 2007 annual GDP. During the same period, the impact of
the increase in oil prices in 59 net oil-importing countries is
estimated to be 2.2 % of GDP (IMF, 2008).
Finally, although we have no data on overall terms-of-trade
movements that factor into other commodities, we know that
many net exporters of other minerals have also benefited from
rising commodity prices to some extent, as have countries that
are net exporters of labor to oil-producing countries (Headey
and Fan, 2010).
2.2.3.1.2. Exchange rate movements and foreign reserves
As noted before, a number of currencies have appreciated
against the U.S. dollar, the currency in which food and oil
exports prices are usually denominated. The euro area and the
West African franc zone (which is pegged to the euro) have
appreciated against the U.S. dollar by 80 % from 2002 to 2008.
Thus the adverse effects of rising commodity imports for many
West African countries should, all else being equal, be limited
from a macroeconomic perspective. In contrast, the Central
American and Caribbean area, which consists of currencies
largely pegged to the U.S. dollar, and quite a large number of
other countries around the world have experienced a stable rate
of exchange with the dollar, while a few countries have
experienced depreciation.In either case it is clear that although
most countries have appreciated against the dollar, considerable
variation remains in terms of countries’ vulnerability to rising
dollar-denominated food and oil prices (Headey and Fan, 2010).
By using commodity-specific, trade-weighted U.S. dollar
exchange rate index of USDA (2008), Headey and Fan (2010)
calculate that relative to dollar-denominated prices, export
prices denominated in the currencies of other exporters of
maize, wheat, and rice have declined by about 15–17 % from
2002 to 2008. According to them, the relationship between
dependency on U.S. food imports and exchange rate movements
should be investigated, because countries that are both
dependent on the United States and have not benefited from
appreciation against the dollar may be particularly vulnerable in
a macroeconomic sense. Since the United States is the only
highly dominant cereal exporter in the world, it is therefore
worth investigating the relationship between dependency on
U.S. food imports and exchange rate movements against the
U.S. dollar. Such an analysis suggests that the regions that are
most dependent on the United States as a source of food imports
are Central America, the Caribbean, and some of the more
northern countries of South America. A few other countries and
regions are fairly dependent on the United States for food
imports, but many such countries are either wealthy or
experienced large real appreciations against the U.S. dollar.As
for foreign exchange reserves, the International Monetary Fund
has enumerated the months of imports as of the first quarter of
2008. Disconcertingly, the Caribbean and Central American
countries appear to be highly vulnerable in this dimension as
well. This evidence therefore suggests that, so far, it is the
Central American and Caribbean countries that have been most
vulnerable to rising U.S. dollar–denominated export prices
because of their dependence on U.S. exports and their lack of
any major compensating currency movements. Another indirect
indicator that countries are suffering as a result of rising prices
is the change in cereal imports in 2007 and 2008. USDA data
suggest that most developing regions experienced declines of
10–20 % in 2007 or 2008 (Headey and Fan, 2010).
2.2.3.1.3. Transmission in domestic markets and the impact on
inflation
The steps of the transmission of rising international prices into
domestic markets are the conversion of dollar-denominated
international prices into local currency prices and domestic
policies that alter the local price of foods. However, the effects
of these factors are generally bundled together as a residual
which reflects a range of other factors. Thus it may be possible
that the change in domestic prices is very high, even though
there is little transmission of international prices (Heady and
Fan, 2010).
Heady and Fan (2010) argues that both commodity-specific
prices and consumer price indexes can be used to assess to what
extent the international prices be transmitted to domestic
markets. According to them, commodity-specific approaches are
useful for assessing transmission proper, including the impacts
of exchange rate movements. In principle, the food consumer
price index (CPI) is more comprehensive and should be a better
indicator of welfare costs, especially when it is deflated by the
non-food CPI to look at the terms of trade for food, or real
food-price trends.
FAO’s study (Dawe, 2008) on the recent crisis reanalyzes the
extent of price transmission in seven large Asian countries from
the fourth quarter of 2003 to the fourth quarter of 2007, a period
which admittedly does not capture the full international price
increase, especially in rice. Overall transmission—measured as
the ratio of LCU (local currency units) denominated retail price
changes to U.S. dollar-denominated export prices—varied
considerably among the seven countries. In India, the
Philippines, and Vietnam, the pass through was just 6–11%, but
in the remaining countries it was 41–65%. Interestingly,
movements in the real exchange rate explain more than half of
the price difference between U.S. dollar-denominated export
prices and LCU denominated local currencies, the main
exception being Bangladesh. Dawe (2008) also found that
transmission of wheat prices appeared to be partial in India and
Indonesia, but fully transmitted in Bangladesh (Dawe, 2008).
Price changes ca be determined from recent trends on inflation
such as the food inflation (WHO, 2008) for 2007 and the
beginning of the year 2008. Other researchers such as Headey
and Fan (2008) base their data regionally and with it to show
non-food inflation. The results that they present is from
estimates on householf food expenditures. To determine food
price change they calculate the difference betweent food and
non food inflation. Food inflation in all aread was 9.5% to 18%
which is a very high percentage. This is not an accurate
representation however. Averagely, Africa has experienced
lower food inflation in comparison to non food inflation
compared to other continents. To extract the inflation data from
the the regions that are constitute Outliers, the reserchers
grouped smaller regions in the ecompasing area and used
inflation data from the year 2005 to 2008. For example,in one
case they used data from 5 key expoters in Africa. The data
derived from this was consistent to estimates made earlier. The
first consistency was that price rose in countries with domestic
issues like weather probles and conflict; those countries were
Kenya, Myanmar and Ethiopia. Ghana is considered an outlier
country but its also a country whose rise in transmission tell a
different story. Although this country imports basic cereal like
wheat, rice and maize, the dietary patterns are very diverse and
the ghanaian currency has experienced appreciation against the
universally accepted Dollar. For Ghana as a country, the
inflation that it experiences is due to large remitances, oil
prices and government spending. Yemen is a perfect example of
a country that is price increase sensitive since it is almost
entirely dependent on imports. A total of five mineral exporting
countries faced inflation die to rising export earnings and what
is commonly refered to as the Dutch Disease. Nigeria is an
example of a country which has non food inflation passing
specific food inflation. Dependence on oil and rice imports and
reduced chances of opportunities of exchanging currencies have
caused inflation in some Ssouth Asian countries. Central Asian
countries have also suffered due tothe Dutch Disease. Low
earning countries in central and caribbean countries have also
experienced high inflation naturally. In african countries, the
selected groups have recorded iflation of between 6-8 percent
per year with West Africa registering the lowest inflation
perhaps due to being tied closely to the Euro. This means that
althoughh the African countries are vulnerable to economic
dynamism, food inflation is cushioned by the fact that many
African Households are net food buyers which means that the
actual food prices have not had such an impact in Africa
(Headey and Fan, 2008).
The buffer that is provide by the depreciation of the dollar
currency is not permanent when it comes to the larger price
transmissions. There is a school of thought that suggests that
the Euro is highly overvalued which suggests that the dollar
might be on the rise soon. The result of this is that ultimately
west African countries will have a faster rate of price
transmission. Secondly, transmissions may be low due to
government involvement which will be most likely discourage
price rises. The World Bank (2008) shows that as many as 84
countries have reduced significantly the taxes imposed on food
while another 30 countries have put up export restrictions in
various forms. The Imternational Monetary Fund estimates that
these action have reduced signifintly the price of food and fuel.
It is estimated that the iposed taxes and subsidies transfer the
burden from the markets to the government and in fact, this
burden is estimated to incresed the percentage deficits by at
least 1 percent. Faulure to do this means that government would
have to cut back on other exenditures that are important on for
the poor such as health expenditure. Whether the mechanisms
that are employed by the governments through taxes, subsidies
and export restrictions are to absorb price rises is not clear but
due to its importance, it merits further investigations. The
second aspect that is noteworthy is the tax and transfer
programs implications on distribution.Essama-Nssah (2008)
give a clearer picture with a conceptional analysis and review .
Arndt et al. (2008) gives an analysis of the implication of
rising food prices in Mozambique. Due to the complexity of
transmission mechanisms, the full transmission of the
international prices is time consuming. Whilst food prices can
be imported, food exporters also experience increase in prices.
For example,in a country like Uganda, the increase in food
prices is not due to diersity in dietary patters but due to rising
food prices in neighbouring price in countries like Kenya and
Tanzania. The reason for this is the fact prices in neighbouring
countries put pressure on prices of the local markets (Benson,
2008). It is worth noting that not all regions within a country
are affected the same. It is often the case that rural areas are not
affected as much as urban areas when in comes to international
price changes (Codjoe et al., 2008; Ulimwengu et al., 2008).
This further shows that there is need to conduct additonal
reserch that combines factors affecting both macro and micro
economic issues (Headey and Fan, 2008).
2.2.3.2. Microeconomic vulnerability to rising food prices
Several papers follow Ivanic and Martin’s (2008) study of 9
countries across several continents in using microeconomic data
to simulate the impacts of rising food prices on household
poverty (Heady and Fan, 2010). This section reviews the studies
which cover a range of countries and use quite similar
methodologies despite their different sample sizes and scopes.
These studies are the study by Ivanic and Martin (2008); the
study by Wodon et al. (2008) of 12 West African countries; and
the study by Dessus et al.(2008) of the urban sector of 73
developing countries. The basic approach in these papers
follows Deaton (1989) in estimating the change in food welfare
(ΔWFood) as the product of the food net-benefit ratio
(NBRFood) and the change in food prices (ΔPFood):
ΔWFood = ΔPFood × NBRFood = ΔPFood × (YFood/YTotal –
CFood/CTotal),
where YFood/YTotal is the ratio of food sales and own-
production to total household monetary income, and
CFood/CTotal is the ratio of food expenditure and own-
consumption to total household expenditure. Notice that, by
definition, own-production equals own-consumption, and
because each enters into YFood/ YTotal and CFood/CTotal,
respectively, the consumption of food produced by the
household is netted out of NBRFood. Hence the main issues
with microeconomic assessments of the poverty impacts concern
the size of price changes, the numbers of net buyers and sellers,
and the choice of poverty line (Heady and Fan, 2010).
None of these papers assesses the most likely impact on poverty
because: a) They simulate results from admittedly quite recent
macroeconomic surveys, b) They assume domestic food price
changes for lack of actual data, c)They assume a limited range
of behavioral responses by consumers and producers, d) Their
surveys may overestimate net food consumers (see Aksoy and
Isik-Dikmelik, 2008), e) They do not consider rising oil prices
as a simultaneous shock to income and revenue streams, f) They
do not factor in strong economic growth, which characterizes
several developing countries that have been benefiting from
strong commodity prices, g) The absence of better measures.
They use international poverty lines which can potentially make
a considerable difference to the results(Heady and Fan, 2010).
According to Heady and Fan (2010), in addition to these general
limitations, the individual studies have some specific
limitations. Wodon et al. (2008) consider different food items
for different countries, which generally constitute dissimilar
shares of total consumption, casting some doubt on whether
their results are highly comparable. Dessus et al. (2008) only
examine the effects of aggregate food consumption on urban
poverty, assuming constant shares of food expenditures and
fixed food/non-food elasticities across countries. Moreover,
their estimates often contradict findings from the other two
studies. These cross-country microeconomic studies point to the
possibility of marked increases in hunger, but they do not
provide reliable indications of the actual effects of rising food
prices on poor and vulnerable people (Heady and Fan, 2010).
The net effect created by these stimulations implies those that
would be vulnerable to soaring prices and not the populations
that experiance difficulties as a result of the rapidly increasing
food prices. since not one of the expreiments incorporated real
price changes. As indicated above, the shifting nature of food
prices is substantially variant from one country to the other, but
the assumption made in this study is that only the common price
varies across countries. However, these studies have a way of
providing perspective and empirically applicable data for
highlightinng vulnerability to shifting prices across countries
and subnational clusters( e.g urban and rural)
Three studies clrearly point out the poverty change
incidences(poverty headcounts) and also the level of the
changes(for instance poverty gaps). Particularly the studies by
Ivanic and Martin (2008) and Wodon et al. (2008) have greatly
influenced the aspect of framing the responses of the Worldbank
toward the crisis(World Bank, 2008) and as well enhancing
other institutions' support. These four studies as well have
incorporated useful comparisons, including similar simulation
techniques microeconomic surveys. Some of the similarities
listed are ,firstly, four of the papers focus on actuel shifts in
food prices and not entirely all prices of fertilizers, although the
soaring oil prices could much more contribute to poverty than
food prices would. Secondly, the studies have explored the
aspect of the short-run effects through precluding the producer
and consumer behavioral responses, as well as the general or
partial equilibrium consequences on prices of food -all of which
are all very crucial aspects.
The four studies clearly agree with this concept and in addition
the studies by Martin and Ivanic and Zezza et al. (2008) as well
compute some partial equilibrium consequences on the income
of households like robust tests. However neither of the studies
come to a significantly varying finding from the rest, but not in
the case of redistribution of the negative effects between rural
and urban households by Ivanic and Martin’s computation of
unskilled wage effects.
That notwithstanding , it is a possibiliyy for the existence of
behavioral responses to the shifting food prices even in the
short-span period. For instance, many households that a re
pooor oftenly undertake a diversified range of income sources
and as such ma substantially broaden the scope of their farm-
based activities even with the soaring food prices. Summarily,
the major methodological framework applied is such that all
studies have similiarities based on the approach of Deaton
(1989)
Most importantly, the prevalent consequences of the shifting
food prices is dependent upon the number ogf the poor and
vulnerable a.k.a above poverty line , regardless of whether these
peple are net food buyers or sellers : marginal or not, but
whether they are close to this characteristic. This calculus
results into disturbing expectations through which the groups
are expected to face difficulty should the food prices increase.
The urban population is composed of an overwhelming number
of net buyers but who are better off thatn their rural
counterparts. However, we expect equally large number of net
buyers in rural areas attributed to landlessness, low
productivity, cash crop production as well as the prevalent
number of nonfarm workers(Ahmed et al., 2007).
One way in which we can say that the studies by Ivanic and
Martin’s are suprisingly insightful is by considdering the fact
that they implore that the rate of poverty increase in rural areas
is higher than in urban areas – in all the three countries where
the survey was conducted. For instance in Zambia, the rate of
poverty increase in rural areas is three times the urban poverty
rate, regardless of the fact that the two rates were initially at
par(NB: poverty rates to not incorporate the vulnerable
population). Much of consequences on rural poverty that arise
from these simulations do not agree both with our initial
intuitions as well as miscellaneous evidence on these aspects.
According to the analysis on similar surveys as the ones by
Ivanic and Martin (2008), done by Aksoy and Isik-Dikmelik
(2008), the conclusions drawn were such that a)As much as poor
households are more of net food buyers , approximately half of
them are net marginal buyers and b) The average income of net
buyers is usually higher than the one of net sellers in 8 out of
the 9 countries in the study.
An alternative explanation to the variations of rural poverty is
the underestimation of the level of hown tmuch net sellers
households are since the measure of consumption is usually
hinged on production. Based on the same, rural household
income cannot be calculated the same as in urban regions. As
such, its possible that, some survey biases greatly affect these
stimulations, although the strength bias is still unknown to us.
The last issue relates to the diversified nature of microeconomic
vulnerabilities inter-countrywide. There are various factors that
obviously influence household vulnerabilities to shifting food
prices in different countries. According to Zezza et al. (2008),
disaggregates vulnerability aspect among groupd, explaining
vulnerability measures using OLS regressions. Of the 13 3rd
world countries, they point out that the most vulnerable
households are those : with less educated people, rural nofarm,
with dependency on female laborers, landless and practicing
modern agricultural practices.
As much intuitive as all the findings are, its noteworthy that the
microeconomic evidence confirms our intuitions and also
offering magnitudes to the most crucual household attributes in
this study.
In summary, the studies make suggestions that poverty , in the
short run, is bound to increase on condition that food prices rise
substantially. Zezza et al. (2008) emphasizes on the household
types most vulnerable to food price increase. The limitations of
these stimulationare also crucial. Consequently, it is important
to study about real price shifts and the adiitional consequences
of fuel and fertilizer price increase as well as the short-term
responses in the behaviors due to rising food prices and
contributing effects of government policies to these outcomes.
3. MATERIALS AND METHODS
3.1. Methodology
This study derives categorical data from the qualitative data in
order to quantitatively analyze different media coverage of
urban consumers and rural producers under changes in relative
incomes. Content analysis (CA), which is a method of chancing
qualitative data into quantitative data, is chosen as a main
method in the present study. Moreover, a summative approach
to qualitative content analysis which goes beyond mere word
counts to include latent content analysis (Hsieh and Shannon,
2005) is adopted in order to know the frequency of words that
were used to refer to food crisis but also to understand the
underlying contexts for the use of explicit versus implicit terms
related with food crisis. A technique which combines
summative approach to content analysis and regression analysis
is a new technique in economics studies.
3.1.1. Content Analysis
Content analysis is a research method that uses a set of
systematic, rule-guided techniques used to gather and analyze
the content of text (Weber, 1990; Mayring, 2000). ‘‘The
‘content’ refers to words, meanings, pictures, symbols, ideas,
themes, or any message that can be communicated. The ‘text’ is
anything written, visual, or spoken that serves as a medium for
communication.’’ (Neuman, 1997). Berelson (1952) suggests
that describing substance characteristics of message content;
describing form characteristics of message content; making
inferences to producers of content; makeing inferences to
audiences of content; predicting the effects of content on
audiences are main purposes of content analysis.
There are several types of content analysis including
quantitative and qualitative methods all sharing the central
feature of systematically categorizing textual data in order to
make sense of it. They differ, however, in the ways they
generate categories and apply them to the data, and how they
analyze the resulting data (Forman and Damschroder, 2008).
Comparing qualitative content analysis with its rather familiar
quantitative counterpart may enhance the understanding of the
method. Qualitative content analysis is used in order to explore
the meanings underlying physical messages while quantitative
content analysis is used widely in mass communication as a way
to count manifest textual elements. Qualitative content analysis
is mainly inductive, grounding the examination of topics and
themes, as well as the inferences drawn from them while
quantitative content analysis is deductive, intended to test
hypotheses or address questions generated from theories or
previous empirical research. samples for qualitative content
analysis usually consist of purposively selected texts which can
inform the research questions being investigated while
quantitative content analysis requires that the data are selected
using random sampling or other probabilistic approaches, so as
to ensure the validity of statistical inference. The qualitative
approach usually produces descriptions or typologies, along
with expressions from subjects reflecting how they view the
social world while the quantitative approach produces numbers
that can be manipulated with various statistical methods (Zhang
and Wildemuth, 2009).
In real research work, the two approaches are not mutually
exclusive and can be used in combination (Zhang and
Wildemuth, 2009). As Weber (1990) points out, the best
content-analytic studies use both qualitative and quantitative
operations.
3.1.1.1 Qualitative Content Analysis
Qualitative content analysis is one of many qualitative methods
used to analyze textual data. It is a generic form of data
analysis in that it is comprised of an atheoretical set of
techniques which can be used in any qualitative inquiry in
which the informational content of the data is relevant.
Qualitative content analysis stands in contrast to methods that,
rather than focusing on the informational content of the data,
bring to bear theoretical perspectives. (Forman and
Damschroder, 2008).
Qualitative content analysis has been defined as a research
method for the subjective interpretation of the content of text
data through the systematic classification process of coding and
identifying themes or patterns (Hsieh and Shannon, 2005). It is
an approach of empirical, methodological controlled analysis of
texts within their context of communication, following content
analytic rules and step by step models, without rash
quantification (Mayring, 2000). It emphasizes an integrated
view of speech/texts and their specific contexts. It goes beyond
merely counting words or extracting objective content from
texts to examine meanings, themes and patterns that may be
manifest or latent in a particular text. It also allows researchers
to understand social reality in a subjective but scientific manner
(Zhang and Wildemuth, 2009).
In quantitative content analysis, data are categorized using
predetermined categories that are generated from a source other
than the data to be analyzed, applied automatically through an
algorithmic search process (rather than through reading the
data), and analyzed solely quantitatively (Forman and
Damschroder, 2008 from Morgan, 1993). The categorized data
become largely decontextualized. (Hsieh and Shannon, 2005).
Hsieh and Shannon (2005) discusses three approaches to
qualitative content analysis, based on the degree of involvement
of inductive reasoning. The first approach is conventional
qualitative content analysis, in which coding categories are
derived directly and inductively from the raw data.
Conventional content analysis is generally used with a study
design whose aim is to describe a phenomenon. Is is the
approach used for grounded theory development. The advantage
of this approach to content analysis is gaining direct
information from study participants without imposing
preconceived categories or theoretical perspectives. The second
approach is directed content analysis, in which initial coding
starts with an existing theory or prior research findings. Then,
during data analysis, the researchers immerse themselves in the
data and allow themes to emerge from the data.It is guided by a
more structured process than in a conventional approach. The
purpose of this approach usually is to support or extend a
conceptual framework or theory.The third approach is
summative content analysis, which starts with identifying and
quantifying certain words or content in text with the purpose of
understanding the contextual use of the words or content, then
extends the analysis to include latent meanings and themes.
This approach seems quantitative in the early stages, but its
goal is to explore the usage of the words/indicators in an
inductive manner because it goes beyond mere word counts to
include latent content analysis whichrefers to the process of
interpretationof content (Hsiesh and Shannon, 2005)
3.1.1.2. Summative Approach to Qualitative Content Analysis
Summative analysis was recently introduced as a new
qualitative analytic technique for social science. It is developed
to effectively manage, organize, and clarify large bodies of
qualitative, textual data that are complex or cover sensitive
topic areas. It works best with diverse data, whether snippets of
text, or long, meandering tracts. It enables data that do not fit a
mold to be considered, offering more flexibility of working,
with sensitive support from others and enables researcher to be
aware of more nuanced and ambiguous aspects of text (Rapport,
2010).
Typically, a study using a summative approach to qualitative
content analysis starts with identifying and quantifying certain
words or content in text with the purpose of understanding the
contextual use of the words or content. This quantification is an
attempt not to infer meaning but, rather, to explore usage.
Analyzing for the appearance of a particular word or content in
textual material is referred to as manifest content analysis
(Hsieh and Shannon, 2005 from Potter and Levine-Donnerstein,
1999). If the analysis stopped at this point, the analysis would
be quantitative, focusing on counting the frequency of specific
words or content (Hsieh and Shannon, 2005 from Kondracki and
Wellman, 2002). A summative approach to qualitative content
analysis goes beyond mere word counts to include latent content
analysis. Latent content analysis refers to the process of
interpretation of content (Hsieh and Shannon, 2005 from Holsti,
1969). In this analysis, the focus is on discovering underlying
meanings of the words or the content (Hsieh and Shannon, 2005
from Babbie, 1992; Catanzaro, 1988; Morse & Field, 1995).
In a summative approach to qualitative content analysis, data
analysis begins with searches for occurrences of the identified
words by hand or by computer. Word frequency counts for each
identified term are calculated, with source or speaker also
identified. Counting is used to identify patterns in the data and
to contextualize the codes (Hsieh and Shannon, 2005 from
Morgan, 1993). It allows for interpretation of the context
associated with the use of the word or phrase.
Qualitative content analysis usinf the summative content
analysis has several advantages. The first advantage is that it is
nonobtrsive and non reactive (Babbie, 1992). İts provides
indepth meaning on how words are used. The disadvantage
however is the inattention arising from the present data. The
reason for this is that this research depends on trustworthiness.
The best way to show credibility is to show evidence from text
is similar with the iterpretetion (Weber, 1990).
Data analysis process is largely driven by the research question
or aims of the research and begins with identifying and
quantifying the core keywords in text. Word frequency counts
for each identified keyword to classify textual data and identify
patterns in it. The purpose is to understand the contextual use of
the keywords, interpret the context associated with the use of
the keywords and discover the content. Data analysis continues
with quantitative analysis. The OLS regression model is applied
to the categorical data derived from qualitative data. Finally,
the results from qualitative and quantitative analysis are
compared.
3.1.1.3. Computer Program for Support of Qualitative Content
Analysis
ATLAS.ti, a qualitative data analysis software, is used to
support the coding process, such as linking source documents
with notes and memos, coding the texts, retrieving them based
on keywords and picturing the relationships of codes.
ATLAS.ti is software for text analysis and model building. It
handles graphical, audio, and video data files as well as text.
With this package one can code and/or annotate text or media
segments in a variety of ways, search/select segments by code,
create hotlinks connecting segments, and display relationships
among segments in diagrammatic format. One can use the
automatic coding mode to code all similar segments according
to defined patterns. Network diagrams, created with the built-in
semantic network editor, can be exported to graphics and word
processing packages and a built-in HTML generator creates web
pages for sharing work with collaborators. Visually, annotations
and links are made in a margin area of the computer display.
However, ATLAS.tiis not a content analysis package per se, but
rather a text management package lacking fundamental content
analysis statistical functions.
3.1.2. The Ordinary Least Squares (OLS) Regression
Ordinary least-squares (OLS) regression is a generalized linear
modelling technique that may be used to model a single
response variable which has been recorded on at least an
interval scale. The technique may be applied to single or
multiple explanatory variables and also categorical explanatory
variables that have been appropriately coded. At a very basic
level, the relationship between a continuous response variable
(Y) and a continuous explanatory variable (X) may be
represented using a line of best-fit, where Y is predicted, at
least to some extent, by X. If this relationship is linear, it may
be appropriately represented mathematically using the straight
line equation 'Y = α + βx'. The relationship between variables Y
and X is described using the equation of the line of best fit with
α indicating the value of Y when X is equal to zero (the
intercept) and β indicating the slope of the line (the regression
coefficient). The regression coefficient β describes the change
in Y that is associated with a unit change in X (Hutcheson,
2011).
In addition to the model parameters and confidence intervals for
β, it is useful to also have an indication of how well the model
fits the data. Model fit can be determined by comparing the
observed scores of Y (the values of Y from the sample of data)
with the expected values of Y (the values of Y predicted by the
regression equation). The difference between these two values
(the deviation, or residual as it is also called) provides an
indication of how well the model predicts each data point.
Adding up the deviances for all the data points after they have
been squared provides a simple measure of the degree to which
the data deviates from the model overall. The sum of all the
squared residuals is known as the residual sum of squares (RSS)
and provides a measure of model-fit for an OLS regression
1. INTRODUCTIONCheap food has been taken for granted for almost .docx

More Related Content

Similar to 1. INTRODUCTIONCheap food has been taken for granted for almost .docx

Analysis of price volatility and implications for price
Analysis of price volatility and implications for priceAnalysis of price volatility and implications for price
Analysis of price volatility and implications for priceAlexander Decker
 
200420 haniotis food_security_cc_linkedin_annex
200420 haniotis food_security_cc_linkedin_annex200420 haniotis food_security_cc_linkedin_annex
200420 haniotis food_security_cc_linkedin_annexTassos Haniotis
 
Ppt on food security issues and challenges beofe india
Ppt on food security issues and challenges beofe indiaPpt on food security issues and challenges beofe india
Ppt on food security issues and challenges beofe indiaDr. Mohmed Amin Mir
 
Food security: Yesterday Today and Tomorrow
Food security: Yesterday Today and Tomorrow Food security: Yesterday Today and Tomorrow
Food security: Yesterday Today and Tomorrow Abhishek Khadka
 
Perspectives On The World Food Situation 6
Perspectives On The World Food Situation 6Perspectives On The World Food Situation 6
Perspectives On The World Food Situation 6ECHO International Inc
 
Food Prices and Inflation in Developing Asia
Food Prices and Inflation in Developing AsiaFood Prices and Inflation in Developing Asia
Food Prices and Inflation in Developing AsiaPoverty Environment Net
 
Topical research project
Topical research projectTopical research project
Topical research projectejw0062
 
Food price inflation and consumer welfare in ghana
Food price inflation and consumer welfare in ghanaFood price inflation and consumer welfare in ghana
Food price inflation and consumer welfare in ghanananaeghan
 
Price Inflation and Consumer Welfare in Ghana
Price Inflation and Consumer Welfare in GhanaPrice Inflation and Consumer Welfare in Ghana
Price Inflation and Consumer Welfare in Ghanananaeghan
 
The great hunder lottery: How banking speculation causes food crises - Report...
The great hunder lottery: How banking speculation causes food crises - Report...The great hunder lottery: How banking speculation causes food crises - Report...
The great hunder lottery: How banking speculation causes food crises - Report...People's Archive of Rural India
 
Iniciativa para el Monitoreo de la Agricultura Global
Iniciativa para el Monitoreo de la Agricultura GlobalIniciativa para el Monitoreo de la Agricultura Global
Iniciativa para el Monitoreo de la Agricultura GlobalEduardo Rollero
 
Evaluation of the Impact of Biofuels on Food Prices
Evaluation of the Impact of Biofuels on Food PricesEvaluation of the Impact of Biofuels on Food Prices
Evaluation of the Impact of Biofuels on Food PricesFGV Brazil
 
Food sustainability
Food sustainabilityFood sustainability
Food sustainabilityIJARIIT
 
Was the Global Food Crisis Really a Crisis?
Was the Global Food Crisis Really a Crisis?Was the Global Food Crisis Really a Crisis?
Was the Global Food Crisis Really a Crisis?essp2
 
Food raise of price e
Food raise of price eFood raise of price e
Food raise of price eedmond061
 
Water, Food, Energy and Institutions: Inextricably Linked - Keynote Address b...
Water, Food, Energy and Institutions: Inextricably Linked - Keynote Address b...Water, Food, Energy and Institutions: Inextricably Linked - Keynote Address b...
Water, Food, Energy and Institutions: Inextricably Linked - Keynote Address b...Global Water Partnership
 

Similar to 1. INTRODUCTIONCheap food has been taken for granted for almost .docx (20)

Analysis of price volatility and implications for price
Analysis of price volatility and implications for priceAnalysis of price volatility and implications for price
Analysis of price volatility and implications for price
 
200420 haniotis food_security_cc_linkedin_annex
200420 haniotis food_security_cc_linkedin_annex200420 haniotis food_security_cc_linkedin_annex
200420 haniotis food_security_cc_linkedin_annex
 
Ppt on food security issues and challenges beofe india
Ppt on food security issues and challenges beofe indiaPpt on food security issues and challenges beofe india
Ppt on food security issues and challenges beofe india
 
Food security: Yesterday Today and Tomorrow
Food security: Yesterday Today and Tomorrow Food security: Yesterday Today and Tomorrow
Food security: Yesterday Today and Tomorrow
 
Inflation
InflationInflation
Inflation
 
Cross countries analysis
Cross countries analysisCross countries analysis
Cross countries analysis
 
Perspectives On The World Food Situation 6
Perspectives On The World Food Situation 6Perspectives On The World Food Situation 6
Perspectives On The World Food Situation 6
 
Food Prices and Inflation in Developing Asia
Food Prices and Inflation in Developing AsiaFood Prices and Inflation in Developing Asia
Food Prices and Inflation in Developing Asia
 
Topical research project
Topical research projectTopical research project
Topical research project
 
Food price inflation and consumer welfare in ghana
Food price inflation and consumer welfare in ghanaFood price inflation and consumer welfare in ghana
Food price inflation and consumer welfare in ghana
 
Price Inflation and Consumer Welfare in Ghana
Price Inflation and Consumer Welfare in GhanaPrice Inflation and Consumer Welfare in Ghana
Price Inflation and Consumer Welfare in Ghana
 
Synthesis of IFADs Analytical Work on Food Prices, Ganesh Thapa
Synthesis of IFADs Analytical Work on Food Prices, Ganesh ThapaSynthesis of IFADs Analytical Work on Food Prices, Ganesh Thapa
Synthesis of IFADs Analytical Work on Food Prices, Ganesh Thapa
 
The great hunder lottery: How banking speculation causes food crises - Report...
The great hunder lottery: How banking speculation causes food crises - Report...The great hunder lottery: How banking speculation causes food crises - Report...
The great hunder lottery: How banking speculation causes food crises - Report...
 
Iniciativa para el Monitoreo de la Agricultura Global
Iniciativa para el Monitoreo de la Agricultura GlobalIniciativa para el Monitoreo de la Agricultura Global
Iniciativa para el Monitoreo de la Agricultura Global
 
Evaluation of the Impact of Biofuels on Food Prices
Evaluation of the Impact of Biofuels on Food PricesEvaluation of the Impact of Biofuels on Food Prices
Evaluation of the Impact of Biofuels on Food Prices
 
Food price watch_feb_2011
Food price watch_feb_2011Food price watch_feb_2011
Food price watch_feb_2011
 
Food sustainability
Food sustainabilityFood sustainability
Food sustainability
 
Was the Global Food Crisis Really a Crisis?
Was the Global Food Crisis Really a Crisis?Was the Global Food Crisis Really a Crisis?
Was the Global Food Crisis Really a Crisis?
 
Food raise of price e
Food raise of price eFood raise of price e
Food raise of price e
 
Water, Food, Energy and Institutions: Inextricably Linked - Keynote Address b...
Water, Food, Energy and Institutions: Inextricably Linked - Keynote Address b...Water, Food, Energy and Institutions: Inextricably Linked - Keynote Address b...
Water, Food, Energy and Institutions: Inextricably Linked - Keynote Address b...
 

More from jackiewalcutt

briefly summarize how the Electoral College works. Explain some of t.docx
briefly summarize how the Electoral College works. Explain some of t.docxbriefly summarize how the Electoral College works. Explain some of t.docx
briefly summarize how the Electoral College works. Explain some of t.docxjackiewalcutt
 
Briefly summarize and analyze two primary sources, identifying their.docx
Briefly summarize and analyze two primary sources, identifying their.docxBriefly summarize and analyze two primary sources, identifying their.docx
Briefly summarize and analyze two primary sources, identifying their.docxjackiewalcutt
 
Briefly respond to the following questions. Use facts and examples t.docx
Briefly respond to the following questions. Use facts and examples t.docxBriefly respond to the following questions. Use facts and examples t.docx
Briefly respond to the following questions. Use facts and examples t.docxjackiewalcutt
 
Briefly in your own words describe the distinction between explicit .docx
Briefly in your own words describe the distinction between explicit .docxBriefly in your own words describe the distinction between explicit .docx
Briefly in your own words describe the distinction between explicit .docxjackiewalcutt
 
Briefly explain   Victoria Australia Covid19 update and impact.docx
Briefly explain   Victoria Australia Covid19 update and impact.docxBriefly explain   Victoria Australia Covid19 update and impact.docx
Briefly explain   Victoria Australia Covid19 update and impact.docxjackiewalcutt
 
Briefly introduce the détente policies of the early 1970s, and des.docx
Briefly introduce the détente policies of the early 1970s, and des.docxBriefly introduce the détente policies of the early 1970s, and des.docx
Briefly introduce the détente policies of the early 1970s, and des.docxjackiewalcutt
 
Briefly explain the role of information systems in an organization.docx
Briefly explain the role of information systems in an organization.docxBriefly explain the role of information systems in an organization.docx
Briefly explain the role of information systems in an organization.docxjackiewalcutt
 
briefly describe, in 2-3 pages, the problemissue and the proble.docx
briefly describe, in 2-3 pages, the problemissue and the proble.docxbriefly describe, in 2-3 pages, the problemissue and the proble.docx
briefly describe, in 2-3 pages, the problemissue and the proble.docxjackiewalcutt
 
Briefly explain the mission of the OSH Act. What is the rationale be.docx
Briefly explain the mission of the OSH Act. What is the rationale be.docxBriefly explain the mission of the OSH Act. What is the rationale be.docx
Briefly explain the mission of the OSH Act. What is the rationale be.docxjackiewalcutt
 
Briefly discuss the various organizational approaches to managing .docx
Briefly discuss the various organizational approaches to managing .docxBriefly discuss the various organizational approaches to managing .docx
Briefly discuss the various organizational approaches to managing .docxjackiewalcutt
 
Briefly explain the identified security issues during Risk Assessmen.docx
Briefly explain the identified security issues during Risk Assessmen.docxBriefly explain the identified security issues during Risk Assessmen.docx
Briefly explain the identified security issues during Risk Assessmen.docxjackiewalcutt
 
Briefly discuss some KSAs for Fighting Cybercrime and submit in a wo.docx
Briefly discuss some KSAs for Fighting Cybercrime and submit in a wo.docxBriefly discuss some KSAs for Fighting Cybercrime and submit in a wo.docx
Briefly discuss some KSAs for Fighting Cybercrime and submit in a wo.docxjackiewalcutt
 
Briefly describe what a monopoly is and give an example using the ch.docx
Briefly describe what a monopoly is and give an example using the ch.docxBriefly describe what a monopoly is and give an example using the ch.docx
Briefly describe what a monopoly is and give an example using the ch.docxjackiewalcutt
 
Briefly describe the spread of industry throughout Europe and into.docx
Briefly describe the spread of industry throughout Europe and into.docxBriefly describe the spread of industry throughout Europe and into.docx
Briefly describe the spread of industry throughout Europe and into.docxjackiewalcutt
 
Briefly describe the path of food through the digestive system and e.docx
Briefly describe the path of food through the digestive system and e.docxBriefly describe the path of food through the digestive system and e.docx
Briefly describe the path of food through the digestive system and e.docxjackiewalcutt
 
Briefly describe the different parenting styles discussed in this we.docx
Briefly describe the different parenting styles discussed in this we.docxBriefly describe the different parenting styles discussed in this we.docx
Briefly describe the different parenting styles discussed in this we.docxjackiewalcutt
 
Briefly describe how the BIOS boots or starts the computer and.docx
Briefly describe how the BIOS boots or starts the computer and.docxBriefly describe how the BIOS boots or starts the computer and.docx
Briefly describe how the BIOS boots or starts the computer and.docxjackiewalcutt
 
Briefly describe how to deploy a Continuous Improvement effort.W.docx
Briefly describe how to deploy a Continuous Improvement effort.W.docxBriefly describe how to deploy a Continuous Improvement effort.W.docx
Briefly describe how to deploy a Continuous Improvement effort.W.docxjackiewalcutt
 
briefly define democracy and evaluate in detail THREE of.docx
briefly define democracy and evaluate in detail THREE of.docxbriefly define democracy and evaluate in detail THREE of.docx
briefly define democracy and evaluate in detail THREE of.docxjackiewalcutt
 
Briefly define, listcontrast, identify the significance of, or .docx
Briefly define, listcontrast, identify the significance of, or .docxBriefly define, listcontrast, identify the significance of, or .docx
Briefly define, listcontrast, identify the significance of, or .docxjackiewalcutt
 

More from jackiewalcutt (20)

briefly summarize how the Electoral College works. Explain some of t.docx
briefly summarize how the Electoral College works. Explain some of t.docxbriefly summarize how the Electoral College works. Explain some of t.docx
briefly summarize how the Electoral College works. Explain some of t.docx
 
Briefly summarize and analyze two primary sources, identifying their.docx
Briefly summarize and analyze two primary sources, identifying their.docxBriefly summarize and analyze two primary sources, identifying their.docx
Briefly summarize and analyze two primary sources, identifying their.docx
 
Briefly respond to the following questions. Use facts and examples t.docx
Briefly respond to the following questions. Use facts and examples t.docxBriefly respond to the following questions. Use facts and examples t.docx
Briefly respond to the following questions. Use facts and examples t.docx
 
Briefly in your own words describe the distinction between explicit .docx
Briefly in your own words describe the distinction between explicit .docxBriefly in your own words describe the distinction between explicit .docx
Briefly in your own words describe the distinction between explicit .docx
 
Briefly explain   Victoria Australia Covid19 update and impact.docx
Briefly explain   Victoria Australia Covid19 update and impact.docxBriefly explain   Victoria Australia Covid19 update and impact.docx
Briefly explain   Victoria Australia Covid19 update and impact.docx
 
Briefly introduce the détente policies of the early 1970s, and des.docx
Briefly introduce the détente policies of the early 1970s, and des.docxBriefly introduce the détente policies of the early 1970s, and des.docx
Briefly introduce the détente policies of the early 1970s, and des.docx
 
Briefly explain the role of information systems in an organization.docx
Briefly explain the role of information systems in an organization.docxBriefly explain the role of information systems in an organization.docx
Briefly explain the role of information systems in an organization.docx
 
briefly describe, in 2-3 pages, the problemissue and the proble.docx
briefly describe, in 2-3 pages, the problemissue and the proble.docxbriefly describe, in 2-3 pages, the problemissue and the proble.docx
briefly describe, in 2-3 pages, the problemissue and the proble.docx
 
Briefly explain the mission of the OSH Act. What is the rationale be.docx
Briefly explain the mission of the OSH Act. What is the rationale be.docxBriefly explain the mission of the OSH Act. What is the rationale be.docx
Briefly explain the mission of the OSH Act. What is the rationale be.docx
 
Briefly discuss the various organizational approaches to managing .docx
Briefly discuss the various organizational approaches to managing .docxBriefly discuss the various organizational approaches to managing .docx
Briefly discuss the various organizational approaches to managing .docx
 
Briefly explain the identified security issues during Risk Assessmen.docx
Briefly explain the identified security issues during Risk Assessmen.docxBriefly explain the identified security issues during Risk Assessmen.docx
Briefly explain the identified security issues during Risk Assessmen.docx
 
Briefly discuss some KSAs for Fighting Cybercrime and submit in a wo.docx
Briefly discuss some KSAs for Fighting Cybercrime and submit in a wo.docxBriefly discuss some KSAs for Fighting Cybercrime and submit in a wo.docx
Briefly discuss some KSAs for Fighting Cybercrime and submit in a wo.docx
 
Briefly describe what a monopoly is and give an example using the ch.docx
Briefly describe what a monopoly is and give an example using the ch.docxBriefly describe what a monopoly is and give an example using the ch.docx
Briefly describe what a monopoly is and give an example using the ch.docx
 
Briefly describe the spread of industry throughout Europe and into.docx
Briefly describe the spread of industry throughout Europe and into.docxBriefly describe the spread of industry throughout Europe and into.docx
Briefly describe the spread of industry throughout Europe and into.docx
 
Briefly describe the path of food through the digestive system and e.docx
Briefly describe the path of food through the digestive system and e.docxBriefly describe the path of food through the digestive system and e.docx
Briefly describe the path of food through the digestive system and e.docx
 
Briefly describe the different parenting styles discussed in this we.docx
Briefly describe the different parenting styles discussed in this we.docxBriefly describe the different parenting styles discussed in this we.docx
Briefly describe the different parenting styles discussed in this we.docx
 
Briefly describe how the BIOS boots or starts the computer and.docx
Briefly describe how the BIOS boots or starts the computer and.docxBriefly describe how the BIOS boots or starts the computer and.docx
Briefly describe how the BIOS boots or starts the computer and.docx
 
Briefly describe how to deploy a Continuous Improvement effort.W.docx
Briefly describe how to deploy a Continuous Improvement effort.W.docxBriefly describe how to deploy a Continuous Improvement effort.W.docx
Briefly describe how to deploy a Continuous Improvement effort.W.docx
 
briefly define democracy and evaluate in detail THREE of.docx
briefly define democracy and evaluate in detail THREE of.docxbriefly define democracy and evaluate in detail THREE of.docx
briefly define democracy and evaluate in detail THREE of.docx
 
Briefly define, listcontrast, identify the significance of, or .docx
Briefly define, listcontrast, identify the significance of, or .docxBriefly define, listcontrast, identify the significance of, or .docx
Briefly define, listcontrast, identify the significance of, or .docx
 

Recently uploaded

Framing an Appropriate Research Question 6b9b26d93da94caf993c038d9efcdedb.pdf
Framing an Appropriate Research Question 6b9b26d93da94caf993c038d9efcdedb.pdfFraming an Appropriate Research Question 6b9b26d93da94caf993c038d9efcdedb.pdf
Framing an Appropriate Research Question 6b9b26d93da94caf993c038d9efcdedb.pdfUjwalaBharambe
 
ECONOMIC CONTEXT - LONG FORM TV DRAMA - PPT
ECONOMIC CONTEXT - LONG FORM TV DRAMA - PPTECONOMIC CONTEXT - LONG FORM TV DRAMA - PPT
ECONOMIC CONTEXT - LONG FORM TV DRAMA - PPTiammrhaywood
 
Alper Gobel In Media Res Media Component
Alper Gobel In Media Res Media ComponentAlper Gobel In Media Res Media Component
Alper Gobel In Media Res Media ComponentInMediaRes1
 
ECONOMIC CONTEXT - PAPER 1 Q3: NEWSPAPERS.pptx
ECONOMIC CONTEXT - PAPER 1 Q3: NEWSPAPERS.pptxECONOMIC CONTEXT - PAPER 1 Q3: NEWSPAPERS.pptx
ECONOMIC CONTEXT - PAPER 1 Q3: NEWSPAPERS.pptxiammrhaywood
 
CARE OF CHILD IN INCUBATOR..........pptx
CARE OF CHILD IN INCUBATOR..........pptxCARE OF CHILD IN INCUBATOR..........pptx
CARE OF CHILD IN INCUBATOR..........pptxGaneshChakor2
 
Pharmacognosy Flower 3. Compositae 2023.pdf
Pharmacognosy Flower 3. Compositae 2023.pdfPharmacognosy Flower 3. Compositae 2023.pdf
Pharmacognosy Flower 3. Compositae 2023.pdfMahmoud M. Sallam
 
DATA STRUCTURE AND ALGORITHM for beginners
DATA STRUCTURE AND ALGORITHM for beginnersDATA STRUCTURE AND ALGORITHM for beginners
DATA STRUCTURE AND ALGORITHM for beginnersSabitha Banu
 
भारत-रोम व्यापार.pptx, Indo-Roman Trade,
भारत-रोम व्यापार.pptx, Indo-Roman Trade,भारत-रोम व्यापार.pptx, Indo-Roman Trade,
भारत-रोम व्यापार.pptx, Indo-Roman Trade,Virag Sontakke
 
Historical philosophical, theoretical, and legal foundations of special and i...
Historical philosophical, theoretical, and legal foundations of special and i...Historical philosophical, theoretical, and legal foundations of special and i...
Historical philosophical, theoretical, and legal foundations of special and i...jaredbarbolino94
 
“Oh GOSH! Reflecting on Hackteria's Collaborative Practices in a Global Do-It...
“Oh GOSH! Reflecting on Hackteria's Collaborative Practices in a Global Do-It...“Oh GOSH! Reflecting on Hackteria's Collaborative Practices in a Global Do-It...
“Oh GOSH! Reflecting on Hackteria's Collaborative Practices in a Global Do-It...Marc Dusseiller Dusjagr
 
Introduction to ArtificiaI Intelligence in Higher Education
Introduction to ArtificiaI Intelligence in Higher EducationIntroduction to ArtificiaI Intelligence in Higher Education
Introduction to ArtificiaI Intelligence in Higher Educationpboyjonauth
 
Incoming and Outgoing Shipments in 1 STEP Using Odoo 17
Incoming and Outgoing Shipments in 1 STEP Using Odoo 17Incoming and Outgoing Shipments in 1 STEP Using Odoo 17
Incoming and Outgoing Shipments in 1 STEP Using Odoo 17Celine George
 
EPANDING THE CONTENT OF AN OUTLINE using notes.pptx
EPANDING THE CONTENT OF AN OUTLINE using notes.pptxEPANDING THE CONTENT OF AN OUTLINE using notes.pptx
EPANDING THE CONTENT OF AN OUTLINE using notes.pptxRaymartEstabillo3
 
internship ppt on smartinternz platform as salesforce developer
internship ppt on smartinternz platform as salesforce developerinternship ppt on smartinternz platform as salesforce developer
internship ppt on smartinternz platform as salesforce developerunnathinaik
 
Computed Fields and api Depends in the Odoo 17
Computed Fields and api Depends in the Odoo 17Computed Fields and api Depends in the Odoo 17
Computed Fields and api Depends in the Odoo 17Celine George
 
Types of Journalistic Writing Grade 8.pptx
Types of Journalistic Writing Grade 8.pptxTypes of Journalistic Writing Grade 8.pptx
Types of Journalistic Writing Grade 8.pptxEyham Joco
 
Roles & Responsibilities in Pharmacovigilance
Roles & Responsibilities in PharmacovigilanceRoles & Responsibilities in Pharmacovigilance
Roles & Responsibilities in PharmacovigilanceSamikshaHamane
 

Recently uploaded (20)

Framing an Appropriate Research Question 6b9b26d93da94caf993c038d9efcdedb.pdf
Framing an Appropriate Research Question 6b9b26d93da94caf993c038d9efcdedb.pdfFraming an Appropriate Research Question 6b9b26d93da94caf993c038d9efcdedb.pdf
Framing an Appropriate Research Question 6b9b26d93da94caf993c038d9efcdedb.pdf
 
ECONOMIC CONTEXT - LONG FORM TV DRAMA - PPT
ECONOMIC CONTEXT - LONG FORM TV DRAMA - PPTECONOMIC CONTEXT - LONG FORM TV DRAMA - PPT
ECONOMIC CONTEXT - LONG FORM TV DRAMA - PPT
 
Alper Gobel In Media Res Media Component
Alper Gobel In Media Res Media ComponentAlper Gobel In Media Res Media Component
Alper Gobel In Media Res Media Component
 
ECONOMIC CONTEXT - PAPER 1 Q3: NEWSPAPERS.pptx
ECONOMIC CONTEXT - PAPER 1 Q3: NEWSPAPERS.pptxECONOMIC CONTEXT - PAPER 1 Q3: NEWSPAPERS.pptx
ECONOMIC CONTEXT - PAPER 1 Q3: NEWSPAPERS.pptx
 
CARE OF CHILD IN INCUBATOR..........pptx
CARE OF CHILD IN INCUBATOR..........pptxCARE OF CHILD IN INCUBATOR..........pptx
CARE OF CHILD IN INCUBATOR..........pptx
 
Pharmacognosy Flower 3. Compositae 2023.pdf
Pharmacognosy Flower 3. Compositae 2023.pdfPharmacognosy Flower 3. Compositae 2023.pdf
Pharmacognosy Flower 3. Compositae 2023.pdf
 
TataKelola dan KamSiber Kecerdasan Buatan v022.pdf
TataKelola dan KamSiber Kecerdasan Buatan v022.pdfTataKelola dan KamSiber Kecerdasan Buatan v022.pdf
TataKelola dan KamSiber Kecerdasan Buatan v022.pdf
 
DATA STRUCTURE AND ALGORITHM for beginners
DATA STRUCTURE AND ALGORITHM for beginnersDATA STRUCTURE AND ALGORITHM for beginners
DATA STRUCTURE AND ALGORITHM for beginners
 
Model Call Girl in Bikash Puri Delhi reach out to us at 🔝9953056974🔝
Model Call Girl in Bikash Puri  Delhi reach out to us at 🔝9953056974🔝Model Call Girl in Bikash Puri  Delhi reach out to us at 🔝9953056974🔝
Model Call Girl in Bikash Puri Delhi reach out to us at 🔝9953056974🔝
 
भारत-रोम व्यापार.pptx, Indo-Roman Trade,
भारत-रोम व्यापार.pptx, Indo-Roman Trade,भारत-रोम व्यापार.pptx, Indo-Roman Trade,
भारत-रोम व्यापार.pptx, Indo-Roman Trade,
 
Historical philosophical, theoretical, and legal foundations of special and i...
Historical philosophical, theoretical, and legal foundations of special and i...Historical philosophical, theoretical, and legal foundations of special and i...
Historical philosophical, theoretical, and legal foundations of special and i...
 
“Oh GOSH! Reflecting on Hackteria's Collaborative Practices in a Global Do-It...
“Oh GOSH! Reflecting on Hackteria's Collaborative Practices in a Global Do-It...“Oh GOSH! Reflecting on Hackteria's Collaborative Practices in a Global Do-It...
“Oh GOSH! Reflecting on Hackteria's Collaborative Practices in a Global Do-It...
 
Introduction to ArtificiaI Intelligence in Higher Education
Introduction to ArtificiaI Intelligence in Higher EducationIntroduction to ArtificiaI Intelligence in Higher Education
Introduction to ArtificiaI Intelligence in Higher Education
 
9953330565 Low Rate Call Girls In Rohini Delhi NCR
9953330565 Low Rate Call Girls In Rohini  Delhi NCR9953330565 Low Rate Call Girls In Rohini  Delhi NCR
9953330565 Low Rate Call Girls In Rohini Delhi NCR
 
Incoming and Outgoing Shipments in 1 STEP Using Odoo 17
Incoming and Outgoing Shipments in 1 STEP Using Odoo 17Incoming and Outgoing Shipments in 1 STEP Using Odoo 17
Incoming and Outgoing Shipments in 1 STEP Using Odoo 17
 
EPANDING THE CONTENT OF AN OUTLINE using notes.pptx
EPANDING THE CONTENT OF AN OUTLINE using notes.pptxEPANDING THE CONTENT OF AN OUTLINE using notes.pptx
EPANDING THE CONTENT OF AN OUTLINE using notes.pptx
 
internship ppt on smartinternz platform as salesforce developer
internship ppt on smartinternz platform as salesforce developerinternship ppt on smartinternz platform as salesforce developer
internship ppt on smartinternz platform as salesforce developer
 
Computed Fields and api Depends in the Odoo 17
Computed Fields and api Depends in the Odoo 17Computed Fields and api Depends in the Odoo 17
Computed Fields and api Depends in the Odoo 17
 
Types of Journalistic Writing Grade 8.pptx
Types of Journalistic Writing Grade 8.pptxTypes of Journalistic Writing Grade 8.pptx
Types of Journalistic Writing Grade 8.pptx
 
Roles & Responsibilities in Pharmacovigilance
Roles & Responsibilities in PharmacovigilanceRoles & Responsibilities in Pharmacovigilance
Roles & Responsibilities in Pharmacovigilance
 

1. INTRODUCTIONCheap food has been taken for granted for almost .docx

  • 1. 1. INTRODUCTION Cheap food has been taken for granted for almost 30 years. From their peak in the 1970s crisis, real food prices steadily declined in the 1980s and 1990s and eventually reached an all- time low in the early 2000s (Heady and Fan, 2010). Since 2003, the international prices of a wide range of commodities have surged upwards in dramatic fashion, often more than doubling within a few years, in some cases even within a few months (Heady and Fan, 2008).Food prices based on the International Monetary Fund (IMF) food price index increased by 9.5 % between April 2006 and April 2007 and by 45.6 % over the next 12 months. The increase has been particularly very sharp for staple foods. Rice prices doubled in the five months between November 2007 and March 2008, wheat prices increased more than twofold in the 12 months after March 2007 and maize prices doubled in one and half year after August 2006. These increases in prices of staple foods have led to emergencies and rationing in a large number of countries and there are frequent reports of food riots from various parts of the globe (Chand, 2008).In 2007 the food price index calculated by the Food and Agriculture Organization of the United Nations (FAO) rose by nearly 40 %, compared with 9 % the year before, and in the first months of 2008 prices again increased drastically. Nearly every agricultural commodity is part of this rising price trend. Since 2000—a year of low prices—the wheat price in the international market has more than tripled and maize prices have more than doubled. The price of rice jumped to unprecedented levels in March 2008. Dairy products, meat, poultry, palm oil, and cassava have also experienced price hikes (von Braun, 2008). In 2007-08, world food prices reached record levels, rising 80% in 18 months. Following this peak, food prices fell, but since 2009 the cost of food has been climbing steadily in global markets, reaching record highs again in 2011. Over the last five years, the FAO food price index has risen by 92%, threatening the
  • 2. lives and livelihoods of millions of people (FAO, 2012).Although food prices are now lower than their 2008 peak, real prices have remained significantly higher in 2009 and 2010 than they were prior to the crisis, and various simulation models predict that real food prices will remain high until at least the end of the next decade. Needless to say, the stability and effectiveness of the world food system are no longer taken for granted (Heady and Fan, 2010). Source: IMF, Data & Statistics Figure 1.1. World Food Price Index (base 2005=100) Although food commodities are not unique in undergoing such rapid price rises (energy and mineral prices have also surged), a sharp escalation in the price of basic foods has been a burden on the poor in developing countries, who spend roughly half of their household incomes on food. Sharply rising prices offer few means of substitution and adjustment, especially for the urban poor, so there are justifiable concerns that millions of people may be plunged into poverty by this crisis, and that those who are already poor may suffer further through increased hunger and malnutrition (Mitchell, 2008; Heady and Fan, 2010). Yet surging food prices have caused panic and protest in several countries and led to policy actions such as the banning of grain and other food exports by a number of countries and tariff reductions on imported foods in others. The policy actions reflect the concern of governments about the impact of food price increases on the poor in developing countries who, on average, spend half of their household incomes on food (Mitchell, 2008; Heady and Fan, 2010). In its 2008 state of food insecurity publication, FAO (2008) estimatesthat the number of chronically hungry people in 2007 increased by 75 millionover its estimate of 848 million undernourished in 2003–05, with muchof the increase attributed to high food prices. Equally grave concerns have been felt with respect to the impacts that rising food and fuel prices may have
  • 3. had on macroeconomic stability and economic growth. And although the food and fuel crises have largely abated since mid- 2008 and have taken a back seat to the ongoing global financial crisis, food prices have remained high by historical standards and are predicted to stay high in the years to come (Heady and Fan, 2010).Moreover, the evidence of large household surveys since the 1970s generally indicates that food prices will have a negative impact on the welfare of not just urban areas, because many rural poor in developing countries are also net food consumers (World Bank 2008b). These facts have prompted some development agencies to suggest that rising food prices plunge millions more into poverty and deepen poverty still further for those already struggling (World Bank 2008a). A wide range of research has examined the (potential) impacts of higher food prices on poverty (Ahmed et al., 2007; Aksoy and Isik-Dikmelik, 2010; Dessus et al., 2008; Headey and Fan, 2008; IMF, 2008; Ivanic and Martin, 2008; Wodon et al., 2008; Wodon and Zaman, 2008; World Bank, 2008; Zezza et al., 2008). Although we still do not know the accurate welfare effect of higher food prices on urban, rural and country level poverty, the findings of the studies suggest that the overall impact of higher food prices on poverty is generally adverse. Many of the countries in the study samples of Ivanic and Martin (2008) and Wodon et al. (2008) experience significant increases in poverty. However for some studies this conclusion is much more obvious for urban consumers, for some other studies changes in rural poverty are larger than those in urban poverty, especially in Africa. Surprisingly, the study by Ivanic and Martin (2008) shows that rural poverty increases more than urban poverty does, for two out of three countries examined. In Zambia, for example, the incidence of rural poverty increases three times as much as urban poverty. However Aksoy and Isik- Dikmelik (2010) analyze some of the same household surveys as Ivanic and Martin (2008), and they end up with different results. They conclude that (i) although most poor households are net food buyers, almost 50 % are marginal net buyers and
  • 4. (ii) net buyers typically have higher average incomes than net food sellers in eight of the nine countries surveyed, so that a rise in food prices would generally have progressive effects on income distribution. The real welfare effect of higher food prices depends on whether the poor are net buyers or net sellers of food. Since rural populations also have large numbers of net buyers of food, it depends on whether they are marginal net buyers or sellers. Low prices on the world market benefit net buyers and hurt net sellers of the specific product. However, a straightforward implication of these basic principles is that urban consumers lose and rural farmers gain in post-2007 period, and vice versa in pre-2007 period (according to the Figure 1); media coverage of food crisis is limited to food price inflation (i.e. urban consumers).Since public officials react to media news because they see it as a reflection of public opinion (Kim, 2005), the media are important actors in policy-making. Paying a disproportionate amount of attention to the problems of urban consumers and yet not paying any attention to the problems of rural farmers (i.e. media bias) will translate into bad policies (i.e. policy bias). 2. THE CAUSES AND CONSEQUENCESOF FOOD CRISIS 2.2 The Causes of Food Crisis The factors driving recent food price increases are complex. Notwithstanding, looking at the interplay of the forces driving food prices display a clearer picture for understanding the issue. A wide range of research has attempted to identify which factors might have caused the recent surge in food prices (Abbott et al., 2009; Baltzer et al., 2008; Chand, 2008; Headey and Fan, 2008; Headey and Fan, 2010; Helbling et al., 2008; Mitchell, 2008; Schnepf, 2008; Trostle, 2008; von Braun, 2008). In this study, driving factors are investigated by their impacts on the demand and supply of agricultural products.
  • 5. 2.2.1 Demand-side Factors Numerous studies recognize biofuels production as a major driver of food prices. Biofuel production has surged since 2003, and consumed 25% of the US corn crop in 2007; two-thirds of global maize exports are from the US. This explanation is strong for corn, less so for wheat, despite the fact that substitution effects could account for rises in other products (Headey and Fan, 2008). Another driving factor is rapid economic growth in developing countries, thus rising demand, especially from China and India. This factor partly explains rising oil prices and partly explains demand for oilseeds. The weakness of this explanation is thatChina and India are self-sufficient in most major grains, but have not increased imports of any staple foods (Headey and Fan, 2008). Financial market speculation is a widely discussed explanation of the causes of food crisis. Increased financial market activity corresponds with the rise in food prices. Despite the fact that futures markets may have exacerbated the volatility in agriculturalmarkets, they are unlikely to be a main reason for the overall price surge, since there is little proof that these markets essentially impact “real” supply and demand factors. There is not yet clear evidence of a causal link (Headey and Fan, 2008). Another explanation is the depreciation of the U.S. dollar (USD) over the last years, especially against the Euro. Real agricultural trade-weighted index for US depreciated 22% over 2002-2007; USD and commodity prices are covariate. Mitchell (2008) calculates that this factor probably increased dollar- denominated prices by 20% (Headey and Fan, 2008). Yet, Abbott et al. (2009) argue that causality is difficult to sort out since both prices and the exchange rate are determined simultaneously by macroeconomic performance and policy. Another explanation of surging prices is that low real interest rates, especially in the US, have brought about a general price increase in a wide range of commodities. Low interest rates
  • 6. ought to increase demand for storable commodities, increase stocks, and shift investors from treasury bills to commodity contracts. The weakness of this explanation is that there is no clear evidence that futures markets are affecting spot prices. Gold and oil stocks are reasonably high, but stocks of staples are low (Headey and Fan, 2008). 2.2.1.1 Biofuels demand Biofuels have pushed the demand for specific food crops up. An outstanding factor supporting the differencebetween this boom and earlier ones is the role of biofuels.High oil prices in recent years, together with generous policysupport in the United States and the European Union, have ledto a surge in the use of biofuels as a supplement to transportationfuels, particularly in the advanced economies (Helbling et al., 2008). Historically, energy and agricultural markets were largely independent, each influenced by their relevant supply and demand situations. That is no longer the case. Since biofuels production surged in 2006, energy and agricultural markets became closely linked. Ethanol and biodiesel were linked as energy substitutes for gasoline and diesel. Usage of crops for these biofuels became large enough to influence world prices (Abbott et al., 2009). Once oil prices reached $60 a barrel, biofuels became more competitive against oil. The increase in oil prices appears to have prompted the increase in biofuel demand (Schmidhuber, 2006). This dramatic increase in the prices of fossil fuels required a search for alternative sources of energy, and liquid biofuel is seen as an important alternative. Developed countries like the U.S. and EU took advantage of this situation. These countries can give support and subsidies to their producers for producing biofuel crops for domestic use without any problems with the WTO. The trend towards biofuel production helps in reducing subsidies and tariff as it leads to higher prices. Substitution of fossil by biofuel is also helpful in meeting the requirements of the Kyoto Protocol on climate change to reduce
  • 7. greenhouse gas emissions. As a long-term energy strategy, the U.S. is looking for energy security and is working hard to reduce its dependence for oil on the petroleum exporting countries, especially on Organisation of Petroleum Exporting Countries (OPEC). To achieve this goal, liquid biofuel is seen as a viable substitute (Chand, 2008). In recent decades, small amounts of biofuels have been produced and used in several countries. Biofuel production grew slowly until after the turn of the century. Ethanol production in the U.S. began to increase more rapidly in 2003; biodiesel production in the EU began to increase more rapidly in 2005. The U.S. and Brazil are the global leaders for ethanol. They account for about threefourths of global ethanol production (Trostle, 2008). The main biofuels are ethanol from corn or sugarcane and biodiesel from oilseeds or palm. U.S. ethanol is mainly from corn while Brazil ethanol is mainly from sugarcane. The U.S. overtook Brazil as the leading ethanol producer in the world in 2007. However the European Union, China and India also produce ethanol, Brazil and the U.S. together covered most of global ethanol production. The EU is the major global player for biodiesel with more than threefourths of global production. The U.S. had 20 % of global production in 2006. The EU pays more attention to biodiesel than ethanol because a much higher percentage of the automobile fleet is diesel. On the other hand the U.S. pays more attention to ethanol because its fleet is predominantly gasoline. Rapeseed is the primary feedstock in the EU, whereas soybeans are used in the United States. Rapeseed contains about 40 % oil, and soybeans about 18 % (Abbott et al., 2009). When the substitution effect is considered, the increase in biofuel production is a powerful explanation for the rapid rise in the price of many agricultural products, such as corn, soybeans and some oilseeds. Despite all the differences in approach, many studies(Abbott et al., 2009; Chand, 2008; Collins, 2008; Glauber, 2008; Helblinget al., 2008; Lipsky, 2008; Mitchel, 2008; Rosegrant, et al. 2008; Shnepfh, 2008;
  • 8. Trostle, 2008; van der Mensbrugghe, 2006)recognize biofuels production as a major driver of food prices.Glauber (2008)argues that the increase in farm prices of maize and soybeans is linked to biofuels production. Mitchell (2008) remarks that the increased demand for biofuels accounted for the increase in maize and soybean prices (Collins, 2008; Lipsky, 2008; Mitchell, 2008; Rosegrant, et al., 2008; van der Mensbrugghe, 2006). The estimations of the impact of biofuels on the price index of all food are differentiate in many studies. According to Mitchell (2008) these differences depend largely on how broadly the food basket is defined and what is assumed about the interaction between prices of maize and vegetable oils to prices of other crops such as rice through substitution on the supply or demand side (Mitchell, 2008). Until recently, the balance of consumption and production of the energy obtained from ethanol was negative. The energy used to achieve a unit of ethanol was higher than a unit of energy provided by ethanol. In the U.S. ethanol production has benefited from both the high protection and price support. Biodiesel produced from plant materials has enjoyed a greater subsidy than ethanol. Even with the higher subsidy, biodiesel generally is not profitable because soy oil prices have risen to the point that it cannot be economically converted to biodiesel in most circumstances. Soybean and palm prices have moved together and have increased proportionately more than corn prices (Abbott et al., 2009).According to Schmidhuber (2006) the U.S. corn ethanol has been competitive to crude oil on the price of about 58 US $ per barrel. However, this breakeven point reflects the instant corn prices; when raw material prices change this value also change. Many studies argue that diversion of the U.S. corn crop to biofuels is the largest biofuel demand, hence the largest demand-induced price pressure (Abbott et al., 2009; Mitchell, 2008; Schnepf, 2008; von Braun, et al., 2008). The problem is not how much corn used in ethanol production, but it is how much soil withdrawn from food production to
  • 9. produce raw materials. A rough estimate by Trostle (2008) suggests that about 47.8 million acres were used to provide biofuel feedstocks in the 6 major producing countries in 2007. This would account for about 3-4 %t of arable land in these countries (Trostle, 2008). In the US, rapid expansion of maize area by 23 % in 2007 resulted in a 16 % decline in soybean area, which reduced soybean production and contributed to the 75 % rise in soybean prices from April 2007 to April 2008 (Mitchell, 2008). In Europe, other oilseeds displaced wheat for the same reason. Biofuels have contributed to substantially depleting grain stocks, especially in the U.S. (Helbling et al., 2008). On the other hand, there are studies which argue that aditional farm income to be generated by biofuel production may contribute to solutions of many problems, however biofuel production competes with food production. 2.2.1.2 Rapid economic growth in developing countries Since the early 1990s economic growth has been strong for developing countries and since the late 1990s global economic growth has been strong. In addition to these growth in Asia has been exceptionally strong for more than a decade. With having nearly 40 % of the world’s population, rapid economic growth in China and India has provided a strong and sustained increase in the demand for agricultural products (Trostle, 2008). Urbanisation accompanied with economic growth has led a dietary transition from traditional staplestowardhigher-value foods like meat and milk. Many reports (Abbott et al., 2009; Chand, 2008; Mitchell,2008; Schnepf, 2008; von Braun, et al., 2008) on the crisis have specifically referred to changing consumption patterns in China and India, particularly the rapid growth in meat and vegetable consumption. In China, between 1990-2006, per capita annual urban household consumption of milk increased from 5 liters to 18 liters. However, the change is not limited to China. Likewise, milk consumption increased by 20% in India, 30% in Nigeria between 1990-2005. At the same time red meat consumption in
  • 10. Brazil increased by 70% ( von Braun, 2008). There are two aspects in changes in dietary patters. The first is the increase in income per capita. The second issue is that there is an increased consumption of livestock products that purely by the independent decision of consumers. This can also be caused by a shift in preference from lowly priced caloric foods like cereal to more epensive caloric foods like meat and egg which ultmately leads to the increase in the consumption of cerealdue tothe price. The conversion ratio between feed to meat varies widely depending on the type of meat. For example int he U.S, approximately 7 kilograms of corn produces either one kilogram of beef or pork, chicken is considerably lower with one kilogram of corn producing 2.6 kg of chicken (ERS, 2008). This means that increased consumption of beef represents increase in consumption of cereal several fold. (Chand, 2008). While China and India have received much attention, some studies differ with the others on the impacts of China and India. Abbott et al. (2009) argue that world prices are formed by those who trade. China and India have both followed policies aimed at agricultural self-sufficiency, and neither are major traders of most agricultural commodities. However, China’s rapidly growing oil imports have had an indirect effect on food prices by impacting world prices for crude oil. Mitchell (2008) argued that rapid income growth in developing countries has not led to large increases in global grain consumption and was not a major factor responsible for the large grain price increases.However, it has contributed to increased oilseed demand and higher oilseedprices as China increased soybean imports for its livestock and poultry industry. BothChina and India have been net grain exporters since 2000, although exports have declinedas consumption has increased. Global consumption of wheat and rice grew by only 0.8and 1.0 % per annum, respectively, from 2000 to 2007 while maize consumptiongrew by 2.1 % (excluding the demand for biofuels in the U.S.). This was slower than demand growth during 1995-2000 when wheat,
  • 11. rice and maize consumption increased by 1.4, 1.4 and 2.6 % per annum, respectively. China imported less wheat in 2000-2007 (33.8 million metric tons) than it did in the preceding eight years (40.3 million mt), and its rice imports also declined slightly from already low levels (just over 5 million mt). Indian imports of wheat and corn have also been negligible, and India is generally a net exporter of rice. If China and India have contributed to the crisis, they have done so through very indirect channels, such as by influencing the demand for oil and global trends in stocks. The one agricultural commodity group for which China and India have sizably increased their demand is oilseeds, but this surge began in the mid 1990s. This increased oilseeds demand from Asia had had some effect on global markets. For example, soybean imports within the developing world rose from 20.4 to 33.5 million metric tons from the mid 1990s to the present, a trend which contributed to US farmers increasing their soybean production area by over 11 million hectares. (Headey and Fan, 2008). Headey and Fan (2010) argue that this research theme was prominent prior to, and independent of the 2008 food crisis. However, surging demand from China and India turns out not to present any compelling linkages to the crisis. At the national level both countries are largely food secure, so they rarely rely on substantial food imports, except some oilseeds. It is true that both countries, especially China, have experienced greatly increased demand for energy and other minerals, but their demand is by no means the only cause of rising oil prices and is perhaps not even the main cause (Headeys and Fan, 2010). 2.2.1.3 Financial market speculation Another factor that is said to have played a role in the current crisis is speculation in financial markets. This explanation has been widely discussed, but it is poorly understood and has been only superficially researched, with the exception of a recent Conference Board of Canada working paper (CBC, 2008) that provides an authoritative review of the issue (Headey and Fan,
  • 12. 2008). Commodities-related financial markets have expanded rapidly and gained importance in recent years. The expansion of commodity financial markets creates new opportunities as well as challenges. On the one hand, financial markets can enhance the liquidity, depth, and fluidity of commodity trades, which helps price discovery. Commodity financial markets also contribute to the efficient allocation of risk. Financial hedging, as a form of insurance, can be used by commodity market participants to reduce risks associated with excessive commodity price volatility that complicate budgetary, financial, and investment plans. On the other hand, the simultaneous increase in prices and in investor interest, especially by speculators and index traders, in commodity futures markets in recent years can potentially magnify the impact of supply- demand imbalances on prices. Some have argued that high investor activity has increased price volatility and pushed prices above levels justified by fundamentals, thus increasing the potential for instability in the commodity and energy markets. Despite the the difficulty of identifying speculative and hedging-related trades, a number of recent studies seem to suggest that speculation has not systematically contributed to higher commodity prices or increased price volatility. Some studies show that speculative activity tends to respond to price movements, suggesting that the causality runs from prices to changes in speculative positions (IMF, 2006). In addition, the Commodity Futures Trading Commission has argued that speculation may have reduced price volatility by increasing market liquidity, which allowed market participants to adjust their portfolios, thereby encouraging entry by new participants. Finally, although many transactions are described as speculative, they may in fact reflect a precautionary desire to hedge exposures in the face of uncertainty (Helbling et al., 2008). The role of speculation in futures markets has been much discussed as a cause for extreme shifts in agricultural and
  • 13. energy prices from 2006 to 2008. The factors identified played a more important role in price shifts than did speculation in futures markets. This does not infer that speculation may have played a role in the volatility, but it clearly was not the primary cause as some imply. Markets tend to overshoot—both by going up and going down—and additional funds in the commodity markets may have accentuated these short-term impacts (Abbott et al., 2009). Several reports in the international media indicate that professional speculators and hedge funds drive up the prices of basic commodities in commodity futures following the collapse of the financial derivatives markets. These dealers are reported to be shifting investments out of equities and mortgage bonds and ploughing them into food and raw materials. However, the impact of such investments is expected to peter out in the long run with fundamentals assuming a determining influence on the market (Chand, 2008). One of the principal reasons for concern over futures markets is that their emergence has brought the increasing participation of “noncommercial” participants in agricultural markets, or speculators. However, causal linkages between futures and spot prices are unclear (Headey and Fan, 2008).A reflection of speculative and investor activity was the quadrupling of thenumber of wheat futures contacts traded on the Chicago Board of Trade from 2002 to2006. However, the increase in futures contracts does not coincideclosely with the increase in wheat prices, which raises doubts about the impact on prices. The impact on prices is hard to quantify and most studies do not find that such activitychanges prices from the levels which would have prevailed without such activity (Mitchell, 2008 from Gilbert, 2007), however, they may change the rate of adjustment to a new equilibrium whenfundamental factors change (Mitchell, 2008). Headey and Fan (2008) argue that speculation may be more a symptom of underlying volatility than a cause of that volatility. Also, many of the charges made against financial markets relate
  • 14. to their efficient function more than their effect on spot prices per se. Headey and Fan (2010) argue also that it is impossible to discern causality in the context of futures markets, even from time series econometrics, as futures-market variables represent expectations of the future. Thus the usual Granger-causality tests are potentially irrelevant, because expectations of price rises at time t might be noncausally associated with higher prices at time t + 1. However, whether or not futures market activities were a cause of the crisis, they find it unlikely that they were a driving force, if only because they have substantial confidence in several of the more tangible explanations of the crisis: oil prices, biofuels demand, a depreciating U.S. dollar, and various trade shocks, in particular. Finally, what evidence there is of impacts on spot prices is largely anecdotal, and again, rarely indicative of causality. The contract price volatilities of corn and wheat futures price indexes have increased from 19.7% and 22.2% since 1980 to 28.8% and 31.4% in 2006–2007, respectively (Schnepf, 2008), and both the price level and volatility formost agricultural commodities have continued to rise in 2008. However, a study of the emerging lack of convergence between cash and futures prices has not identified any significant causal factor (Irwin et al., 2007). Other analysts have suggested that agricultural commodity markets are now playing a role traditionally reserved for gold and other precious metals—a safe haven for investors—but data from the U.S. Commodity Futures Trading Commission (CFTC) suggest that the balance between long (noncommercial) and short (commercial) positions has been more or less maintained. Another charge is that securitized foods have experienced more price volatility than nonsecuritized foods (van Ark, 2008). Yet several nonsecuritized foods have indeed experienced rapid price increases,4 and the fact that the securitized commodities may have been selected for futures markets precisely because of some distinguishing characteristics—for example, rising or less elastic demand, greater volatility, larger U.S. production—
  • 15. suggests that simple comparisons of securitized and nonsecuritized futures prices may not be valid in any case. In summary, although futures markets may have exacerbated the volatility in agriculturalmarkets, they are unlikely to be a leading cause of the overall price surge, since there is little evidence that these markets significantly influence “real” supply and demand factors (Headey and Fan, 2008). 2.2.1.4 Depreciation of the USD Another commodity-wide explanation of surging prices is the depreciation of the U.S. dollar (USD) over the last years, especially against the euro. The effects of dollar depreciation became stronger when more currencies than just the euro began to appreciate against the dollar and, starting about August 2007 when the U.S. Federal Reserve Bank began to loosen monetary policy to fight impending recession, further weakening the dollar. Since July 2008, the dollar has appreciated against the euro and against many other currencies, especially those of developing countries. This has contributed to rapid agricultural commodity price declines in dollar terms, though less so in other currencies (Abbott et al., 2009). The U.S. dollar depreciated about 35% against the euro from January2002 to June 2008 (Mitchell, 2008). The depreciation of the USD can clearly account for the rise in dollar-denominated food prices in an arithmetical sense, cutting off 20-30% of the nominal dollar increase in the case of conversion from USD to Euros (Headey and Fan, 2008). The depreciation of the dollar has been shown to increase dollar-denominated commodity prices with an elasticity of between 0.5 and 1.0 (Gilbert, 1989). Shane and Liefert (2007) argues thatthe elasticity should beless than 1.0, because the exchange rate does not pass-through completely in manycountries due to policies.If the elasticity istaken as the mid-point of the range from 0.5 to 1.0, the increase in food prices due to thedecline of the dollar would have been about 20 percent (with an elasticity of 0.75) between January2002 and June 2008 (Mitchell, 2008).
  • 16. TheU.S. dollar exchange rate affects commodity pricesbecause most commodities—in particular, crude oil, preciousmetals, industrial metals, and grains such as wheatand corn—are priced in U.S. dollars. The effective dollardepreciation seen over the past few years therefore has madecommodities less expensive for consumers outside the dollararea, thereby increasing the demand for the commodities (Helbling et al., 2008). As Abbott et al. (2009) discuss, when the dollar weakens, agricultural exports (particularly grain and oilseeds) also increase, ceteris paribus. Abbott et al. (2009), find that the dollar depreciated 22% and the value of agricultural exports increased 54% from 2002 to 2007. Considering that the US is a large country in international agricultural markets, especially in the case of wheat, corn and soybeans, depreciation of the USD should lead to higher prices in the US, but lower prices in the rest of the world. Abbott et al. also show that in the current crisis the divergence between the dollar and many other currencies has been quite stark compared to previous increases in nominal dollar-denominated food prices. When the U.S. dollar declines in value in international exchange markets relative to the currency of. export competitors of the U.S. (e.g., Canada, Australia, or the EU) or importing nations (e.g., Japan, Taiwan, etc.), it makes U.S. export products cheaper and, therefore, more competitive. Since January 2002, the U.S. dollar has lost over 44% of its value against the EU’s euro and the Australian dollar, and nearly 37% against the Canadian dollar.A key result of the declining value of the U.S. dollar has been a dramatic surge in U.S. exports of agricultural products, particularly of bulk commodities. Record exports in the face of historically high commodity prices seems somewhat counterintuitive. However, the decline in the foreign exchange value of the U.S. dollar has been so dramatic that, in some cases, it has completely offset the rise in commodity prices, thereby making U.S. grains and oilseed very attractive. The record shipments of grains and oilseeds have helped to draw down U.S. stocks and fuel higher commodity prices (Schnepfh,
  • 17. 2008). On the supply side, the declining profits in local currencyfor producers outside the dollar area have put price pressureson the commodities. A decline in the effective value ofthe dollar also reduces the returns on dollar-denominatedfinancial assets in foreign currencies, which can make commodities a more attractive class of “alternative assets” toforeign investors. Finally, dollar depreciation canlead to monetary policy easing and lower interest rates inother economies, especially in countries whose currenciesare pegged to the dollar, which also raises the demand forcommodities (Helbling et al., 2008). Causality is difficult to sort out since both the exchange rate and commodity prices are determined simultaneously by macroeconomic performance and policy in the United States and abroad. Macroeconomic forces, such as global recession and financial crisis, are critical to explaining the recent evolution of the dollar, crude oil prices, and agricultural commodity prices, although market specific factors also matter in each case (Abbott et al., 2009). 2.2.1.5 Low Interest Rates Another explanation is that low real interest rates, especially in the US, have caused a general price increase in a wide range of commodities. With the rapid expansion of commodity financial markets in recent years, many commodity prices are more directly exposed to various macrofinancial shocks. The main reason is that spot prices of a growing number of commodities are determined in exchange-based trading. Although such trading has long existed for some agricultural commodities such as grains, it has recently become more prevalent for other commodities. Moreover, with many futures contracts settled in cash rather than through the delivery of the underlying commodity, investors outside the commodity business can now use commodities to diversify their portfolio, thereby more closely linking futures markets for commodities with other financial markets. This has opened up new opportunities for market participants but also led to challenges (Helbling et al.,
  • 18. 2008). Low interest rates increase the demand for storable commodities, increase the desires of firms to carry inventories, and encourage speculators to shift out of treasury bills and into commodity contracts. All three of these mechanisms work to increase the market price of commodities, in what is often known as “carry trade.” It is questionable, however, whether this explanation is actually consistent with the evidence. One inconsistency is that agricultural inventories are low rather than high. Moreover, the diversion of assets from treasury bills and the like to commodities may have influenced agricultural futures prices,but the jury is still out as to whether this has had a substantial effect on spot prices (Heady and Fan, 2008). Low interest rates can spur aggregate demand, which would increase the demand for commodities. Besides this growthrelated effect, the favorable liquidity conditions associated with low interest rates also tend to increase both asset demand for commodities (partly because low-yielding treasury bills are less attractive) and incentives for holding commodity inventories by lowering holding costs, everything else being equal (Helbling et al., 2008). 2.2.2 Supply-Side Factors Increased demand alone cannot explain the large and persistent rise in commodity prices seen in recent years.Supply factors also play a role. Slow supply responses have amplified price pressures. The slow supply response in the initial phases of this primarily demand-driven boom did not come as a surprise, given limits to production increases in the short term. Excess demand is accommodated by inventorydrawdowns while prices increase - a pattern that was seen in many commodity markets in recent years. Because the demand for commodities tends to be price inelastic - that is, a large change in the prices of commodities leads to only a small change in the demand for them, especially in the short term - the feedback effects of rapid price increases on demand during these phases tend to be limited, which
  • 19. partlyexplains the large spikes often seen in commodity markets. Besides initial supply-response problems, however, a new key feature that has emerged in the current broad-based commodity market boom is the increasingly prominent role of the slow supply adjustment to increased demand. Such structural problems have been particularly acute in the case of oil, where capacity growth in response to persistently higher prices has been disappointing in recent years. And, as the pessimistic prospects for capacity growth have seemed more certain, these expectations have further fueled price pressures. This was particularly the case in 2007. Key handicaps have been the declining average size of fields and the technological challenges involved in the increasing reliance on exploiting nonconventional fields. These supply rigidities, together with soaring demand for oil equipment and services, have pushed up costs dramatically (Helbling et al., 2008). Sharply risenoil prices have a direct impact on cereal prices, especially on wheat and corn prices in several ways – through an increase in prices of fertilisers and agriculture chemicals used as inputs, through an increase in the cost of operation of farm power and machinery, and through an increase in transport cost and also an indirect impact through substitution effects.This explanation has no critical weaknesses, even thought there are several authors who expect the effects of rising oil prices on food prices to be more delayed and to have a larger impact via biofuel demand (Heady and Fan, 2008). Weather-related production shortfalls offer another commodity- specific explanation for world cereals price rises, specifically for wheat (Headey and Fan, 2008), especially in Australia, U.S., EU, Canada, Russiaand Ukraine. Australian wheat production was 50- 60% below trend growth rates in 2005 and 2006; there were also moderately poor harvests in US, Russia and Ukraine. The weakness of this explanation is that it only explains wheat prices (Heady and Fan, 2008). Another supply-side explanation is decline of stocks, which is traditionally associated with increased sensitivity to shocks;
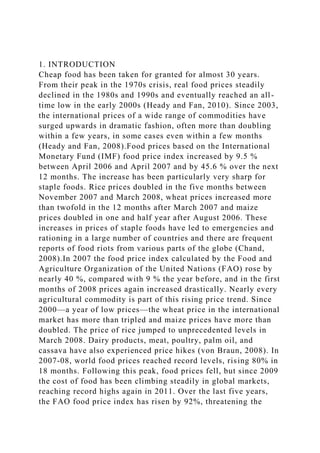
  • 20. stocks of all major cereals declined prior to the price surge. This might constitute a crop-specific explanation, especially given that stocks have declined for maize, wheat and rice. The weaknesses of this explanation are that netting out China makes the decline in stocks less dramatic and unless stock declines result from policies, declines only represent the effects of other factors (Heady and Fan, 2008). Export bans and restrictions which are imposed by Argentina, India, Kazakhstan,Pakistan, Ukraine, Russia and Vietnam fueled the price increases by restricting access to supplies.Price rises for rice were preceded by export restrictions in countries that account for 40% of global rice exports. The weaknesses of this explanation are that wheat, maize and soybean price rises generally preceded restrictions, and the biggest players did not impose restrictions (Heady and Fan, 2008). 2.2.2.1. Rising Oil Prices The increase in prices of crude oil, gas and such sources of energy affects almost all sectors. It has a direct impact on cereal prices in several ways – through an increase in prices of fertilisers and agriculture chemicals used as inputs, through an increase in the cost of operation of farm power and machinery, and through an increase in transport cost. Between 2004 and 2007, crude oil prices increased by 89 % (Chand, 2008). Higher oil prices have also had an important effect on other commodities, not only through the traditional cost-push mechanism (because oil is used as an input in agriculture and the production of metals such as aluminum) but also through substitution effects. For example, natural rubber prices have risen because its substitute is petroleum-based synthetic rubber. Uranium price increases have been driven by demand for nuclear energy, whereas coal prices have recently risen because of utilities’ switching from more expensive fuel oil to coal for power generation. And, of course, biofuels are substitutes for gasoline and diesel at the margin (Helbling et al., 2008). Historically, energy and agricultural markets were largely independent, each influenced by their respective supply and
  • 21. demand situations. That is no longer the case. Since 2006, energy and agricultural markets became closely linked as biofuels production surged. Ethanol and biodiesel were linked as energy substitutes for gasoline and diesel, and usage of crops for these biofuels became large enough to influence world prices (Abbott et al., 2009). Energy and agricultural prices have become increasingly intertwined. With oil prices at an all-time high of more than US$100 a barrel and the U.S. government subsidizing farmers to grow crops for energy, U.S. farmers have massively shifted their cultivation toward biofuel feedstocks, especially maize, often at the expense of soybean and wheat cultivation (von Braun, 2008). The long-run association between the prices of crude oil and food can be seen fromFigure 2.1by Chand (2008) using IMF and USDA’s data. This presents the index of food and crude oil prices with base 2005 = 100 and shows that fluctuations in crude oil prices are much higher and bigger than fluctuations in food prices. Source: Chand, 2008 Figure 2.1. Crude Oil Price Index and Food Price Index (base 2005=100) Food prices are not affected by small fluctuations in crude prices, but a large and consistent decrease or increase exerts a very strong influence on food prices. This is evident from the correlation between crude and food prices in different phases of the trend in crude prices. When crude prices fluctuated around a flat trend then food prices followed an almost independent trend, affected by other factors. This was in the period 1987 to 1999 (with a correlation of 0.244). However, when crude prices followed a sharp decline for a couple of years, then food prices also declined, though less sharply than crude prices (1980 to 1986). Conversely, when crude oil prices rise sharply for couple of years, food prices also increase sharply as is evident from the correlation for the period 2000 to 2007, which was as high as
  • 22. 0.95. The impact varies across commodities, regions and farming practices (Chand, 2008). Mitchell (2008) argues that high energy prices have contributed about 15-20% to higher U.S. food commodities production and transport costs. Production costs per acre for U.S. corn,soybeans and wheat increased 32.3, 25.6 and 31.4 %, respectively, from 2002 to2007.However, yield increases during this period reduced the per bushel costincreases to 17.0, 24.1 and 6.7 %, respectively. The contribution of the energy intensivecomponents of production costs—fertilizer, chemicals, fuel, lubricants andelectricity—were 13.4 % for corn, 6.7 % for soybeans and 9.4 % forwheat per bushel. The production- weighted average increase in the cost of productiondue to these energy-intensive inputs for these crops was 11.5 % between 2002 and 2007. In addition to the increase in production costs, transport costs also increased due tohigher fuel costs and the margin between domestic and export prices reflect this cost. Thus, the combined increase inproduction costs and transport costs for the major U.S. food commodities—corn, soybeans and wheat—was at most 21.7 %, and this amount likely overstates the increase, because transport costs are not estimated separately. It therefore seems reasonable to conclude that higher energy and related costs increased export prices of major U.S. food commodities by about 15-20 % between 2002 and 2007 (Mitchell, 2008). Finally, the energy used in agricultural production is mostly oil- related, and oil prices have risen faster than the prices of other energy sources. Moreover, US food production– which dominates world food production and export markets– is especially oil-intensive. Oil prices also affect the prices of fertilizers and other chemicals used in crop production. For wheat and corn, fertilizer prices alone account for over a third of total operating costs and 15-20% of total costs (Headey and Fan, 2008). Factoring in the rising costs of fuel, fertilizers and other oil-related farm productions, Headey and Fan (2008) estimate that oil prices increased the costs of US production of
  • 23. corn, wheat and soybeans by 30-40% over 2001-2007 relative to a baseline scenario in which oil-related prices only increased by the inflation of the US GDP deflator. These fuel-based cost increases correspond to about 8% of the observed corn price increases, 11% of soybean price increases, and about 20% of wheat price increases. 2.2.2.2 Weather-Related Production Shortfalls Weather shocks offer another commodity-specific explanation for World cereals price rises, specifically for wheat (Headey and Fan, 2008), especially in Australia, U.S., EU, Canada, Russiaand Ukraine (OECD-FAO, 2007). Global grain production declined in both 2005 and 2006 — primarily due to declining global productivity — cutting into existing stocks and reducing exportable supplies. A major tipping point occurred in 2007 when Australia — traditionally a major wheat and barley exporter — suffered a second consecutive year of sharply lower grain production due to drought. With stocks already low, Australia’s 2007 grain exports were dramatically curtailed for a second year (Schnepfh, 2008). The back-to-back droughts in Australia in 2006 and 2007 reduced grain exports by an average of 9.2 million tons per year compared with2005 (Mitchell, 2008). Meanwhile, grain crops in the U.S., Canada, EU, Eastern Europe, and some countries of the former Soviet Union were also reduced by weather conditions (Schnepfh, 2008). Poor crops in the EU and Ukraine reduced their exports by an additional 10million tons in 2007 (Mitchell, 2008). In the EU, declining grain supplies forced livestock producers to import substantial volumes of wheat and other feed grains for feed rations. As a result, the EU switched from its traditional status as a major net exporter of grains into a net importer in 2007. The cumulation of these events severely drew down global grain supplies (Schnepfh, 2008). Theproduction shortfall was most significant in wheat, where global production declined 4.5percent in 2006 and then increased only 2 percent in 2007. Global oilseed production
  • 24. rose5.4 percent in 2006/07 and declined 3.4 percent in 2007/08 (Mitchell, 2008). Australian wheat production was 50-60% below trend growth rates in 2005 and 2006. The U.S. also experienced a poor harvest in 2006, some 14% lower than the previous year, and more modest declines were seen in Russian and Ukrainian production. However, a closer inspection of the data suggests that this intuitively attractive explanation is not as convincing as it first appears. The main problem is that annual production shortfalls are a normal occurrence in agricultural production in general and in wheat production in particular. Global wheat production declined by 5% in 2006/07, but it also declined by 11% in 2000/01 and 6% in 1993/94. The U.S. wheat production fell by bigger margins in 1991/92 (27%), 2001/02 (13%) and 2002/03 (18%), and a closer inspection of Australia’s wheat production since 1990 shows other years when harvests were well below trend: by 51% in 2002, and by 50-100% from 1993 to 1995. Moreover, the output declines seen in several countries in 2007 were offset by large crops in Argentina, Kazakhstan, Russia and the U.S., whose wheat exports increased by around 13% (or an additional 7.5 million mt) compared to those in 2006. Therefore, while overall global grain production declined by 1.3% in 2006, it then increased 4.7% in 2007 (Headey and Fan, 2008). Thus theproduction shortfall in grains would not, by itself, have been a major contributor to theincrease in grain prices. But when combined with large increases in biofuels production,land use changes, and stock declines it undoubtedly contributed to higher prices (Mitchell, 2008). 2.2.2.3Decline of Stocks Another supply-side explanation is stock declines, which could influence price volatility by determining the stability of supply. This might constitute a crop-specific explanation, especially given that stocks have declined for maize, wheat and rice. World stocks for maize, for example, declined from 26% of usage over 1990-2000 to just 14% of consumption from 2005- 2008, but excluding China from the global figures suggests that
  • 25. world stocks remained the same over the two periods, at just 12%. Nevertheless, a large number of major producing and exporting countries have incurred substantial stock declines in recent years (Headey and Fan, 2008). The period from 1998 to 2005 was one of high stocks and low prices. The world was reducing stocks as production dropped below usage in most of those years. By 2006, excess grain and oilseed stocks had been eliminated. Low world production in 2006 and 2007, in combination with on-going food demand growth and large added demands for biofuels, drove global stocks to extremely low levels by mid-2008 with expectations of continued low stocks until 2009. Going into the spring of 2008, expectations were for dangerously low stocks. High prices helped stimulate production with larger area and greater use of inputs. Over time, high prices also reduced world usage. Revisions in supply and use estimates since June 2008 have generally increased world output and reduced usage (Abbott et al., 2009). Recent data and strong historical covariance between prices and stocks superficially suggest that stock declines could substantially account for recent price movements. However, there are some significant caveats to this conclusion. Most importantly, declining stocks might simply reflect increased demand or reduced production levels. Biofuel production offers a promising explanation for declines in maize stocks, and bad weather, stagnating production growth and low prices seem to account for the almost pervasive decline in wheat stocks (Headey and Fan, 2008). Headey and Fan (2008) argue that for stock declines to be causally related to the current crisis, they must therefore be associated with exogenous policy decisions, or other forces. And they see three such policy decisions that could support a causal relationship. First, it may be that stocks were so high and prices were so low prior to 2000 that there appeared to be a need to reduce stocks. Second, the increasing use of just-in-time inventory systems may have led to lower stocks. These two explanations are plausible but generally difficult to prove.
  • 26. Headey and Fan (2008) also argue that stock declines are consistent with rising prices but not as causally convincing as it might appear at first glance, partly because they are a symptom of deeper causes, and partly because their effects on prices are enacted through interactions with other factors. It is also possible that excessively high stocks in the 1990s (and before the 1974 crisis) were actually an underlying cause of the crisis: The use of stocks to satisfy increasing demand may have delayed price rises that would otherwise have provided a stronger signal of rising demand. In terms of policy implications, it is therefore not altogether clear that increasing stocks once more would prevent further food crises. 2.2.2.4 Export Bans and Restrictions Export bans and restrictions fueled the price increases by restricting access to supplies.A number of countries have imposed export restrictions or bans on grainexports to contain domestic price increases. These include Argentina, India, Kazakhstan,Pakistan, Ukraine, Russia and Vietnam (Mitchell, 2008). Since late 2007, several traditional wheat and rice exporting countries — in an effort to ensure domestic food availability and temper rising internal inflation — have instituted policies designed to limit exports of domestic supplies. These policies, albeit implemented to dampen internal prices for domestic consumers, have had exactly the opposite effect on international market prices, pushing them higher than supply and demand conditions would otherwise dictate by limiting access to available supplies by international buyers (Schnepfh, 2008). For rice, in particular, export restrictions are a very compelling explanation, first because a number of important exporting countries that imposed restrictions, and second because rice is much more thinly traded relatively to other staples, with only around 7% of global production being traded over the last five years (Heady and Fan, 2008). In the international rice market, the traditional exporters including Vietnam, India, China, and Egypt, (the world’s second-, fourth-, sixth-, and eighthleading
  • 27. rice exporters in 2007), along with minor exporter Cambodia, have all set in place policies to limit exports. The combined effect of these bans is to remove over a third of available export supplies from world markets and to drive international rice prices sharply higher (Schnepfh, 2008). A closer look at the timing of export restrictions and rice price increases also suggests causality. From August 2005 until November 2007, rice prices increased steadily and significantly, by about 50% (in real terms) from an all-time low in 2005. In November of 2007, India imposed the first major export restriction. This appears to have been the turning point for rice prices. From November 2007 to May 2008, rice prices increased by 140%, despite an all time production high in 2007, the complete absence of any significant increase in demand, and fairly stable rice stocks (with the exception of non-trading China). In early 2008, panic ensued as the rise in other commodity prices began to attract much more concern in Asian markets. This prompted further export restrictions from Vietnam, Cambodia and Egypt, and precautionary rice purchases by the Philippines, which imported 1.3 million metric tons of rice in just the first four months of 2008 (an amount that exceeded their entire import bill of 2007). This surge continued until May, when Japan released 200,000 tons of rice to the Philippines. Prices fell almost immediately. This was followed by further price declines after Cambodia lifted its export ban in June. Hence, it appears that the remarkable and very costly surge in rice prices in 2008 was largely due to the traders’ reactions to export restrictions, plus hoarding by a number of important players in what was already an unusually thin market (Heady and Fan, 2008). Similar action in the international wheat market includes both Ukraine and Argentina which, in the spring of 2007, initiated wheat export restrictions in efforts to control food price inflation. Pakistan placed taxes on wheat exports. By late February 2008, Kazakhstan officials set in place policies to slow their country’s wheat export pace(via higher custom
  • 28. duties), also due to declining supplies. By mid-April, Kazakhstan had converted its export slowdown into an outright ban. According to Schnepfh (2008) Argentina’s government policy of banning wheat and beef exports, slowing corn exports through procedural barriers at customs, and heavily taxing exports of soybeans is particularly noteworthy for three reasons. First, the export controls resulted in a nationwide farmers’ strike whereby producers refused to bring to market any agricultural products. Second, although the strike was temporarily suspended for 30 days starting on April 3, 2008, in an agreement between farmers and government that essentially left the export controls in place, the uncertainty surrounding Argentina as a reliable export supplier resulted in a substantial amount of purchase contracts being diverted to U.S. suppliers. Thus, already huge U.S. export numbers were further bolstered by the shift in demand from Argentinean to U.S. commodities. Third, Argentina’s strict export controls have had a major impact on that country’s agricultural prospects, at least in the short run, as most market analysts are now predicting a significant decline in Argentina’s planted area for wheat in 2008 (Schnepfh, 2008). Similar outcomes were observed in the 1974 crisis as a result of export restrictions on soybeans, wheat, rice and fertilizers. The tragedy of these restrictions is that they effectively sacrifice international price stability for the sake of domestic price stability, as Johnson (1975) noted after the 1974 crisis (Heady and Fan, 2008). 2.2.3. The Consequences of The Crisis A number of factors suggest that the recent surge in food prices had-an may still be having- a severe impact on the poorer populations of the world, perhaps even throwing more than 100 million people into poverty (Headey and Fan, 2008 from Ivanic and Martin, 2008; World Bank, 2008). All assumptions and predictions concerning the concequences of sharply rising food prices require much closer examination and often significant
  • 29. qualification. The group most vulnerable to rising food prices is generally the urban poor, but this group is also far more vociferous than the rural poor (Headey and Fan, 2008 from Bezemer and Headey, 2008). Thus, protests may be evidence of suffering, but not of net suffering: price changes always create winners and losers, and judging who is who requires accurate data and careful analysis at both the macro and micro level (Heady and Fan, 2008). Several studies estimated the impacts of rising food prices, but according to Heady and Fan (2010) they often generated unconvincing results, and most were limited by the absence of general equilibrium effects, country-specific price changes, and other relevant shocks, such as rising fuel prices. Moreover, judging who is negatively affected requires accurate data and careful analysis of food dependency, poverty/vulnerability, and price changes at both the micro and macro levels. A great deal of progress has already been made especially in micro-level, but a large gap still exists between micro- and macroassessments of the consequences of the crisis. A further distinction must also be made between the short and long terms. In the short term the adjustment costs of responding to rapid price changes may be prohibitively high and painfully slow. But even in the long term the ability of the poor to make adjustments depends on their access to productive assets and on national and international policies aimed at raising agricultural output or successfully pursuing other strategies to increase food security (Heady and Fan, 2010). Ideally, a full assessment of the short-term impacts of the crisis on poverty requires consideration of both macroeconomic impacts and transmissions, as well as household and intrahousehold effects, for both food and fuel price increases. However to partially bridge this gap, Heady and Fan (2010) analyze the Global Information and Early Warning System (GIEWS 2009) dataset on food prices in developing countries, the impacts on farmers remain unclear. OECD (X) reports that the impact of high food prices on
  • 30. developing countries depends on the interplay of various factors. In general, commercial producers of these commodities will benefit directly from higher prices. Livestock producers, on the other hand, are squeezed by both higher feed and energy costs and relatively flat prices. For farm households producing mainly for their own consumption or for local markets insulated from price fluctuations on national and international markets, the impacts will be mitigated. But for the urban poor and the major food importing developing countries, the impacts will be strongly negative as an even higher share of their limited income will be required for food. Each 10% increase in the prices of all cereals adds nearly USD 4.5 billion to the aggregate cereals import bill of those developing countries that are net importers of cereals. The impact of high agricultural commodity prices on developed countries is relatively modest, overall. The agricultural commodity price component of final food product prices is relatively small (very probably less than 35%), as is the proportion of disposable income spent on food (For many OECD countries its between 10 to 15 %). Of course these averages mask much more significant impacts on lower income consumers who spend a larger share of their expenditure on food. In addition, and to the extent that high prices persist and hence do not reduce the future rate of inflation, indirect economic impacts might also be important (OECD, 2008). 2.2.3.1. Macroeconomic impacts Many studies on the impacts refer solely to food prices, but any comprehensive assessment of current poverty trends needs to incorporate changes in a range of prices, including fuel costs and fertilizers. By effecting transport costs, exchange rates, foreign reserves, and domestic inflation oil prices have a pervasive effect on a country’s vulnerability to the recent crisis. That is why the most relevant macroeconomic assessments of the crisis incorporate the effects of rising oil prices (Heady and Fan, 2010). This section reviews the studies which cover the
  • 31. macroeconomic impacts such as Headey and Fan’s (2010) review of impact studies; Dawe’s (2008) study on the strength of transmission from international to domestic prices and IMF report (2008) and Aksoy and Ng’s (2008) study on the impact of rising food prices on import bills. 2.2.3.1.1. Import bills Aksoy and Ng (2008) calculate both food and general agricultural net import bills for low-, middle-, and high-income countries. While doing this, they disaggregate within each category by oil exporters, conflict states, small islanders, and “normal” countries. According to their study, once the three special groups are omitted, the typical “normal” low- and middle-income country has gone from being a net food importer in 1980/1981 to being a net food exporter in 2004/2005. However, Africa still contains a large number of oil exporters and conflict states, as well as other exceptions, meaning that most African countries (35 of 47) are still net importers of food, even though most are also net exporters of all agricultural goods (32 of 47). Moreover, only six low-income countries have food deficits that are more than 10 % of their imports, so most net food importing developing countries are marginal net food importers. Aksoy and Ng (2008) also identify countries with considerable potential to switch from being net exporters of non-food agricultural products to net exporters of food.This switch is much less relevant to the short-term impacts of the crisis, since switching from cash crops to food production may be time-consuming and costly. According to Aksoy and Ng (2008) the severity of food dependence is often overstated. One might regard the rise in oil prices as a more serious threat to macroeconomic stability in developing countries (Headey and Fan, 2010). According to IMF (2008), oil import costs are 2.5 times larger than food imports for low-income countries and twice as large for middle-income countries, so the impact of commensurate price increases is much greater for oil. The study argues that the absence of policy responses, the impacts of oil prices are considerably larger than those of increases in food
  • 32. prices. It estimates that for 33 net food-importing countries with available data, the adverse balance of payments impact of the increase in food prices from January 2007 to April 2008 is 0.5 % of 2007 annual GDP. During the same period, the impact of the increase in oil prices in 59 net oil-importing countries is estimated to be 2.2 % of GDP (IMF, 2008). Finally, although we have no data on overall terms-of-trade movements that factor into other commodities, we know that many net exporters of other minerals have also benefited from rising commodity prices to some extent, as have countries that are net exporters of labor to oil-producing countries (Headey and Fan, 2010). 2.2.3.1.2. Exchange rate movements and foreign reserves As noted before, a number of currencies have appreciated against the U.S. dollar, the currency in which food and oil exports prices are usually denominated. The euro area and the West African franc zone (which is pegged to the euro) have appreciated against the U.S. dollar by 80 % from 2002 to 2008. Thus the adverse effects of rising commodity imports for many West African countries should, all else being equal, be limited from a macroeconomic perspective. In contrast, the Central American and Caribbean area, which consists of currencies largely pegged to the U.S. dollar, and quite a large number of other countries around the world have experienced a stable rate of exchange with the dollar, while a few countries have experienced depreciation.In either case it is clear that although most countries have appreciated against the dollar, considerable variation remains in terms of countries’ vulnerability to rising dollar-denominated food and oil prices (Headey and Fan, 2010). By using commodity-specific, trade-weighted U.S. dollar exchange rate index of USDA (2008), Headey and Fan (2010) calculate that relative to dollar-denominated prices, export prices denominated in the currencies of other exporters of maize, wheat, and rice have declined by about 15–17 % from 2002 to 2008. According to them, the relationship between dependency on U.S. food imports and exchange rate movements
  • 33. should be investigated, because countries that are both dependent on the United States and have not benefited from appreciation against the dollar may be particularly vulnerable in a macroeconomic sense. Since the United States is the only highly dominant cereal exporter in the world, it is therefore worth investigating the relationship between dependency on U.S. food imports and exchange rate movements against the U.S. dollar. Such an analysis suggests that the regions that are most dependent on the United States as a source of food imports are Central America, the Caribbean, and some of the more northern countries of South America. A few other countries and regions are fairly dependent on the United States for food imports, but many such countries are either wealthy or experienced large real appreciations against the U.S. dollar.As for foreign exchange reserves, the International Monetary Fund has enumerated the months of imports as of the first quarter of 2008. Disconcertingly, the Caribbean and Central American countries appear to be highly vulnerable in this dimension as well. This evidence therefore suggests that, so far, it is the Central American and Caribbean countries that have been most vulnerable to rising U.S. dollar–denominated export prices because of their dependence on U.S. exports and their lack of any major compensating currency movements. Another indirect indicator that countries are suffering as a result of rising prices is the change in cereal imports in 2007 and 2008. USDA data suggest that most developing regions experienced declines of 10–20 % in 2007 or 2008 (Headey and Fan, 2010). 2.2.3.1.3. Transmission in domestic markets and the impact on inflation The steps of the transmission of rising international prices into domestic markets are the conversion of dollar-denominated international prices into local currency prices and domestic policies that alter the local price of foods. However, the effects of these factors are generally bundled together as a residual which reflects a range of other factors. Thus it may be possible that the change in domestic prices is very high, even though
  • 34. there is little transmission of international prices (Heady and Fan, 2010). Heady and Fan (2010) argues that both commodity-specific prices and consumer price indexes can be used to assess to what extent the international prices be transmitted to domestic markets. According to them, commodity-specific approaches are useful for assessing transmission proper, including the impacts of exchange rate movements. In principle, the food consumer price index (CPI) is more comprehensive and should be a better indicator of welfare costs, especially when it is deflated by the non-food CPI to look at the terms of trade for food, or real food-price trends. FAO’s study (Dawe, 2008) on the recent crisis reanalyzes the extent of price transmission in seven large Asian countries from the fourth quarter of 2003 to the fourth quarter of 2007, a period which admittedly does not capture the full international price increase, especially in rice. Overall transmission—measured as the ratio of LCU (local currency units) denominated retail price changes to U.S. dollar-denominated export prices—varied considerably among the seven countries. In India, the Philippines, and Vietnam, the pass through was just 6–11%, but in the remaining countries it was 41–65%. Interestingly, movements in the real exchange rate explain more than half of the price difference between U.S. dollar-denominated export prices and LCU denominated local currencies, the main exception being Bangladesh. Dawe (2008) also found that transmission of wheat prices appeared to be partial in India and Indonesia, but fully transmitted in Bangladesh (Dawe, 2008). Price changes ca be determined from recent trends on inflation such as the food inflation (WHO, 2008) for 2007 and the beginning of the year 2008. Other researchers such as Headey and Fan (2008) base their data regionally and with it to show non-food inflation. The results that they present is from estimates on householf food expenditures. To determine food price change they calculate the difference betweent food and non food inflation. Food inflation in all aread was 9.5% to 18%
  • 35. which is a very high percentage. This is not an accurate representation however. Averagely, Africa has experienced lower food inflation in comparison to non food inflation compared to other continents. To extract the inflation data from the the regions that are constitute Outliers, the reserchers grouped smaller regions in the ecompasing area and used inflation data from the year 2005 to 2008. For example,in one case they used data from 5 key expoters in Africa. The data derived from this was consistent to estimates made earlier. The first consistency was that price rose in countries with domestic issues like weather probles and conflict; those countries were Kenya, Myanmar and Ethiopia. Ghana is considered an outlier country but its also a country whose rise in transmission tell a different story. Although this country imports basic cereal like wheat, rice and maize, the dietary patterns are very diverse and the ghanaian currency has experienced appreciation against the universally accepted Dollar. For Ghana as a country, the inflation that it experiences is due to large remitances, oil prices and government spending. Yemen is a perfect example of a country that is price increase sensitive since it is almost entirely dependent on imports. A total of five mineral exporting countries faced inflation die to rising export earnings and what is commonly refered to as the Dutch Disease. Nigeria is an example of a country which has non food inflation passing specific food inflation. Dependence on oil and rice imports and reduced chances of opportunities of exchanging currencies have caused inflation in some Ssouth Asian countries. Central Asian countries have also suffered due tothe Dutch Disease. Low earning countries in central and caribbean countries have also experienced high inflation naturally. In african countries, the selected groups have recorded iflation of between 6-8 percent per year with West Africa registering the lowest inflation perhaps due to being tied closely to the Euro. This means that althoughh the African countries are vulnerable to economic dynamism, food inflation is cushioned by the fact that many African Households are net food buyers which means that the
  • 36. actual food prices have not had such an impact in Africa (Headey and Fan, 2008). The buffer that is provide by the depreciation of the dollar currency is not permanent when it comes to the larger price transmissions. There is a school of thought that suggests that the Euro is highly overvalued which suggests that the dollar might be on the rise soon. The result of this is that ultimately west African countries will have a faster rate of price transmission. Secondly, transmissions may be low due to government involvement which will be most likely discourage price rises. The World Bank (2008) shows that as many as 84 countries have reduced significantly the taxes imposed on food while another 30 countries have put up export restrictions in various forms. The Imternational Monetary Fund estimates that these action have reduced signifintly the price of food and fuel. It is estimated that the iposed taxes and subsidies transfer the burden from the markets to the government and in fact, this burden is estimated to incresed the percentage deficits by at least 1 percent. Faulure to do this means that government would have to cut back on other exenditures that are important on for the poor such as health expenditure. Whether the mechanisms that are employed by the governments through taxes, subsidies and export restrictions are to absorb price rises is not clear but due to its importance, it merits further investigations. The second aspect that is noteworthy is the tax and transfer programs implications on distribution.Essama-Nssah (2008) give a clearer picture with a conceptional analysis and review . Arndt et al. (2008) gives an analysis of the implication of rising food prices in Mozambique. Due to the complexity of transmission mechanisms, the full transmission of the international prices is time consuming. Whilst food prices can be imported, food exporters also experience increase in prices. For example,in a country like Uganda, the increase in food prices is not due to diersity in dietary patters but due to rising food prices in neighbouring price in countries like Kenya and Tanzania. The reason for this is the fact prices in neighbouring
  • 37. countries put pressure on prices of the local markets (Benson, 2008). It is worth noting that not all regions within a country are affected the same. It is often the case that rural areas are not affected as much as urban areas when in comes to international price changes (Codjoe et al., 2008; Ulimwengu et al., 2008). This further shows that there is need to conduct additonal reserch that combines factors affecting both macro and micro economic issues (Headey and Fan, 2008). 2.2.3.2. Microeconomic vulnerability to rising food prices Several papers follow Ivanic and Martin’s (2008) study of 9 countries across several continents in using microeconomic data to simulate the impacts of rising food prices on household poverty (Heady and Fan, 2010). This section reviews the studies which cover a range of countries and use quite similar methodologies despite their different sample sizes and scopes. These studies are the study by Ivanic and Martin (2008); the study by Wodon et al. (2008) of 12 West African countries; and the study by Dessus et al.(2008) of the urban sector of 73 developing countries. The basic approach in these papers follows Deaton (1989) in estimating the change in food welfare (ΔWFood) as the product of the food net-benefit ratio (NBRFood) and the change in food prices (ΔPFood): ΔWFood = ΔPFood × NBRFood = ΔPFood × (YFood/YTotal – CFood/CTotal), where YFood/YTotal is the ratio of food sales and own- production to total household monetary income, and CFood/CTotal is the ratio of food expenditure and own- consumption to total household expenditure. Notice that, by definition, own-production equals own-consumption, and because each enters into YFood/ YTotal and CFood/CTotal, respectively, the consumption of food produced by the household is netted out of NBRFood. Hence the main issues with microeconomic assessments of the poverty impacts concern the size of price changes, the numbers of net buyers and sellers, and the choice of poverty line (Heady and Fan, 2010). None of these papers assesses the most likely impact on poverty
  • 38. because: a) They simulate results from admittedly quite recent macroeconomic surveys, b) They assume domestic food price changes for lack of actual data, c)They assume a limited range of behavioral responses by consumers and producers, d) Their surveys may overestimate net food consumers (see Aksoy and Isik-Dikmelik, 2008), e) They do not consider rising oil prices as a simultaneous shock to income and revenue streams, f) They do not factor in strong economic growth, which characterizes several developing countries that have been benefiting from strong commodity prices, g) The absence of better measures. They use international poverty lines which can potentially make a considerable difference to the results(Heady and Fan, 2010). According to Heady and Fan (2010), in addition to these general limitations, the individual studies have some specific limitations. Wodon et al. (2008) consider different food items for different countries, which generally constitute dissimilar shares of total consumption, casting some doubt on whether their results are highly comparable. Dessus et al. (2008) only examine the effects of aggregate food consumption on urban poverty, assuming constant shares of food expenditures and fixed food/non-food elasticities across countries. Moreover, their estimates often contradict findings from the other two studies. These cross-country microeconomic studies point to the possibility of marked increases in hunger, but they do not provide reliable indications of the actual effects of rising food prices on poor and vulnerable people (Heady and Fan, 2010). The net effect created by these stimulations implies those that would be vulnerable to soaring prices and not the populations that experiance difficulties as a result of the rapidly increasing food prices. since not one of the expreiments incorporated real price changes. As indicated above, the shifting nature of food prices is substantially variant from one country to the other, but the assumption made in this study is that only the common price varies across countries. However, these studies have a way of providing perspective and empirically applicable data for highlightinng vulnerability to shifting prices across countries
  • 39. and subnational clusters( e.g urban and rural) Three studies clrearly point out the poverty change incidences(poverty headcounts) and also the level of the changes(for instance poverty gaps). Particularly the studies by Ivanic and Martin (2008) and Wodon et al. (2008) have greatly influenced the aspect of framing the responses of the Worldbank toward the crisis(World Bank, 2008) and as well enhancing other institutions' support. These four studies as well have incorporated useful comparisons, including similar simulation techniques microeconomic surveys. Some of the similarities listed are ,firstly, four of the papers focus on actuel shifts in food prices and not entirely all prices of fertilizers, although the soaring oil prices could much more contribute to poverty than food prices would. Secondly, the studies have explored the aspect of the short-run effects through precluding the producer and consumer behavioral responses, as well as the general or partial equilibrium consequences on prices of food -all of which are all very crucial aspects. The four studies clearly agree with this concept and in addition the studies by Martin and Ivanic and Zezza et al. (2008) as well compute some partial equilibrium consequences on the income of households like robust tests. However neither of the studies come to a significantly varying finding from the rest, but not in the case of redistribution of the negative effects between rural and urban households by Ivanic and Martin’s computation of unskilled wage effects. That notwithstanding , it is a possibiliyy for the existence of behavioral responses to the shifting food prices even in the short-span period. For instance, many households that a re pooor oftenly undertake a diversified range of income sources and as such ma substantially broaden the scope of their farm- based activities even with the soaring food prices. Summarily, the major methodological framework applied is such that all studies have similiarities based on the approach of Deaton (1989) Most importantly, the prevalent consequences of the shifting
  • 40. food prices is dependent upon the number ogf the poor and vulnerable a.k.a above poverty line , regardless of whether these peple are net food buyers or sellers : marginal or not, but whether they are close to this characteristic. This calculus results into disturbing expectations through which the groups are expected to face difficulty should the food prices increase. The urban population is composed of an overwhelming number of net buyers but who are better off thatn their rural counterparts. However, we expect equally large number of net buyers in rural areas attributed to landlessness, low productivity, cash crop production as well as the prevalent number of nonfarm workers(Ahmed et al., 2007). One way in which we can say that the studies by Ivanic and Martin’s are suprisingly insightful is by considdering the fact that they implore that the rate of poverty increase in rural areas is higher than in urban areas – in all the three countries where the survey was conducted. For instance in Zambia, the rate of poverty increase in rural areas is three times the urban poverty rate, regardless of the fact that the two rates were initially at par(NB: poverty rates to not incorporate the vulnerable population). Much of consequences on rural poverty that arise from these simulations do not agree both with our initial intuitions as well as miscellaneous evidence on these aspects. According to the analysis on similar surveys as the ones by Ivanic and Martin (2008), done by Aksoy and Isik-Dikmelik (2008), the conclusions drawn were such that a)As much as poor households are more of net food buyers , approximately half of them are net marginal buyers and b) The average income of net buyers is usually higher than the one of net sellers in 8 out of the 9 countries in the study. An alternative explanation to the variations of rural poverty is the underestimation of the level of hown tmuch net sellers households are since the measure of consumption is usually hinged on production. Based on the same, rural household income cannot be calculated the same as in urban regions. As such, its possible that, some survey biases greatly affect these
  • 41. stimulations, although the strength bias is still unknown to us. The last issue relates to the diversified nature of microeconomic vulnerabilities inter-countrywide. There are various factors that obviously influence household vulnerabilities to shifting food prices in different countries. According to Zezza et al. (2008), disaggregates vulnerability aspect among groupd, explaining vulnerability measures using OLS regressions. Of the 13 3rd world countries, they point out that the most vulnerable households are those : with less educated people, rural nofarm, with dependency on female laborers, landless and practicing modern agricultural practices. As much intuitive as all the findings are, its noteworthy that the microeconomic evidence confirms our intuitions and also offering magnitudes to the most crucual household attributes in this study. In summary, the studies make suggestions that poverty , in the short run, is bound to increase on condition that food prices rise substantially. Zezza et al. (2008) emphasizes on the household types most vulnerable to food price increase. The limitations of these stimulationare also crucial. Consequently, it is important to study about real price shifts and the adiitional consequences of fuel and fertilizer price increase as well as the short-term responses in the behaviors due to rising food prices and contributing effects of government policies to these outcomes. 3. MATERIALS AND METHODS 3.1. Methodology This study derives categorical data from the qualitative data in order to quantitatively analyze different media coverage of urban consumers and rural producers under changes in relative incomes. Content analysis (CA), which is a method of chancing qualitative data into quantitative data, is chosen as a main method in the present study. Moreover, a summative approach to qualitative content analysis which goes beyond mere word counts to include latent content analysis (Hsieh and Shannon, 2005) is adopted in order to know the frequency of words that were used to refer to food crisis but also to understand the
  • 42. underlying contexts for the use of explicit versus implicit terms related with food crisis. A technique which combines summative approach to content analysis and regression analysis is a new technique in economics studies. 3.1.1. Content Analysis Content analysis is a research method that uses a set of systematic, rule-guided techniques used to gather and analyze the content of text (Weber, 1990; Mayring, 2000). ‘‘The ‘content’ refers to words, meanings, pictures, symbols, ideas, themes, or any message that can be communicated. The ‘text’ is anything written, visual, or spoken that serves as a medium for communication.’’ (Neuman, 1997). Berelson (1952) suggests that describing substance characteristics of message content; describing form characteristics of message content; making inferences to producers of content; makeing inferences to audiences of content; predicting the effects of content on audiences are main purposes of content analysis. There are several types of content analysis including quantitative and qualitative methods all sharing the central feature of systematically categorizing textual data in order to make sense of it. They differ, however, in the ways they generate categories and apply them to the data, and how they analyze the resulting data (Forman and Damschroder, 2008). Comparing qualitative content analysis with its rather familiar quantitative counterpart may enhance the understanding of the method. Qualitative content analysis is used in order to explore the meanings underlying physical messages while quantitative content analysis is used widely in mass communication as a way to count manifest textual elements. Qualitative content analysis is mainly inductive, grounding the examination of topics and themes, as well as the inferences drawn from them while quantitative content analysis is deductive, intended to test hypotheses or address questions generated from theories or previous empirical research. samples for qualitative content analysis usually consist of purposively selected texts which can inform the research questions being investigated while
  • 43. quantitative content analysis requires that the data are selected using random sampling or other probabilistic approaches, so as to ensure the validity of statistical inference. The qualitative approach usually produces descriptions or typologies, along with expressions from subjects reflecting how they view the social world while the quantitative approach produces numbers that can be manipulated with various statistical methods (Zhang and Wildemuth, 2009). In real research work, the two approaches are not mutually exclusive and can be used in combination (Zhang and Wildemuth, 2009). As Weber (1990) points out, the best content-analytic studies use both qualitative and quantitative operations. 3.1.1.1 Qualitative Content Analysis Qualitative content analysis is one of many qualitative methods used to analyze textual data. It is a generic form of data analysis in that it is comprised of an atheoretical set of techniques which can be used in any qualitative inquiry in which the informational content of the data is relevant. Qualitative content analysis stands in contrast to methods that, rather than focusing on the informational content of the data, bring to bear theoretical perspectives. (Forman and Damschroder, 2008). Qualitative content analysis has been defined as a research method for the subjective interpretation of the content of text data through the systematic classification process of coding and identifying themes or patterns (Hsieh and Shannon, 2005). It is an approach of empirical, methodological controlled analysis of texts within their context of communication, following content analytic rules and step by step models, without rash quantification (Mayring, 2000). It emphasizes an integrated view of speech/texts and their specific contexts. It goes beyond merely counting words or extracting objective content from texts to examine meanings, themes and patterns that may be manifest or latent in a particular text. It also allows researchers to understand social reality in a subjective but scientific manner
  • 44. (Zhang and Wildemuth, 2009). In quantitative content analysis, data are categorized using predetermined categories that are generated from a source other than the data to be analyzed, applied automatically through an algorithmic search process (rather than through reading the data), and analyzed solely quantitatively (Forman and Damschroder, 2008 from Morgan, 1993). The categorized data become largely decontextualized. (Hsieh and Shannon, 2005). Hsieh and Shannon (2005) discusses three approaches to qualitative content analysis, based on the degree of involvement of inductive reasoning. The first approach is conventional qualitative content analysis, in which coding categories are derived directly and inductively from the raw data. Conventional content analysis is generally used with a study design whose aim is to describe a phenomenon. Is is the approach used for grounded theory development. The advantage of this approach to content analysis is gaining direct information from study participants without imposing preconceived categories or theoretical perspectives. The second approach is directed content analysis, in which initial coding starts with an existing theory or prior research findings. Then, during data analysis, the researchers immerse themselves in the data and allow themes to emerge from the data.It is guided by a more structured process than in a conventional approach. The purpose of this approach usually is to support or extend a conceptual framework or theory.The third approach is summative content analysis, which starts with identifying and quantifying certain words or content in text with the purpose of understanding the contextual use of the words or content, then extends the analysis to include latent meanings and themes. This approach seems quantitative in the early stages, but its goal is to explore the usage of the words/indicators in an inductive manner because it goes beyond mere word counts to include latent content analysis whichrefers to the process of interpretationof content (Hsiesh and Shannon, 2005) 3.1.1.2. Summative Approach to Qualitative Content Analysis
  • 45. Summative analysis was recently introduced as a new qualitative analytic technique for social science. It is developed to effectively manage, organize, and clarify large bodies of qualitative, textual data that are complex or cover sensitive topic areas. It works best with diverse data, whether snippets of text, or long, meandering tracts. It enables data that do not fit a mold to be considered, offering more flexibility of working, with sensitive support from others and enables researcher to be aware of more nuanced and ambiguous aspects of text (Rapport, 2010). Typically, a study using a summative approach to qualitative content analysis starts with identifying and quantifying certain words or content in text with the purpose of understanding the contextual use of the words or content. This quantification is an attempt not to infer meaning but, rather, to explore usage. Analyzing for the appearance of a particular word or content in textual material is referred to as manifest content analysis (Hsieh and Shannon, 2005 from Potter and Levine-Donnerstein, 1999). If the analysis stopped at this point, the analysis would be quantitative, focusing on counting the frequency of specific words or content (Hsieh and Shannon, 2005 from Kondracki and Wellman, 2002). A summative approach to qualitative content analysis goes beyond mere word counts to include latent content analysis. Latent content analysis refers to the process of interpretation of content (Hsieh and Shannon, 2005 from Holsti, 1969). In this analysis, the focus is on discovering underlying meanings of the words or the content (Hsieh and Shannon, 2005 from Babbie, 1992; Catanzaro, 1988; Morse & Field, 1995). In a summative approach to qualitative content analysis, data analysis begins with searches for occurrences of the identified words by hand or by computer. Word frequency counts for each identified term are calculated, with source or speaker also identified. Counting is used to identify patterns in the data and to contextualize the codes (Hsieh and Shannon, 2005 from Morgan, 1993). It allows for interpretation of the context associated with the use of the word or phrase.
  • 46. Qualitative content analysis usinf the summative content analysis has several advantages. The first advantage is that it is nonobtrsive and non reactive (Babbie, 1992). İts provides indepth meaning on how words are used. The disadvantage however is the inattention arising from the present data. The reason for this is that this research depends on trustworthiness. The best way to show credibility is to show evidence from text is similar with the iterpretetion (Weber, 1990). Data analysis process is largely driven by the research question or aims of the research and begins with identifying and quantifying the core keywords in text. Word frequency counts for each identified keyword to classify textual data and identify patterns in it. The purpose is to understand the contextual use of the keywords, interpret the context associated with the use of the keywords and discover the content. Data analysis continues with quantitative analysis. The OLS regression model is applied to the categorical data derived from qualitative data. Finally, the results from qualitative and quantitative analysis are compared. 3.1.1.3. Computer Program for Support of Qualitative Content Analysis ATLAS.ti, a qualitative data analysis software, is used to support the coding process, such as linking source documents with notes and memos, coding the texts, retrieving them based on keywords and picturing the relationships of codes. ATLAS.ti is software for text analysis and model building. It handles graphical, audio, and video data files as well as text. With this package one can code and/or annotate text or media segments in a variety of ways, search/select segments by code, create hotlinks connecting segments, and display relationships among segments in diagrammatic format. One can use the automatic coding mode to code all similar segments according to defined patterns. Network diagrams, created with the built-in semantic network editor, can be exported to graphics and word processing packages and a built-in HTML generator creates web pages for sharing work with collaborators. Visually, annotations
  • 47. and links are made in a margin area of the computer display. However, ATLAS.tiis not a content analysis package per se, but rather a text management package lacking fundamental content analysis statistical functions. 3.1.2. The Ordinary Least Squares (OLS) Regression Ordinary least-squares (OLS) regression is a generalized linear modelling technique that may be used to model a single response variable which has been recorded on at least an interval scale. The technique may be applied to single or multiple explanatory variables and also categorical explanatory variables that have been appropriately coded. At a very basic level, the relationship between a continuous response variable (Y) and a continuous explanatory variable (X) may be represented using a line of best-fit, where Y is predicted, at least to some extent, by X. If this relationship is linear, it may be appropriately represented mathematically using the straight line equation 'Y = α + βx'. The relationship between variables Y and X is described using the equation of the line of best fit with α indicating the value of Y when X is equal to zero (the intercept) and β indicating the slope of the line (the regression coefficient). The regression coefficient β describes the change in Y that is associated with a unit change in X (Hutcheson, 2011). In addition to the model parameters and confidence intervals for β, it is useful to also have an indication of how well the model fits the data. Model fit can be determined by comparing the observed scores of Y (the values of Y from the sample of data) with the expected values of Y (the values of Y predicted by the regression equation). The difference between these two values (the deviation, or residual as it is also called) provides an indication of how well the model predicts each data point. Adding up the deviances for all the data points after they have been squared provides a simple measure of the degree to which the data deviates from the model overall. The sum of all the squared residuals is known as the residual sum of squares (RSS) and provides a measure of model-fit for an OLS regression