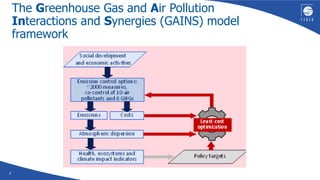
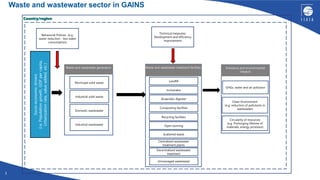
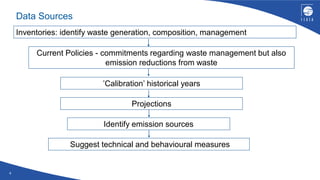
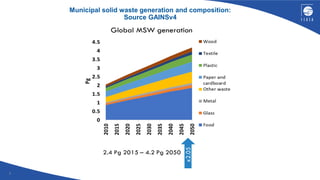
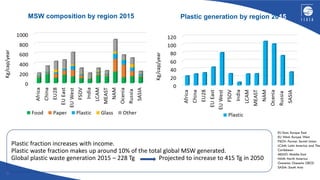
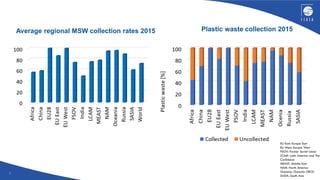
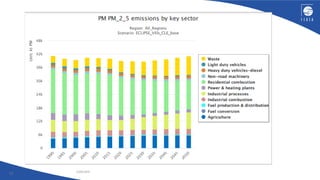
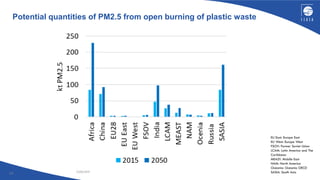
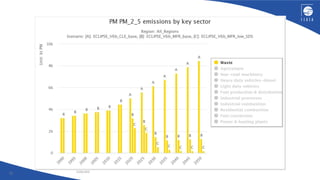
The Greenhouse Gas and Air Pollution Interactions and
Synergies (GAINS) model.
An overview of the plastic waste sector in the IIASA GAINS
Model
Adriana Gómez-Sanabria and Lena Höglund-Isaksson
June 2020
The Greenhouse Gas and Air Pollution
Interactions and Synergies (GAINS) model
framework
2
3
Country/region
Socio-economicdrivers
(i.e.Populationgrowth,GDPpercapita,
Urbanizationrate,valueadded,etc.)
Behavioral Policies (e.g.
waste reduction - less water
consumption)
Waste and wastewater treatment facilities
Landfill
Incinerator
Anaerobic digester
Composting facilities
Recycling facilities
Centralized wastewater
treatment plants
GHGs, water and air pollution
Technical measures:
Development and efficiency
improvement
Unmanaged wastewater
Waste and wastewater sector in GAINS
Industrial wastewater
Domestic wastewater
Industrial solid waste
Municipal solid waste
Waste and wastewater generation
Decentralized wastewater
treatment
Clean Environment
(e.g. reduction of pollutants in
wastewater)
Circularity of resources
(e.g. Prolonging lifetime of
materials, energy provision)
Emissions and environmental
impacts
Open burning
Scattered waste
4
Identify emission sources
Current Policies - commitments regarding waste management but also
emission reductions from waste
’Calibration’ historical years
Suggest technical and behavioural measures
Data Sources
Inventories: identify waste generation, composition, management
Projections
Projections: MSW generation per capita and composition
Depend on socio-economic characteristics, geographical location and environmental features
(UNEP and ISWA, 2015; Hoornweg and Bhada-Tata, 2012; SWEEPNET, 2012; Wilson et al.,
2012).
Municipal solid waste generation per capita
Projections of MSW generation per capita are based on the elasticity to GDP/cap (average
income per country) and urbanization rate for different income groups (Gómez-Sanabria et
al, 2018).
Municipal solid waste generation composition
Exploring: Future growth in food waste generation suppressed at higher income levels due to
its inferior goods nature. Share of organic waste declines as income increases (Chen et al,
2020). Shares of paper and plastic is higher in high income countries (Hoornweg and Bhada-
Tata, 2012).
6
Municipal solid waste generation and composition:
Source GAINSv4
7
MSW composition by region 2015 Plastic generation by region 2015
Plastic fraction increases with income.
Plastic waste fraction makes up around 10% of the total global MSW generated.
Global plastic waste generation 2015 – 228 Tg Projected to increase to 415 Tg in 2050
8
Average regional MSW collection rates 2015 Plastic waste collection 2015
9
North America, Oceania and Europe West have the highest plastic waste generation rates (~80 –
110 kg/cap/year), but also the highest plastic waste collection rates (>95%).
At a global level 30% of the total plastic waste generated is uncollected (underestimated????).
In 2015 global quantities of uncollected plastic waste reached 63 Tg and it is projected to increase
to 105 Tg in 2050 under the current waste management conditions.
Most of the uncollected plastic comes from India, Africa, China and South Asia.
Important facts according to GAINSv4 estimates
23/06/2020
10
Plastic waste treatment by region 2015
23/06/2020
11
Potential quantities of plastic waste entering rivers-lakes-ocean
12
38 Tg of plastic waste was scattered in 2015. Scattered plastic waste is projected to
increase to 64 Tg in 2050 under the current management conditions.
Assuming 20% of scattered plastic waste reaches the ocean (based on Jambeck et al,
2015): 8 Tg in 2015 projected to be 13 Tg in 2050. Values may be underestimated.
Most of the unmanaged plastic waste possibly comes from Africa and South Asia.
The focus should be on reducing waste generation and improving management systems
in low-income countries.
Important facts according to GAINSv4 estimates
23/06/2020
13
23/06/2020
14
Potential quantities of PM2.5 from open burning of plastic waste
23/06/2020
15
Thanks
Adriana Gómez-Sanabria
Research Scholar
Air Pollution and Greenhouse Gases
gomezsa@iiasa.ac.at
June 2020

OECD Modelling Plastics Use Projections Workshop - IIASA

  • 1.
    The Greenhouse Gasand Air Pollution Interactions and Synergies (GAINS) model. An overview of the plastic waste sector in the IIASA GAINS Model Adriana Gómez-Sanabria and Lena Höglund-Isaksson June 2020
  • 2.
    The Greenhouse Gasand Air Pollution Interactions and Synergies (GAINS) model framework 2
  • 3.
    3 Country/region Socio-economicdrivers (i.e.Populationgrowth,GDPpercapita, Urbanizationrate,valueadded,etc.) Behavioral Policies (e.g. wastereduction - less water consumption) Waste and wastewater treatment facilities Landfill Incinerator Anaerobic digester Composting facilities Recycling facilities Centralized wastewater treatment plants GHGs, water and air pollution Technical measures: Development and efficiency improvement Unmanaged wastewater Waste and wastewater sector in GAINS Industrial wastewater Domestic wastewater Industrial solid waste Municipal solid waste Waste and wastewater generation Decentralized wastewater treatment Clean Environment (e.g. reduction of pollutants in wastewater) Circularity of resources (e.g. Prolonging lifetime of materials, energy provision) Emissions and environmental impacts Open burning Scattered waste
  • 4.
    4 Identify emission sources CurrentPolicies - commitments regarding waste management but also emission reductions from waste ’Calibration’ historical years Suggest technical and behavioural measures Data Sources Inventories: identify waste generation, composition, management Projections
  • 5.
    Projections: MSW generationper capita and composition Depend on socio-economic characteristics, geographical location and environmental features (UNEP and ISWA, 2015; Hoornweg and Bhada-Tata, 2012; SWEEPNET, 2012; Wilson et al., 2012). Municipal solid waste generation per capita Projections of MSW generation per capita are based on the elasticity to GDP/cap (average income per country) and urbanization rate for different income groups (Gómez-Sanabria et al, 2018). Municipal solid waste generation composition Exploring: Future growth in food waste generation suppressed at higher income levels due to its inferior goods nature. Share of organic waste declines as income increases (Chen et al, 2020). Shares of paper and plastic is higher in high income countries (Hoornweg and Bhada- Tata, 2012).
  • 6.
    6 Municipal solid wastegeneration and composition: Source GAINSv4
  • 7.
    7 MSW composition byregion 2015 Plastic generation by region 2015 Plastic fraction increases with income. Plastic waste fraction makes up around 10% of the total global MSW generated. Global plastic waste generation 2015 – 228 Tg Projected to increase to 415 Tg in 2050
  • 8.
    8 Average regional MSWcollection rates 2015 Plastic waste collection 2015
  • 9.
    9 North America, Oceaniaand Europe West have the highest plastic waste generation rates (~80 – 110 kg/cap/year), but also the highest plastic waste collection rates (>95%). At a global level 30% of the total plastic waste generated is uncollected (underestimated????). In 2015 global quantities of uncollected plastic waste reached 63 Tg and it is projected to increase to 105 Tg in 2050 under the current waste management conditions. Most of the uncollected plastic comes from India, Africa, China and South Asia. Important facts according to GAINSv4 estimates
  • 10.
  • 11.
    23/06/2020 11 Potential quantities ofplastic waste entering rivers-lakes-ocean
  • 12.
    12 38 Tg ofplastic waste was scattered in 2015. Scattered plastic waste is projected to increase to 64 Tg in 2050 under the current management conditions. Assuming 20% of scattered plastic waste reaches the ocean (based on Jambeck et al, 2015): 8 Tg in 2015 projected to be 13 Tg in 2050. Values may be underestimated. Most of the unmanaged plastic waste possibly comes from Africa and South Asia. The focus should be on reducing waste generation and improving management systems in low-income countries. Important facts according to GAINSv4 estimates
  • 13.
  • 14.
    23/06/2020 14 Potential quantities ofPM2.5 from open burning of plastic waste
  • 15.
  • 16.
    Thanks Adriana Gómez-Sanabria Research Scholar AirPollution and Greenhouse Gases gomezsa@iiasa.ac.at June 2020