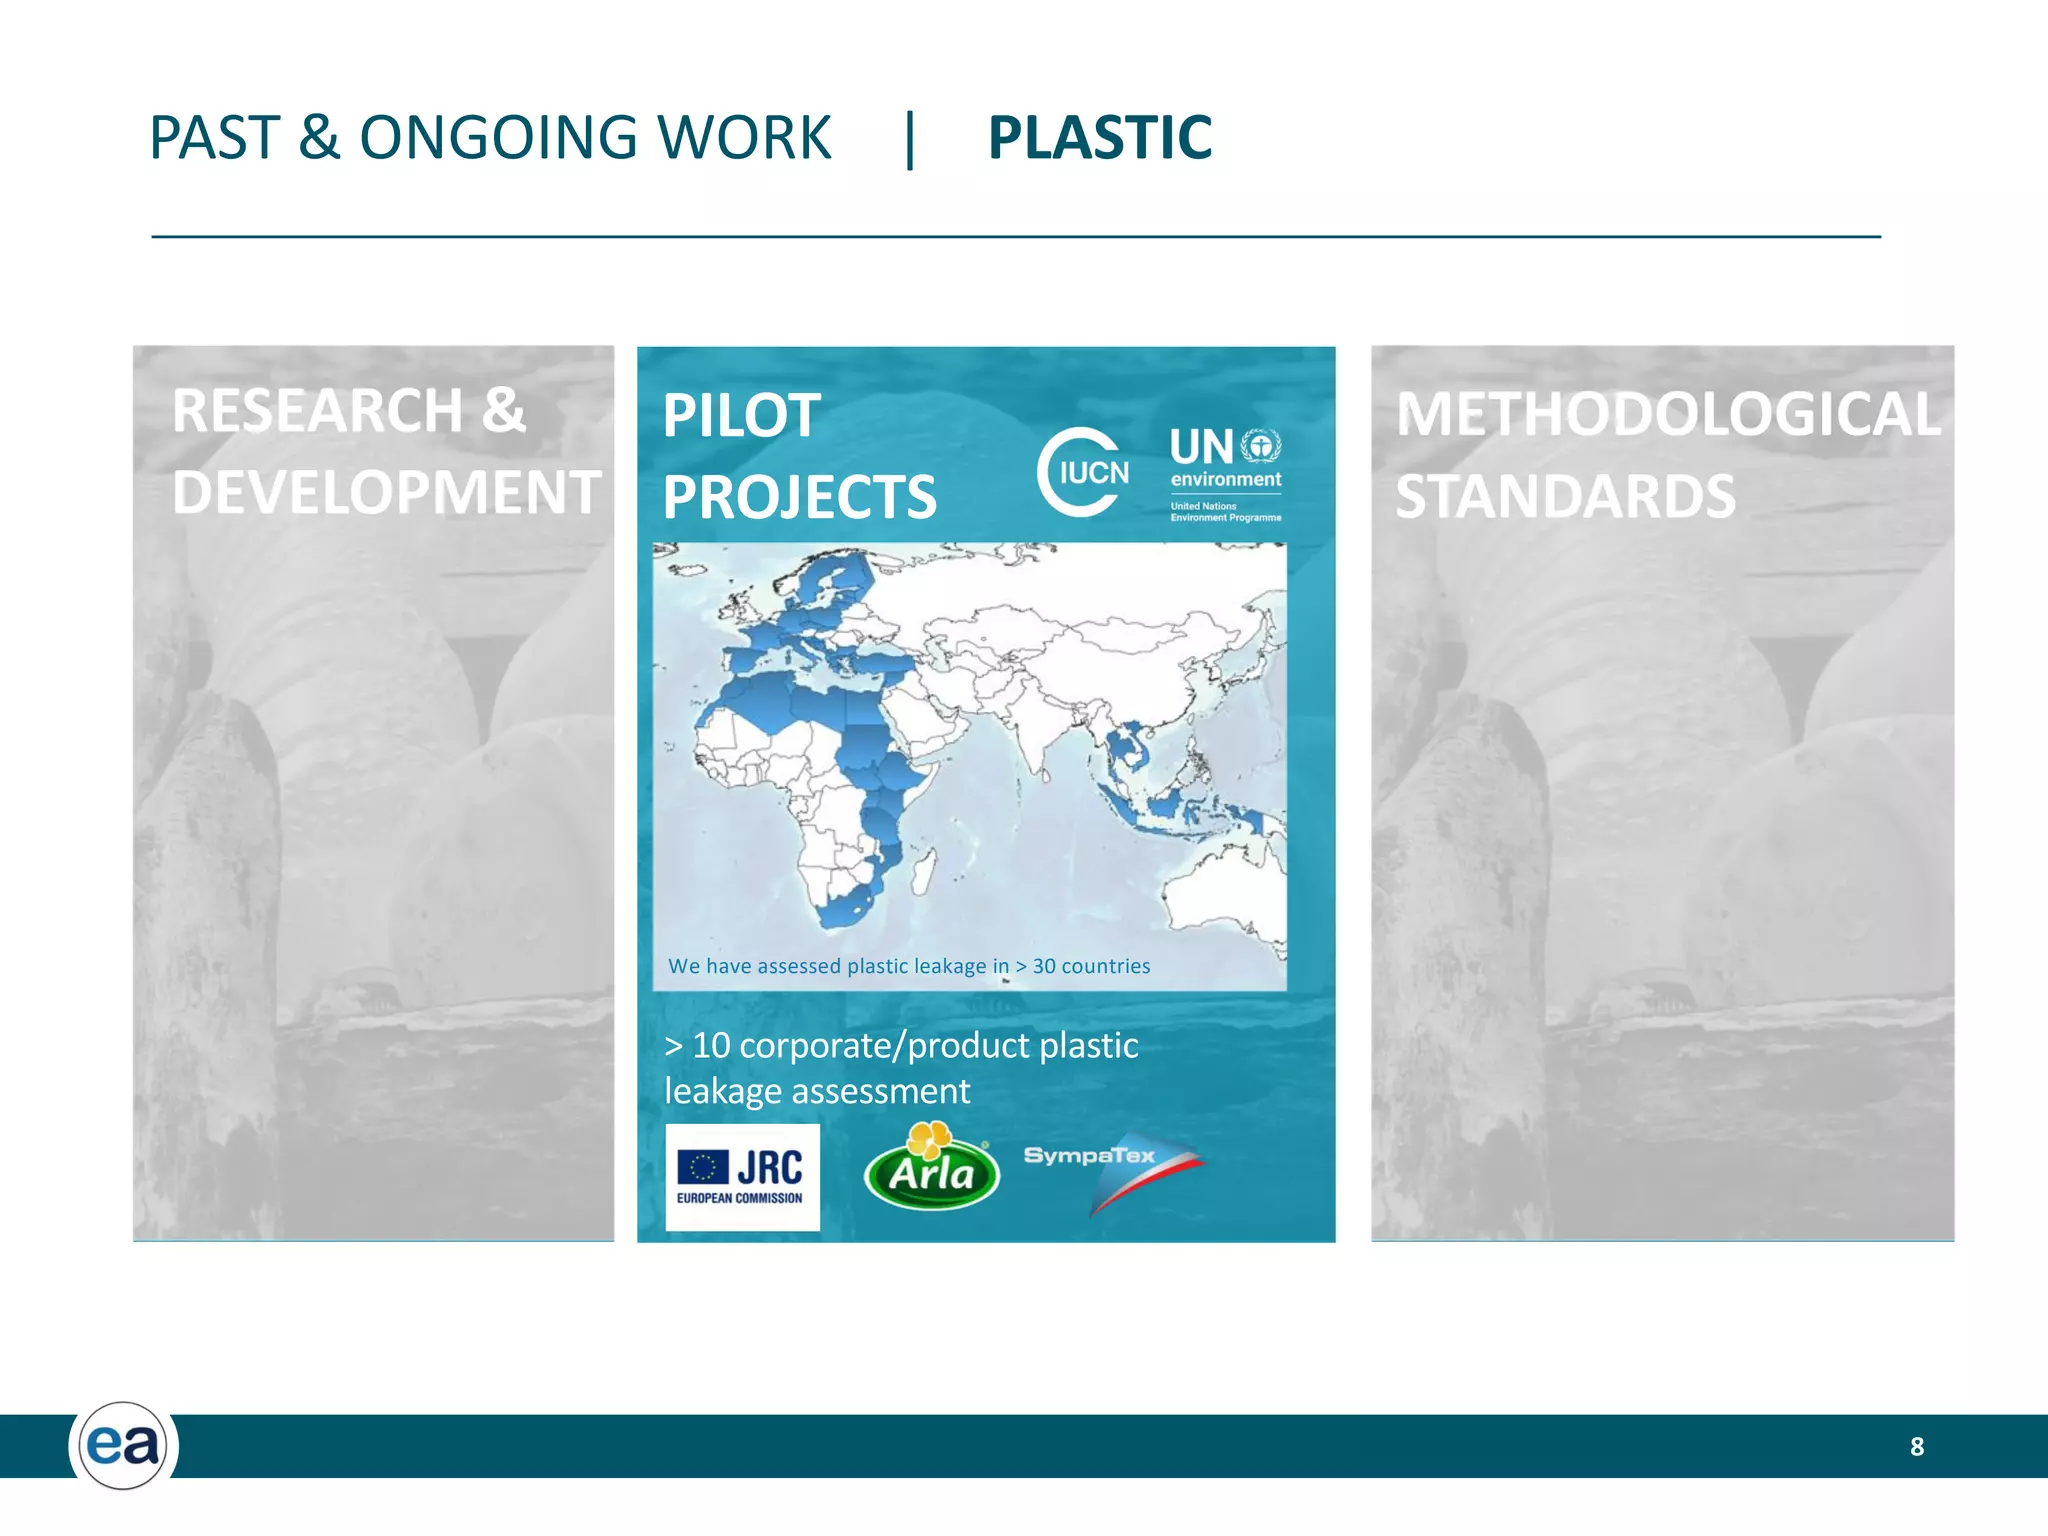
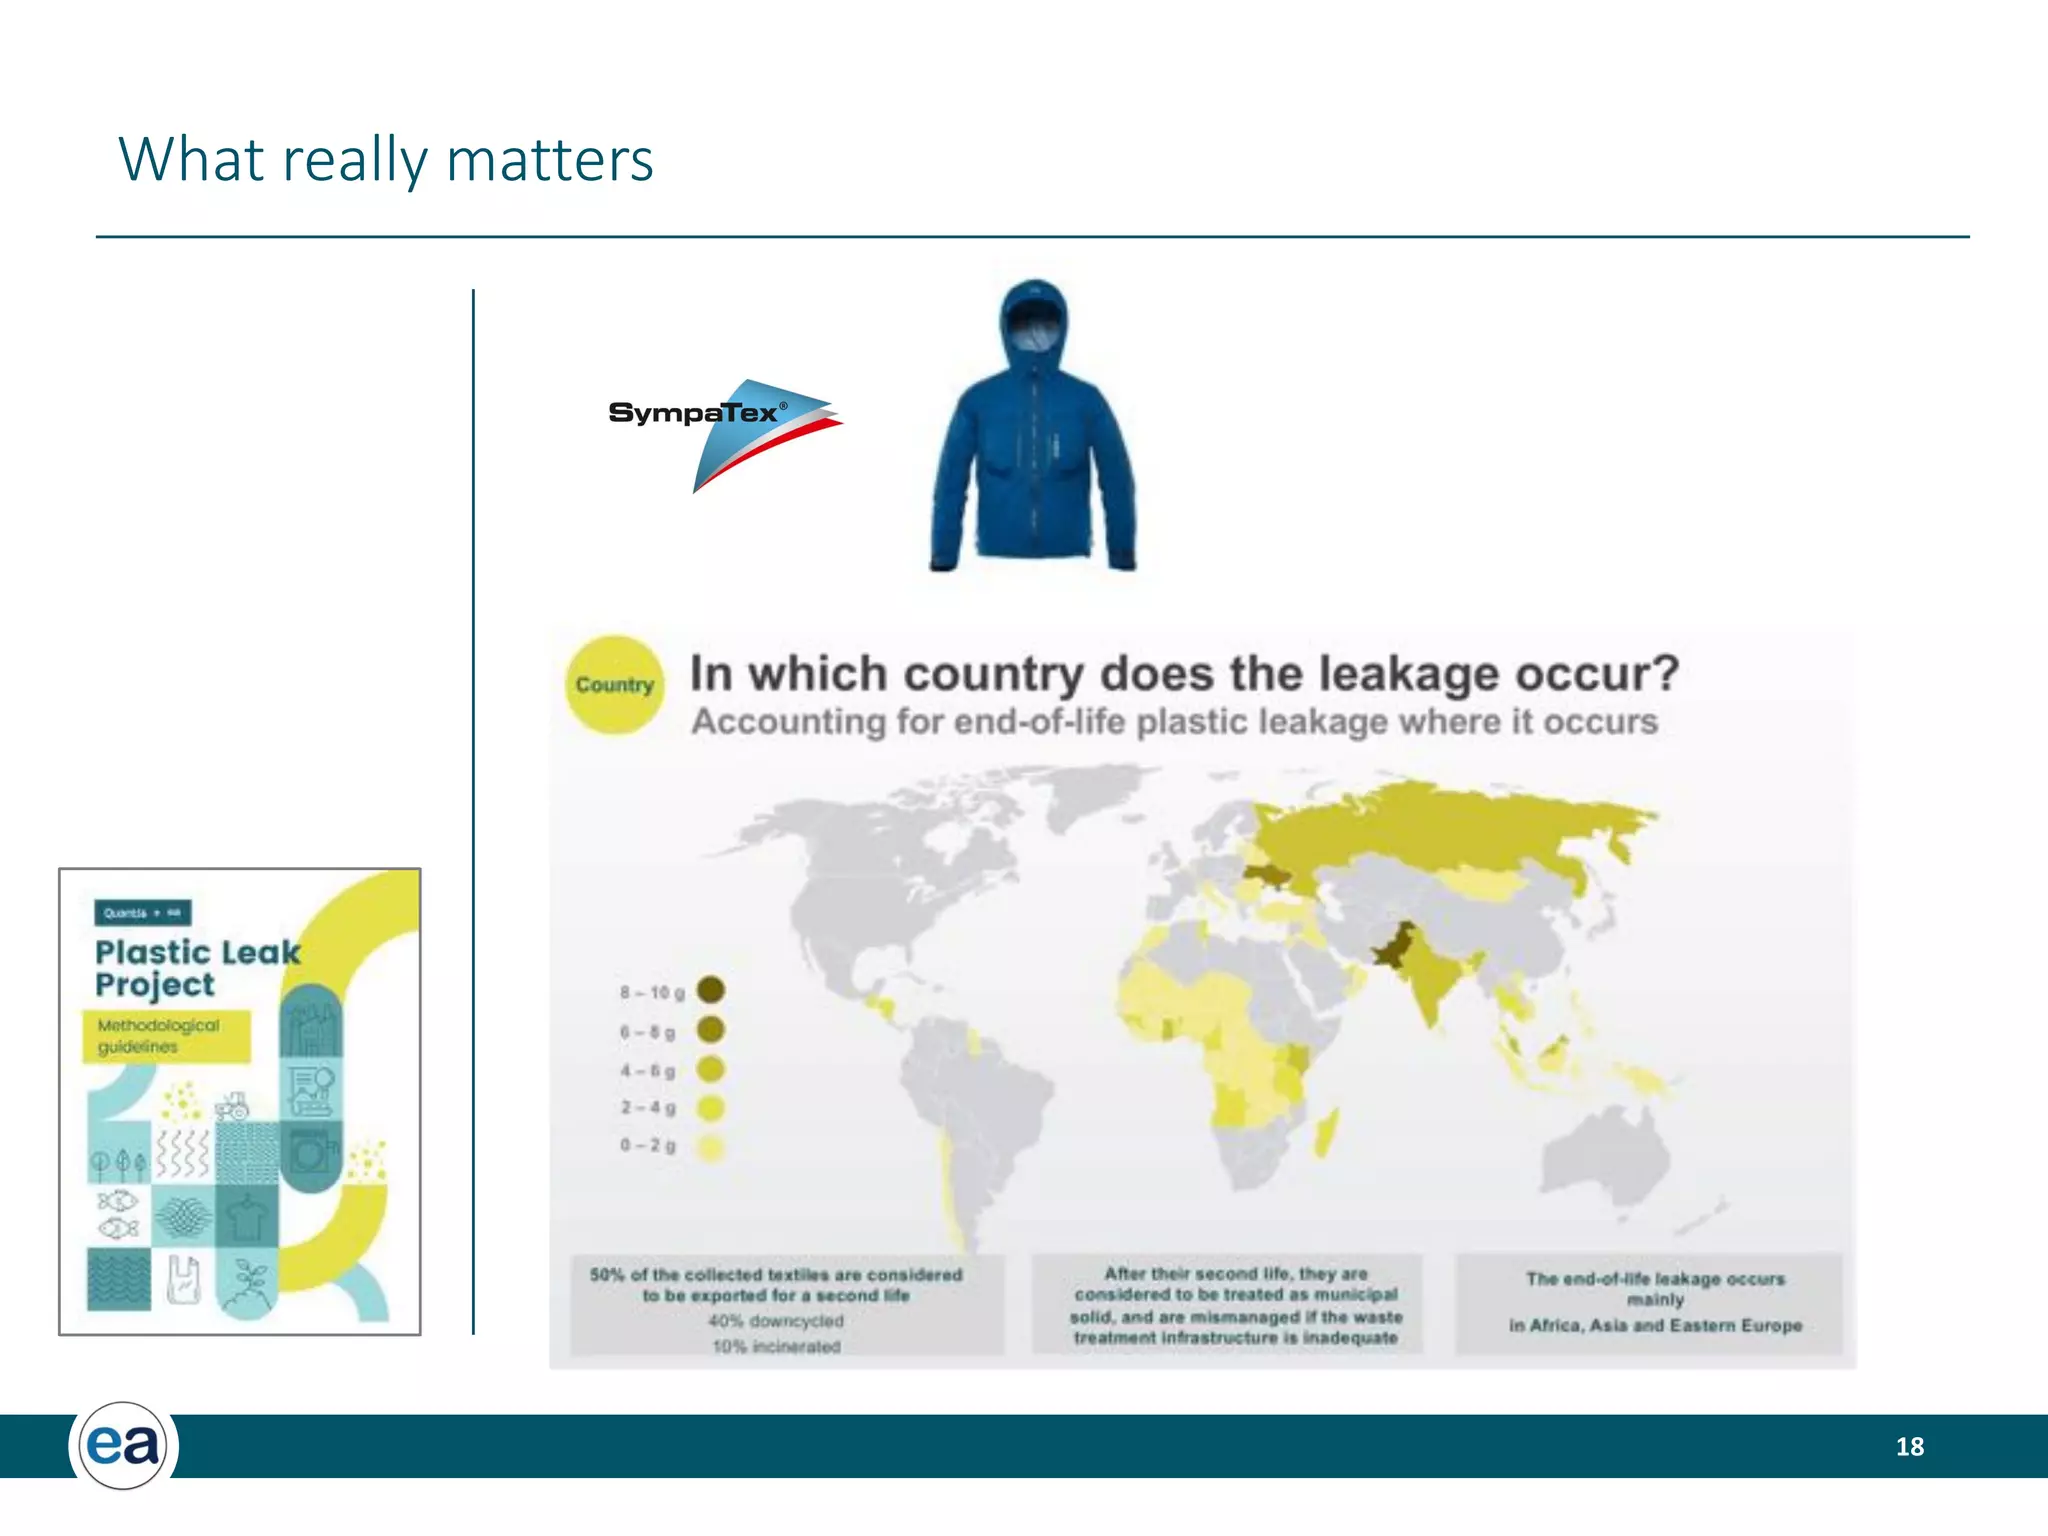
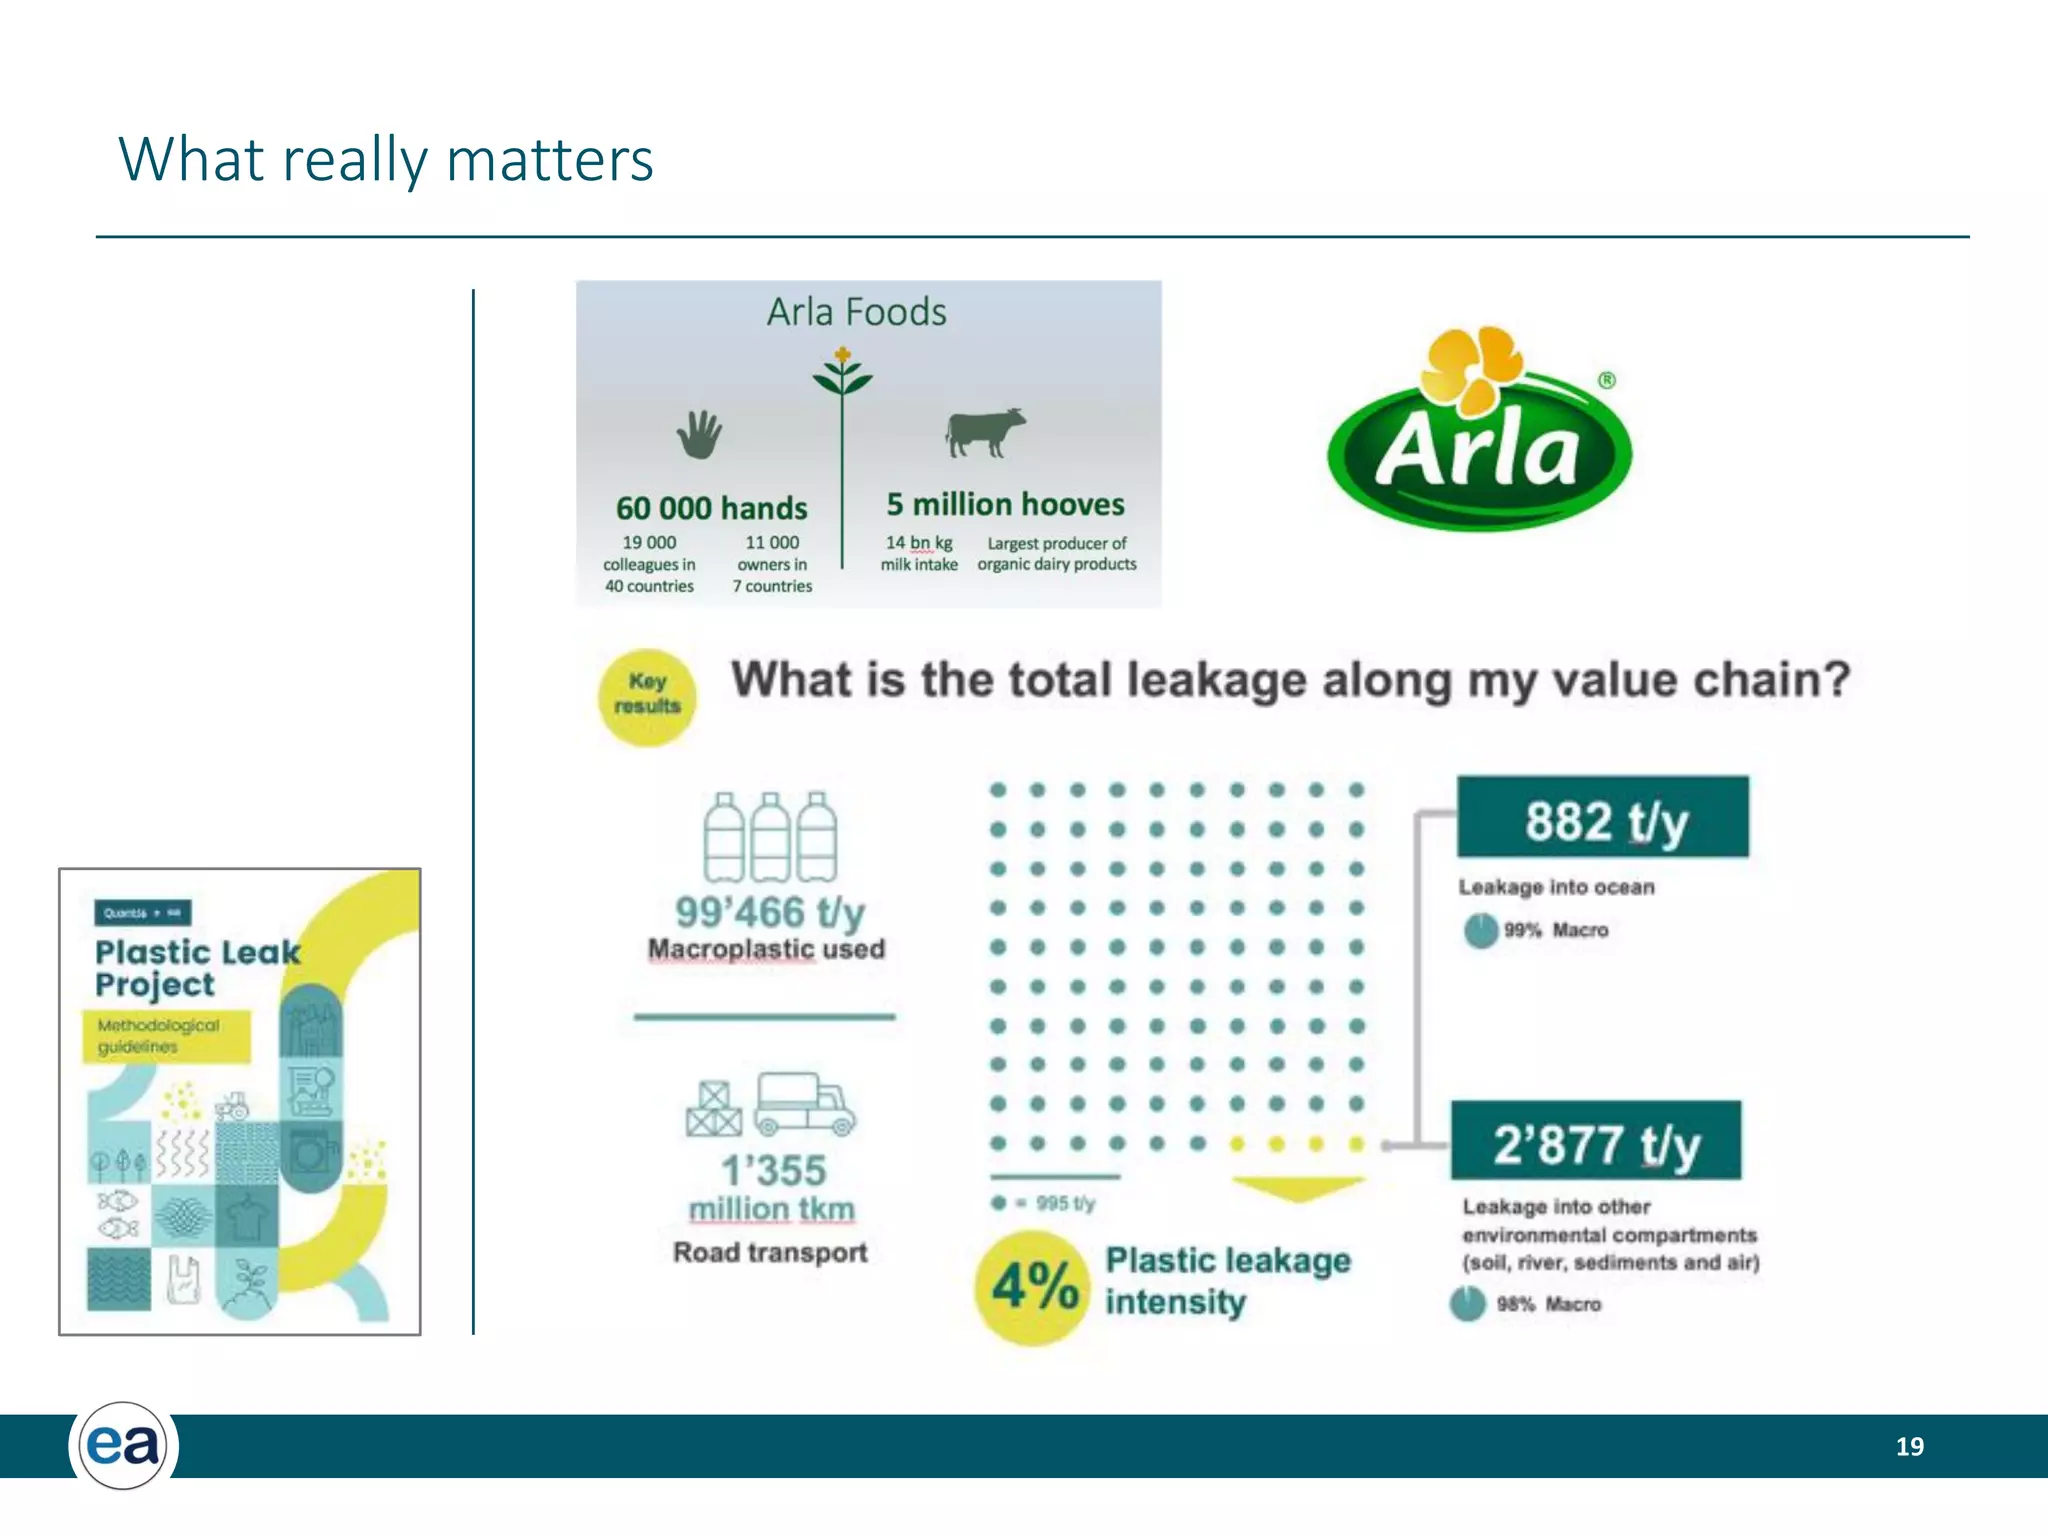
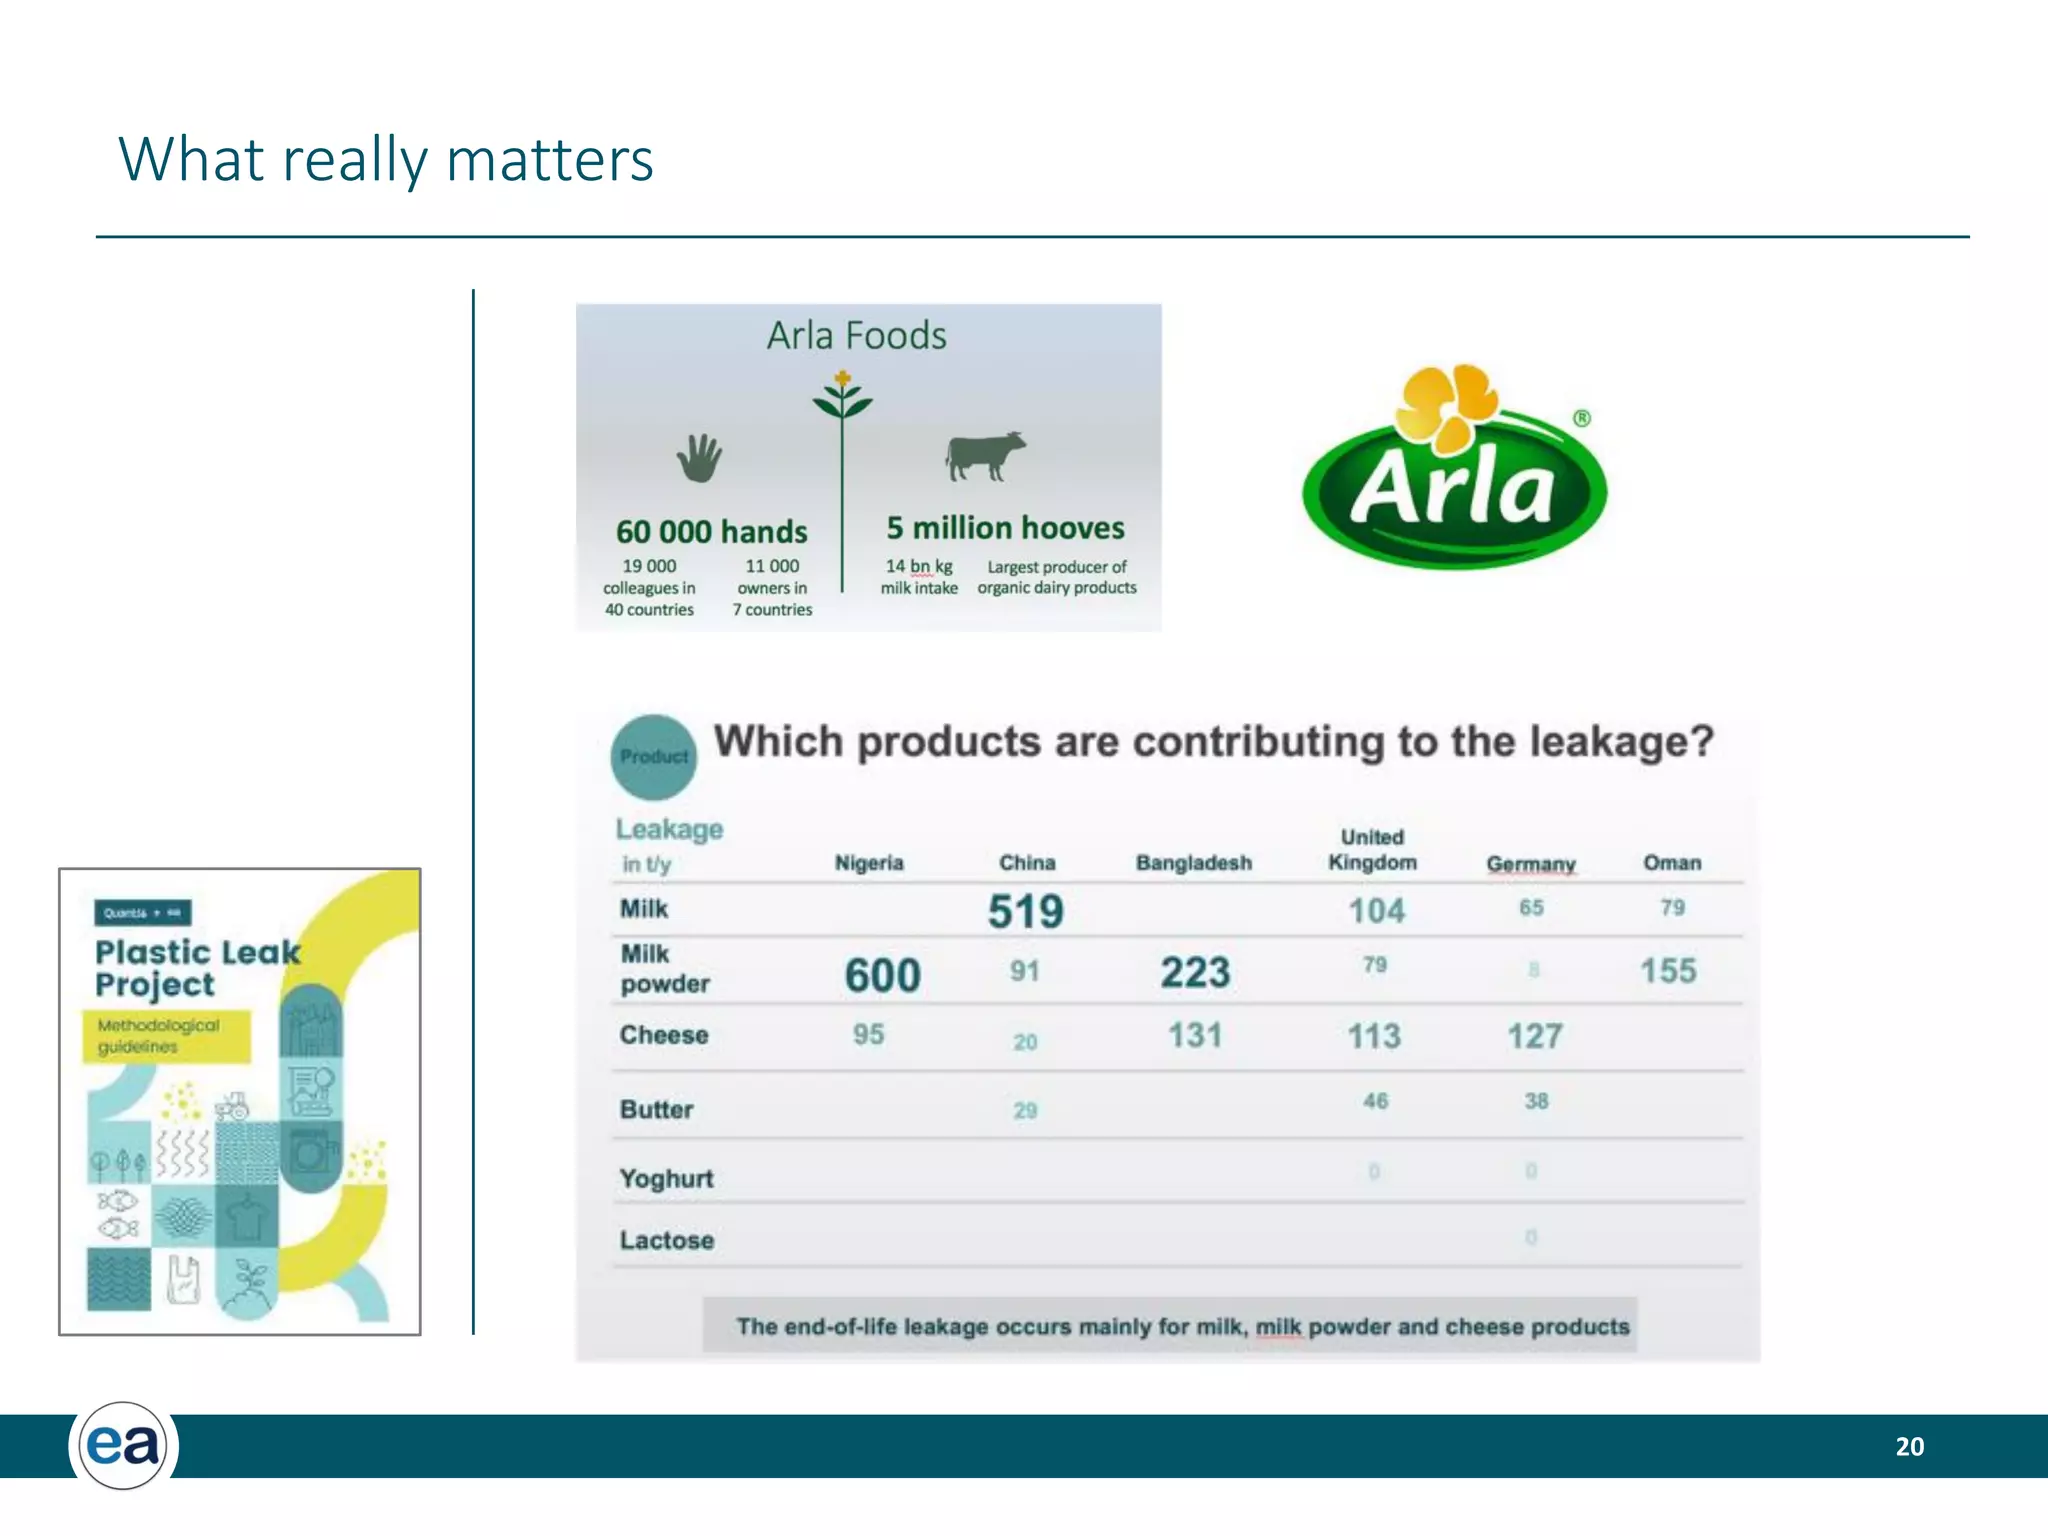
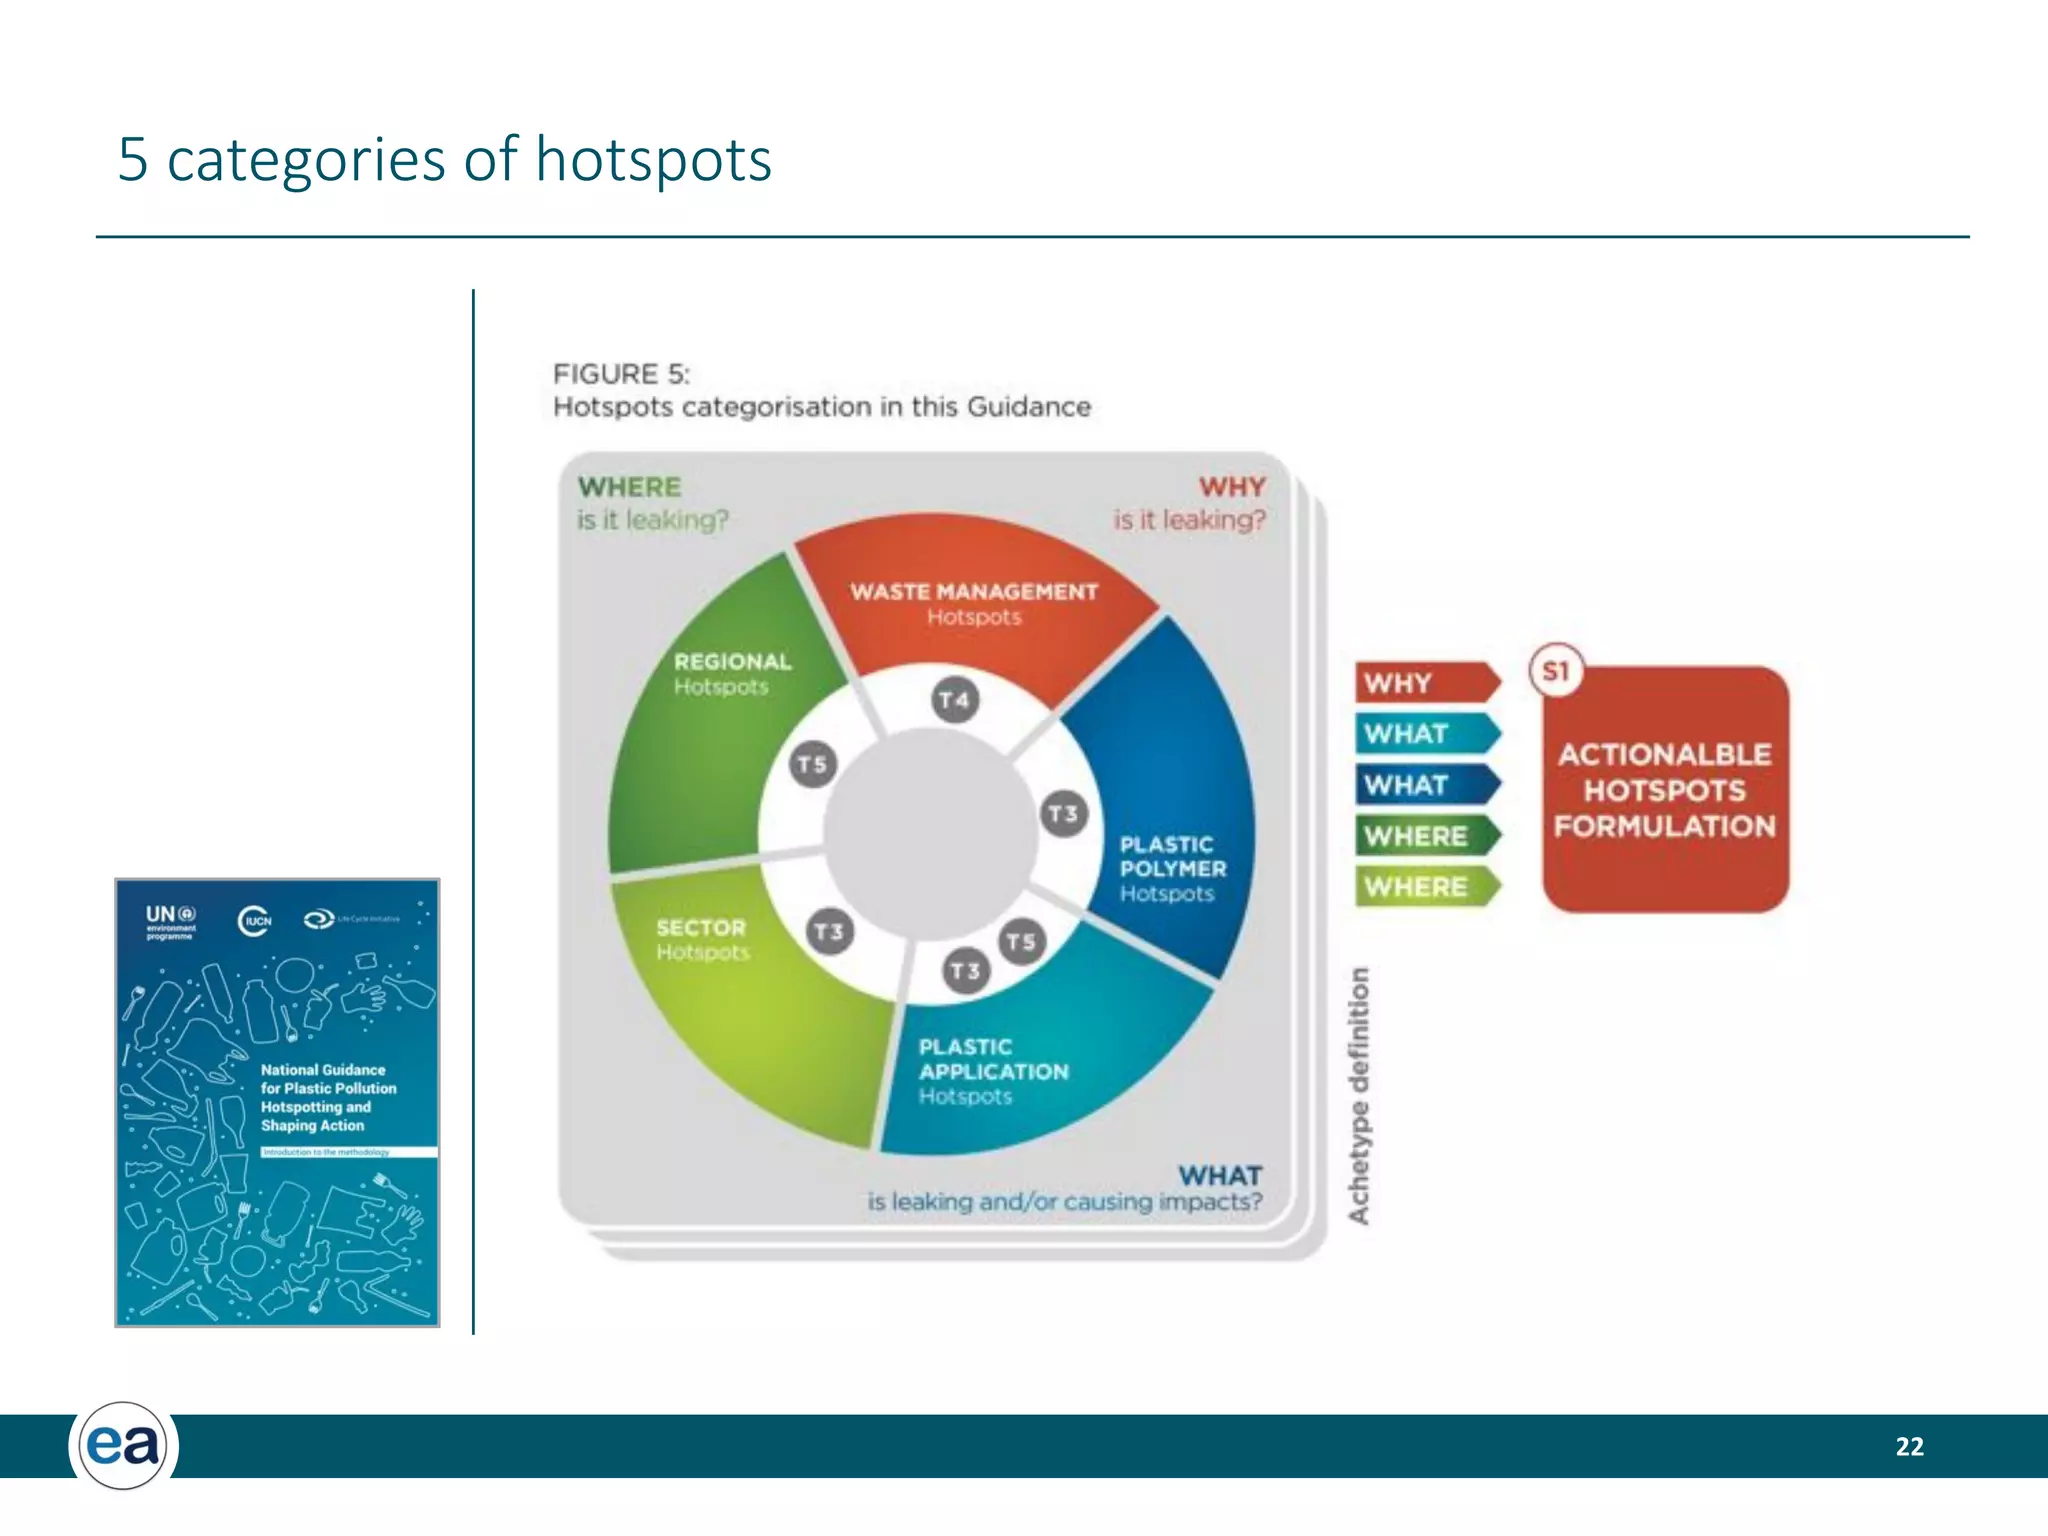
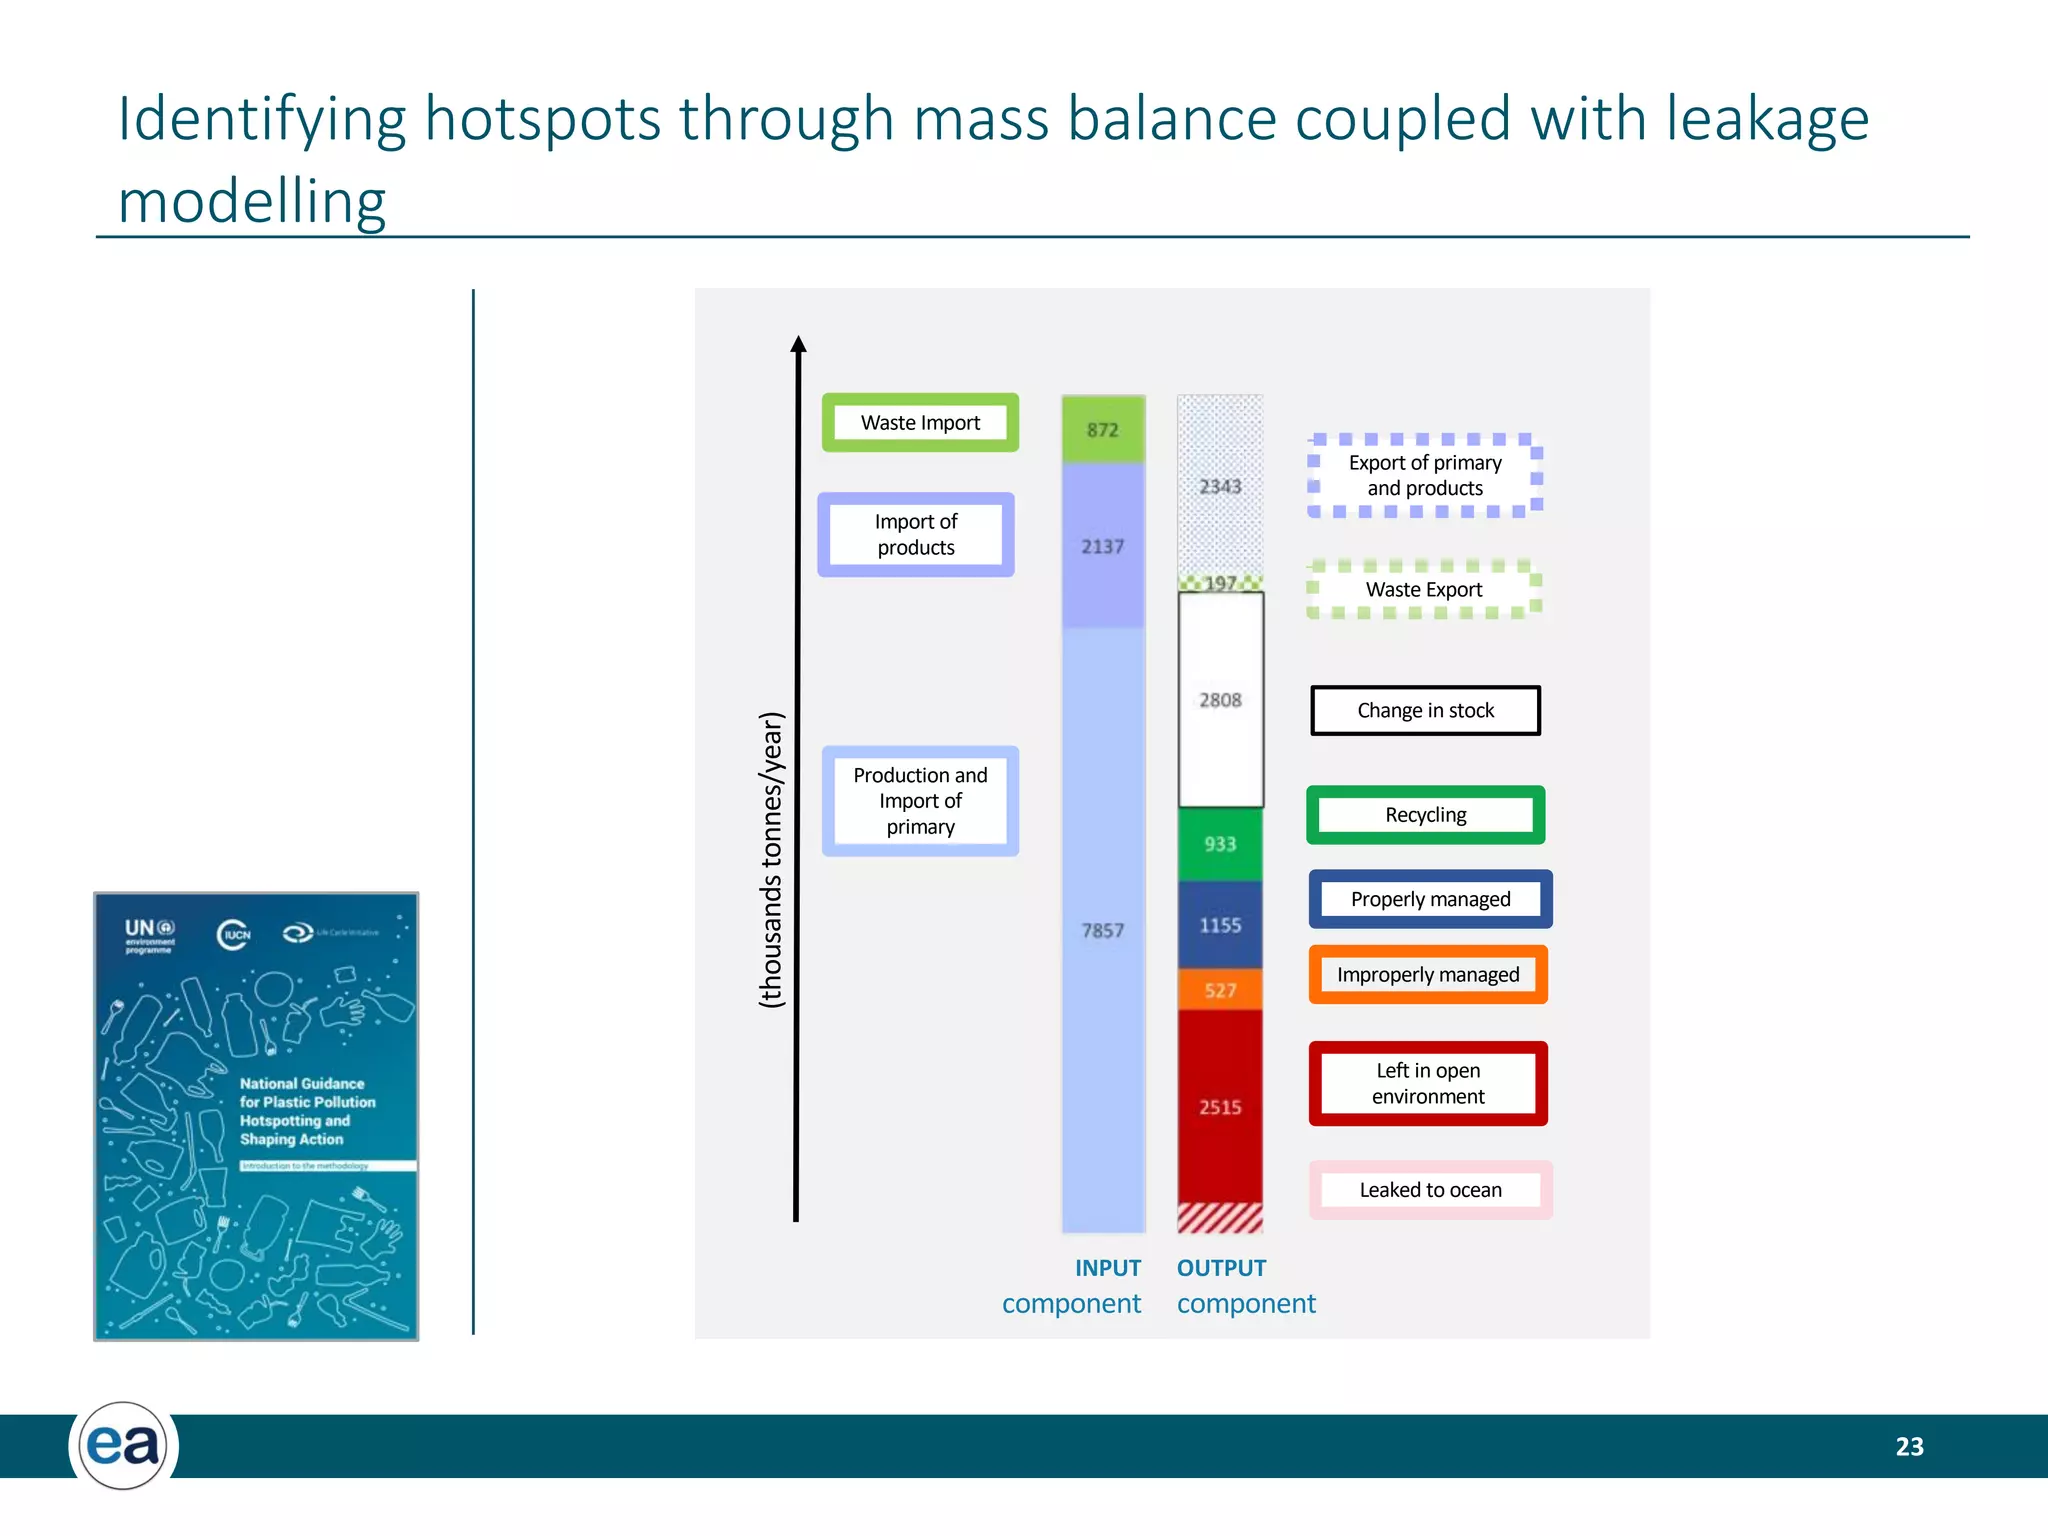
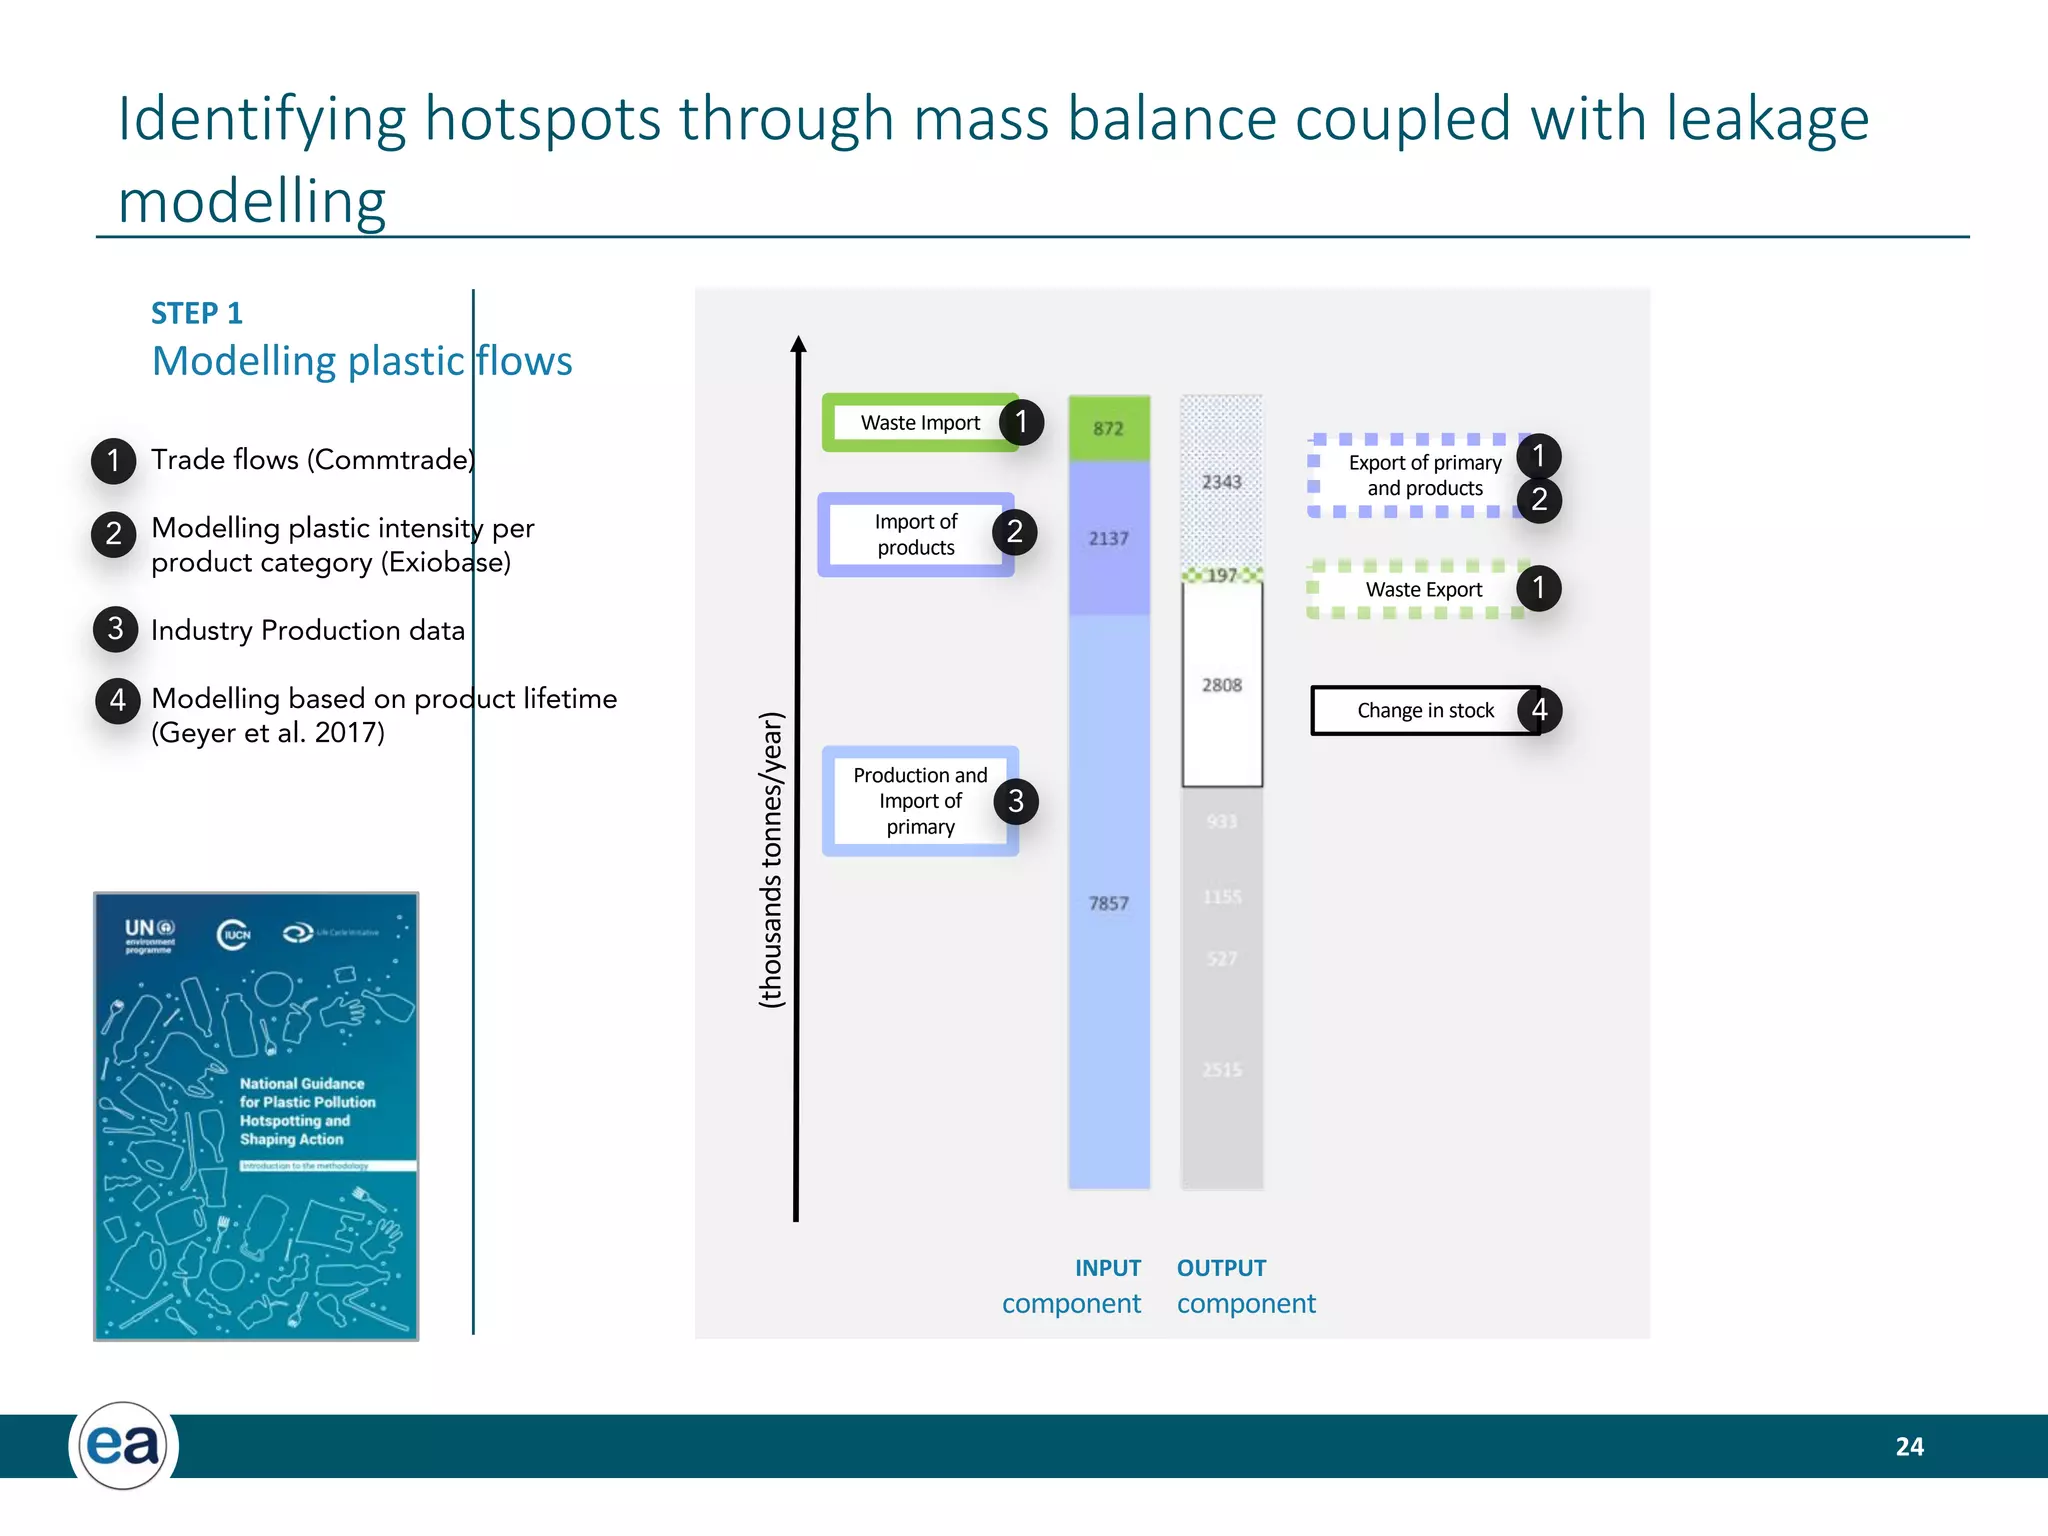
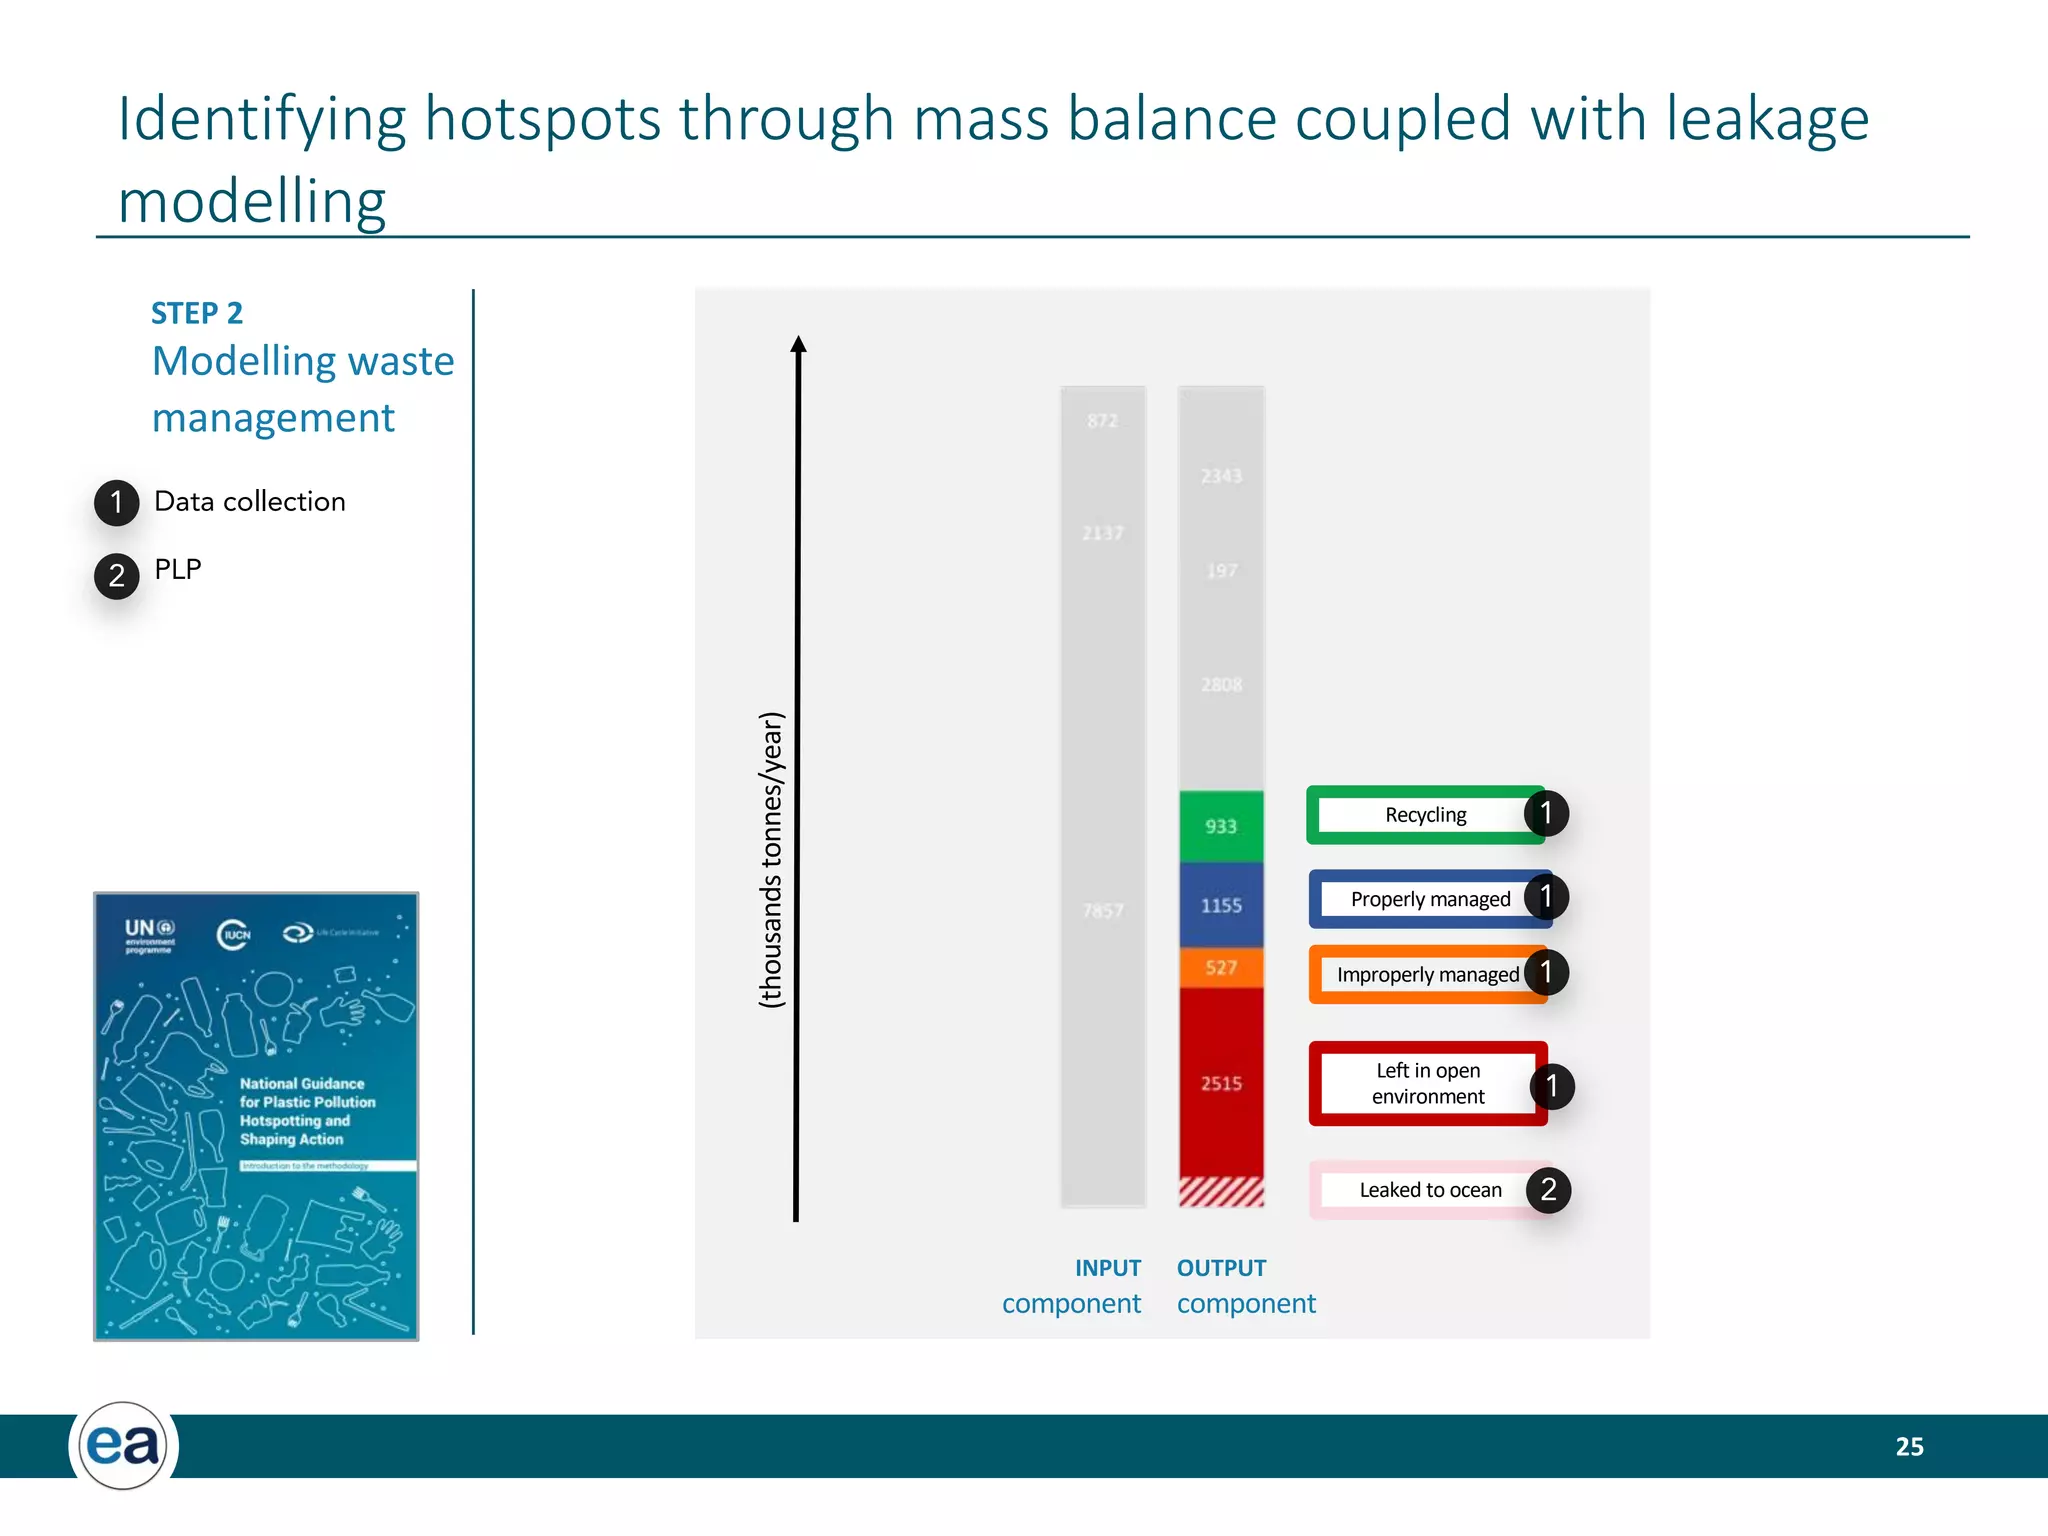
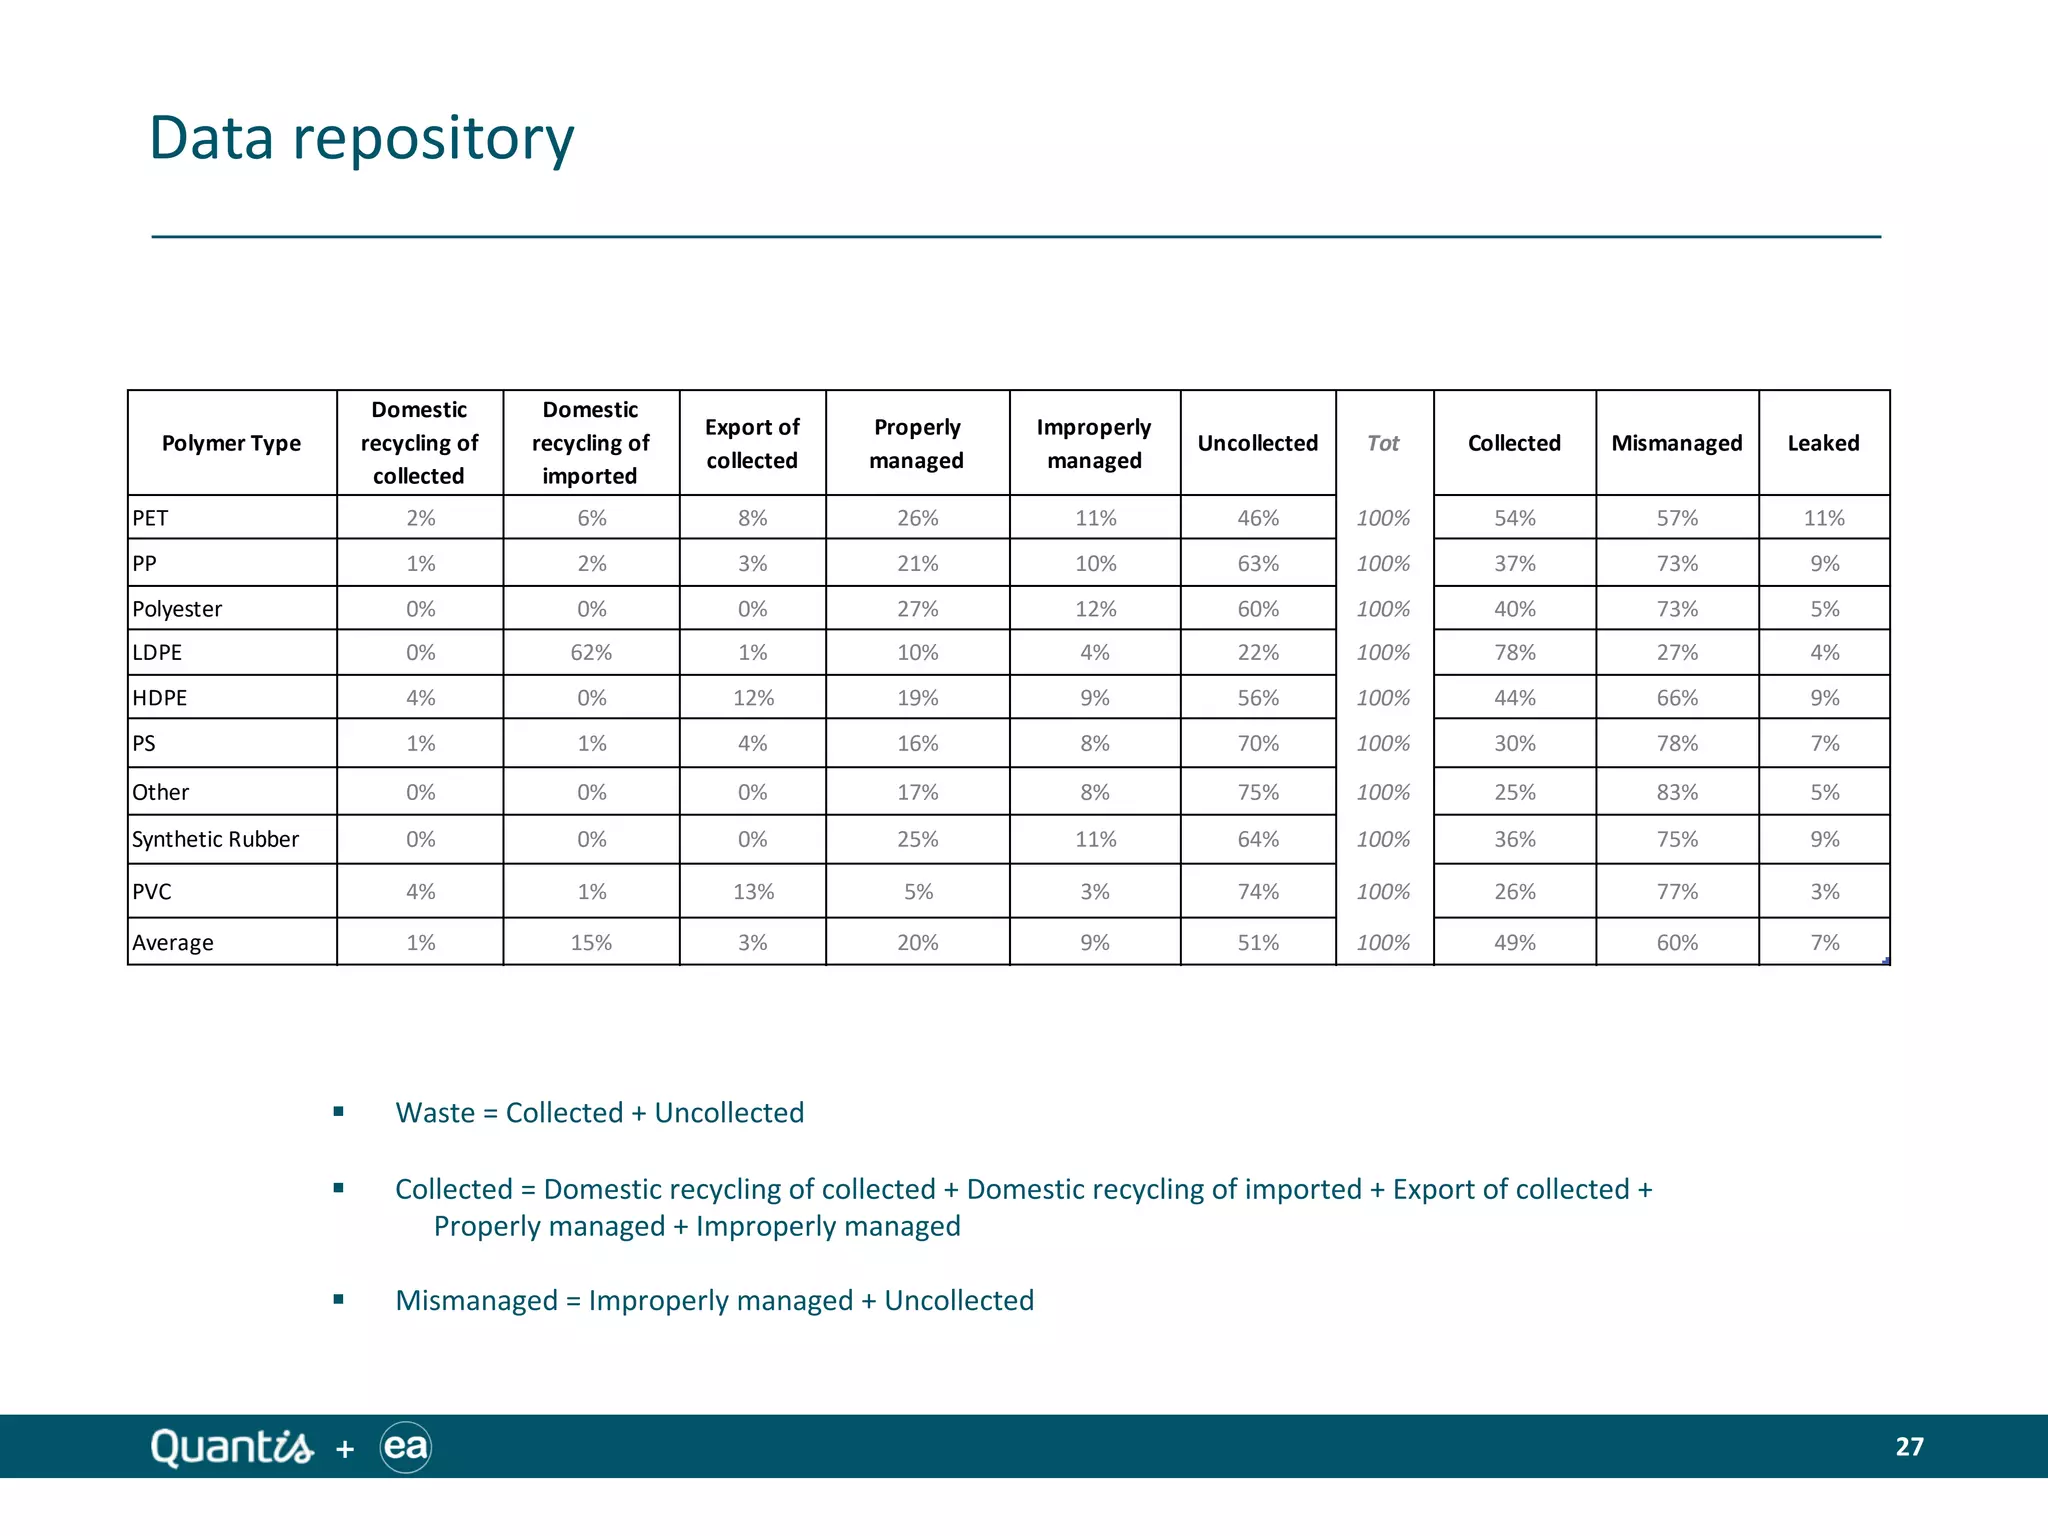
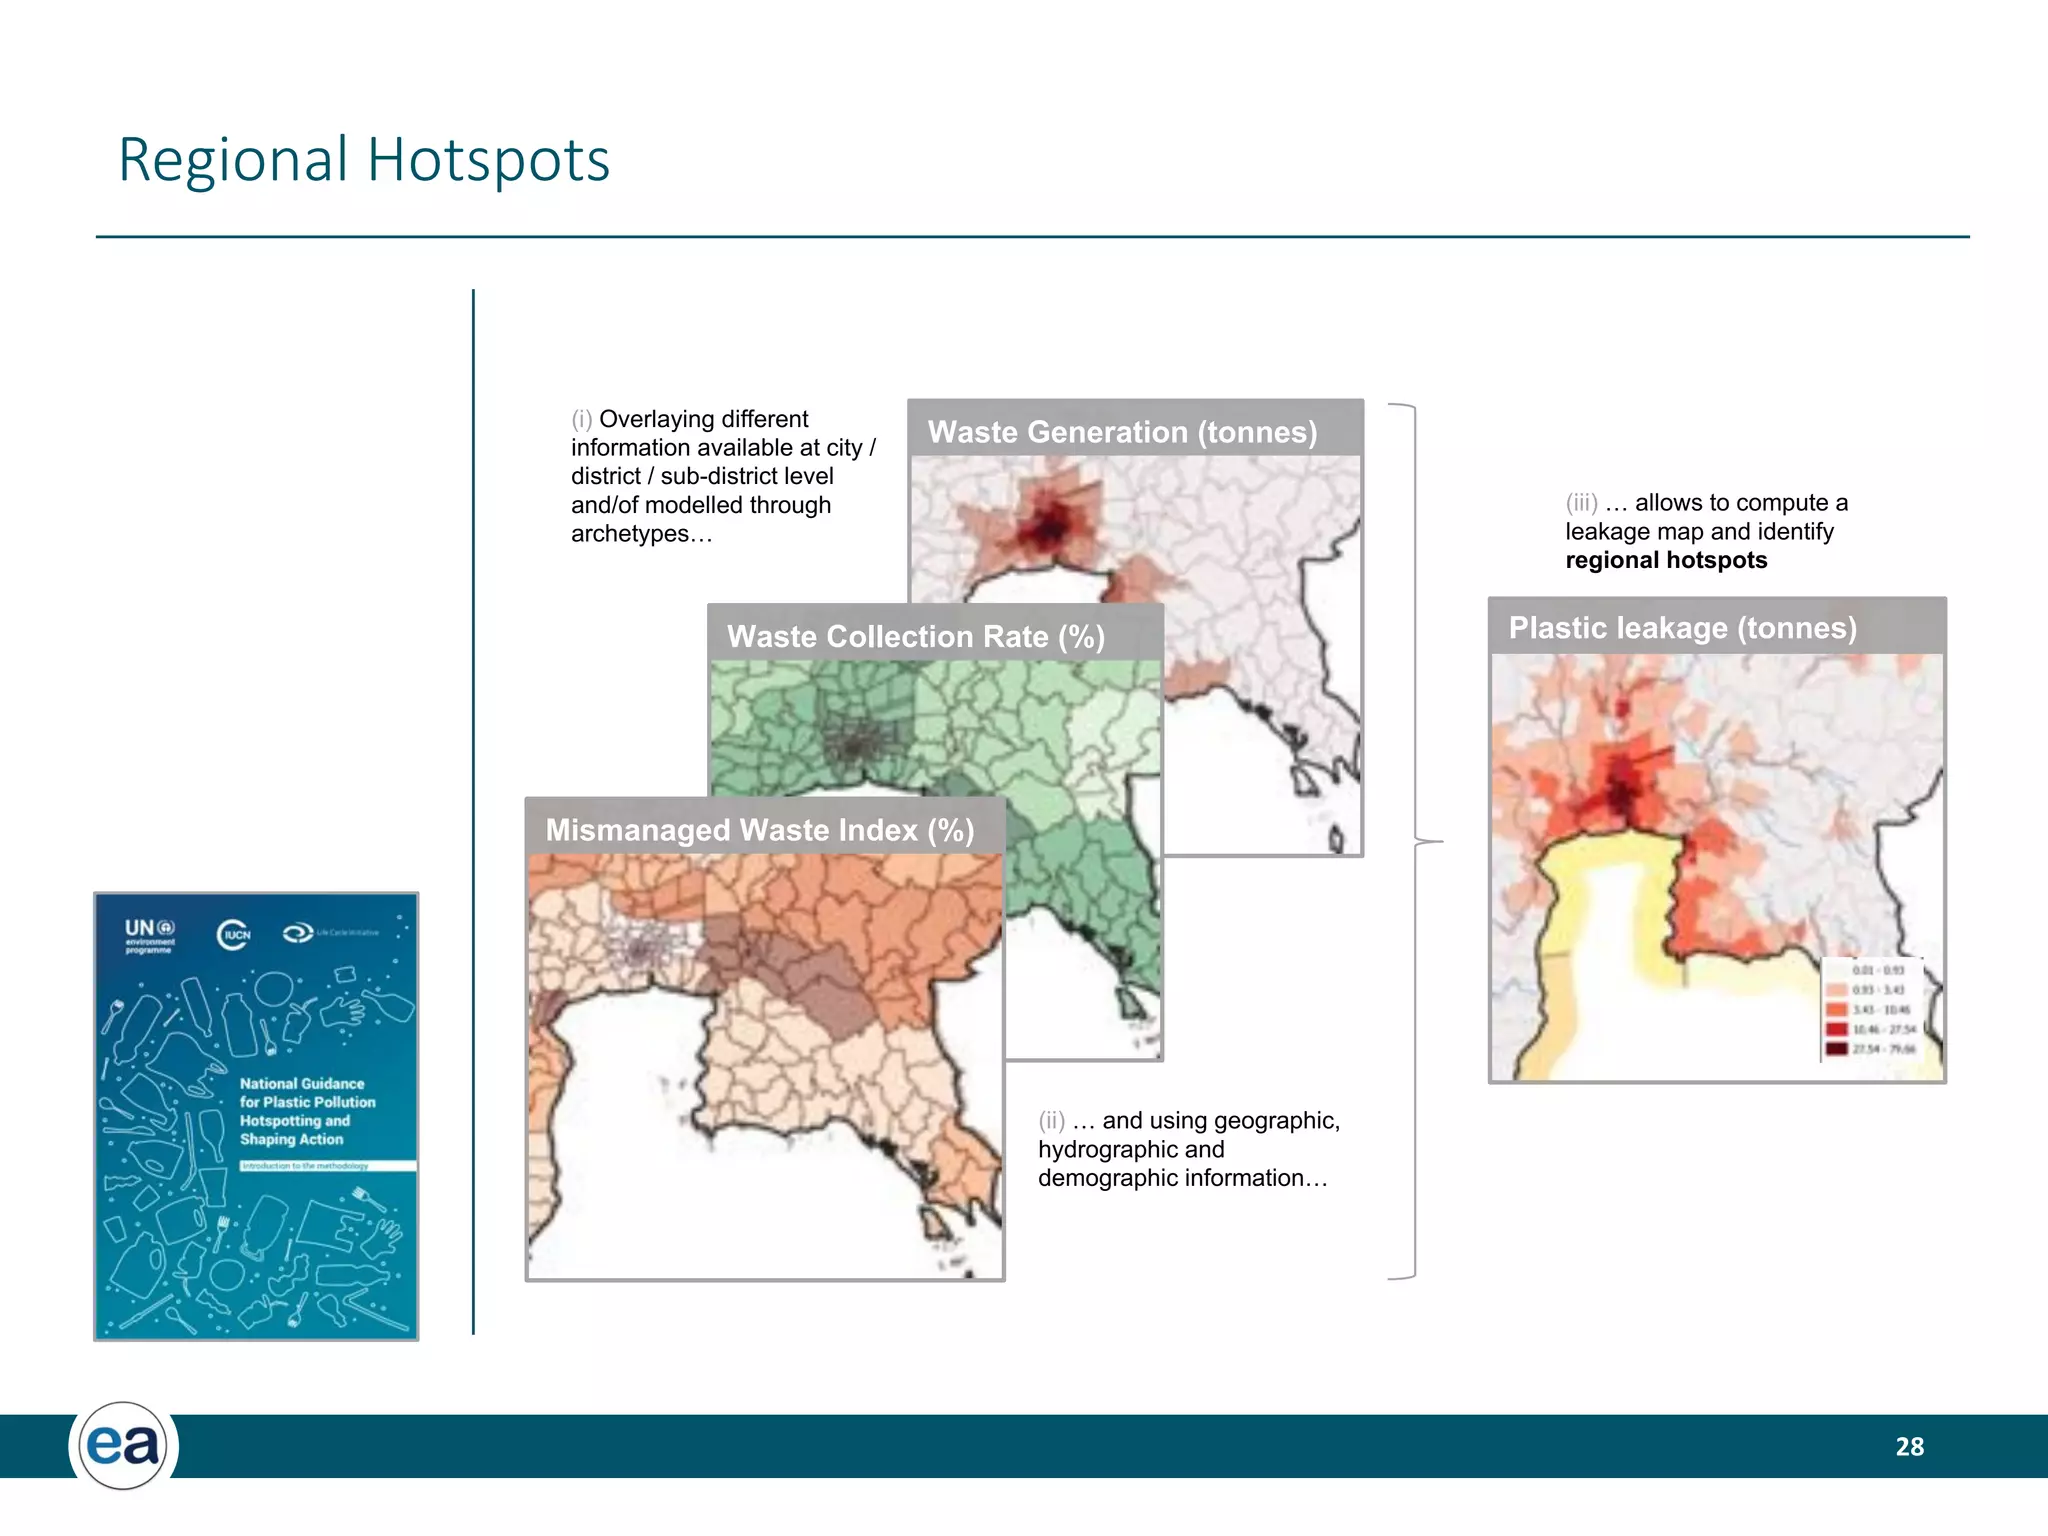
This document discusses modelling plastic leakage in the environment. It describes past and ongoing work by Shaping EA to assess plastic leakage along value chains and within countries. This includes developing a plastic leakage project to quantify leakage within markets, products, and polymer types. The document also discusses identifying regional plastic pollution hotspots through a mass balance approach coupled with leakage modelling. This allows computing a leakage map and pinpointing hotspot areas. Finally, it mentions an attempt to calibrate the modelling by comparing results to measurements of microplastic fluxes and stocks in the Lake Geneva basin.

![7
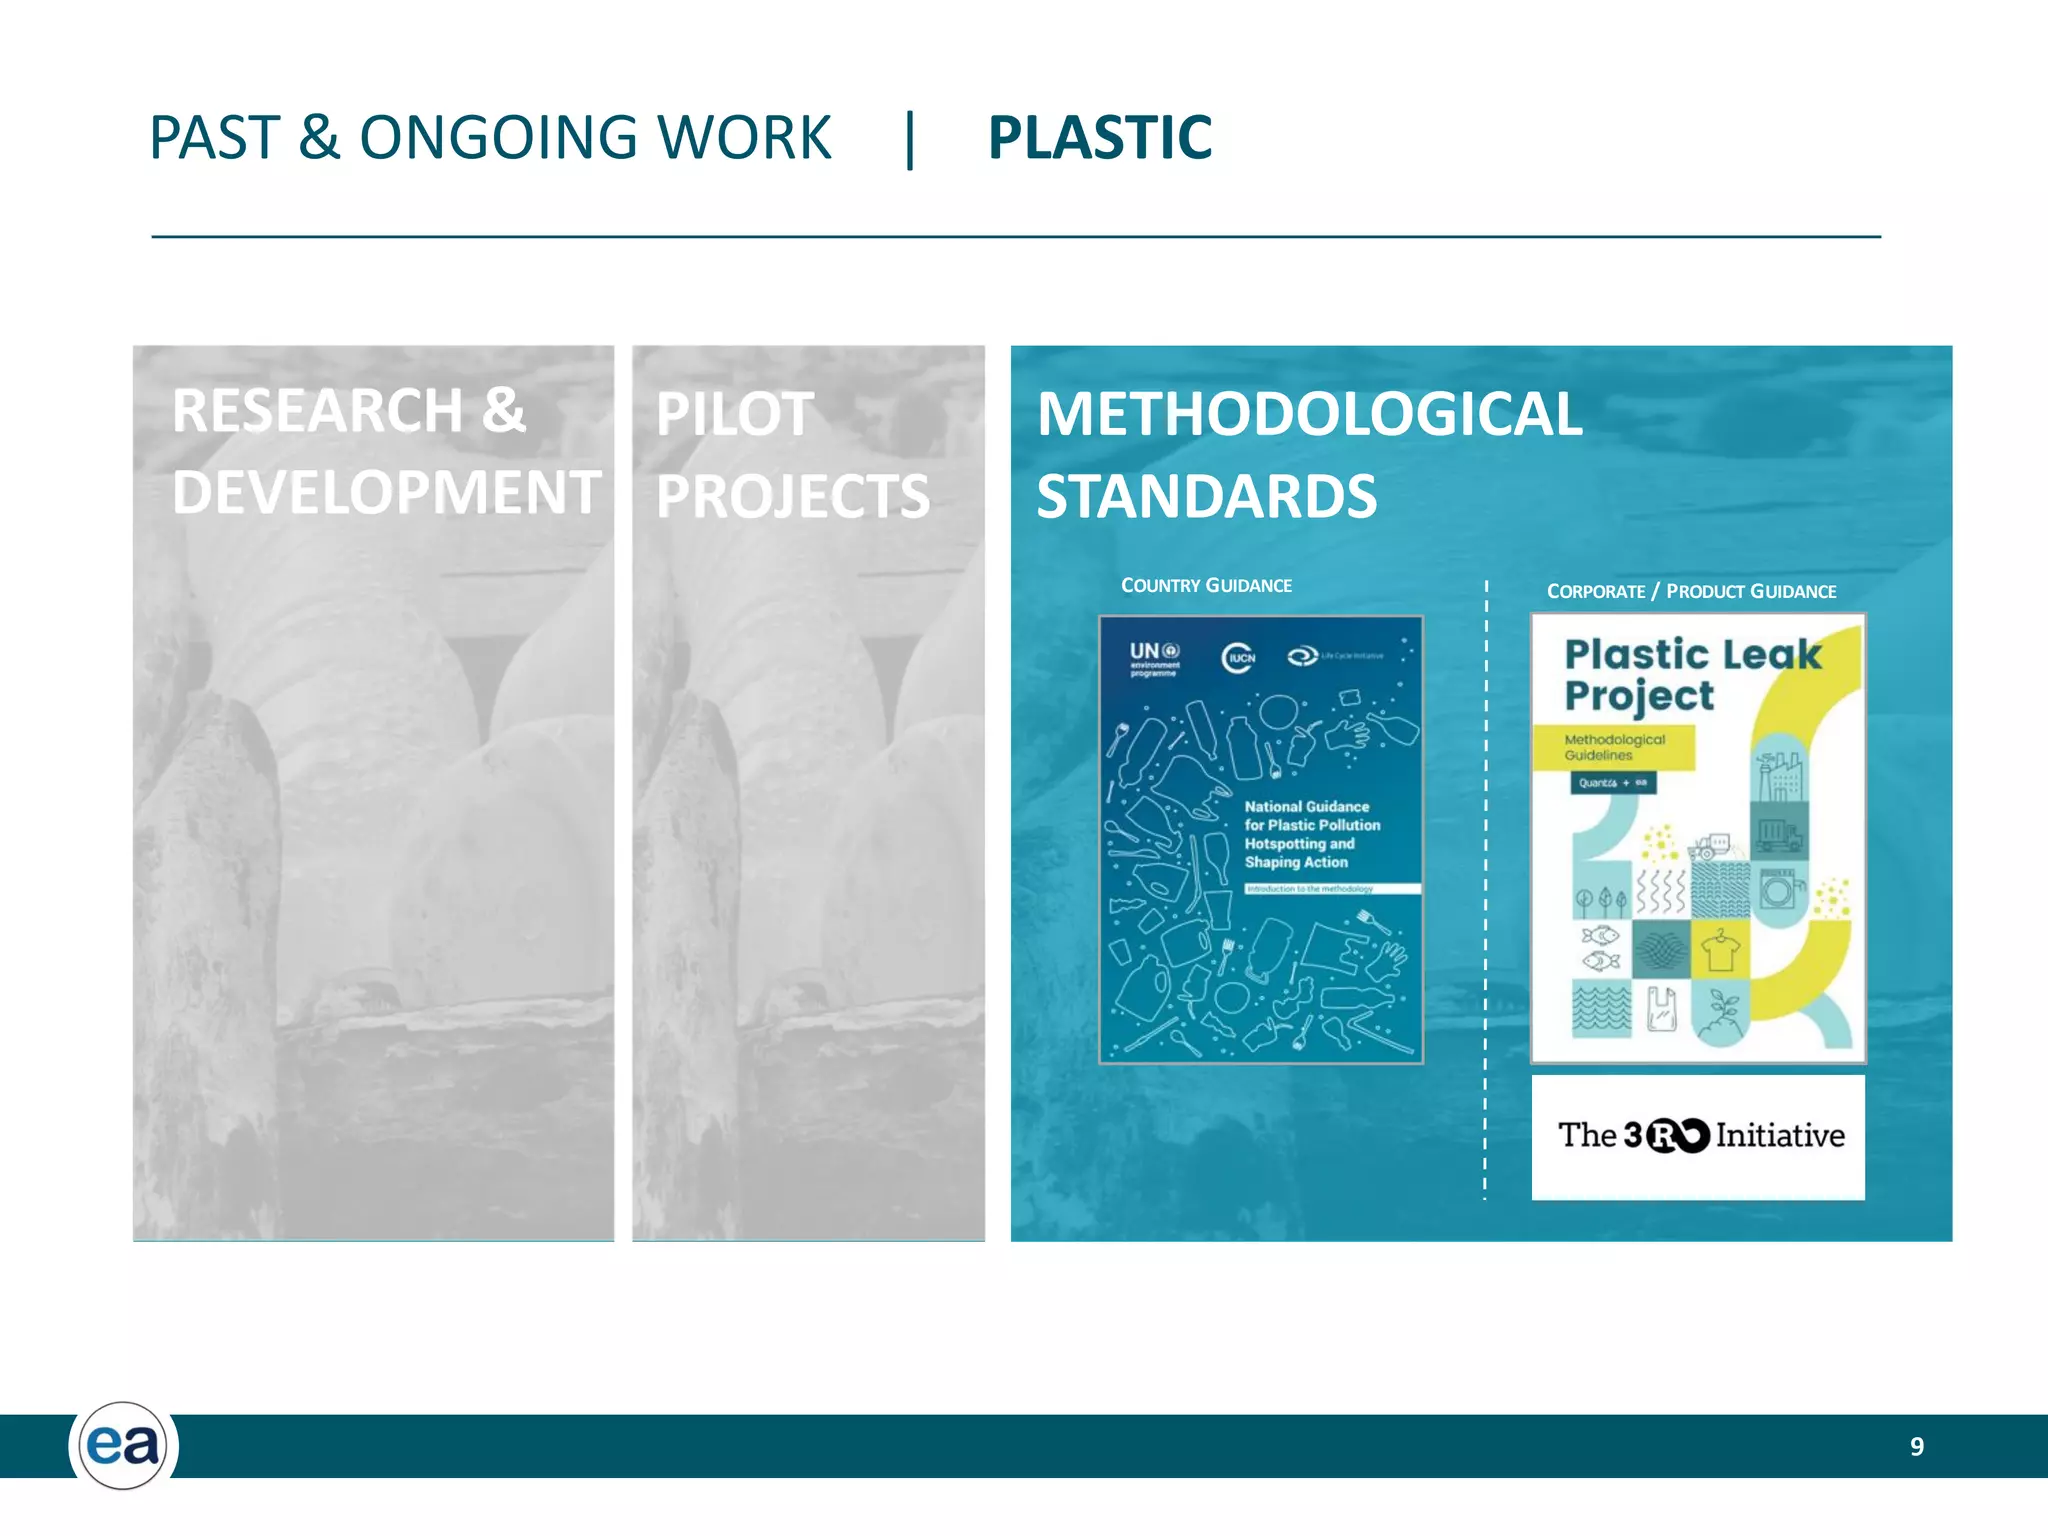
PAST & ONGOING WORK | PLASTIC
RESEARCH &
DEVELOPMENT
PILOT
PROJECTS
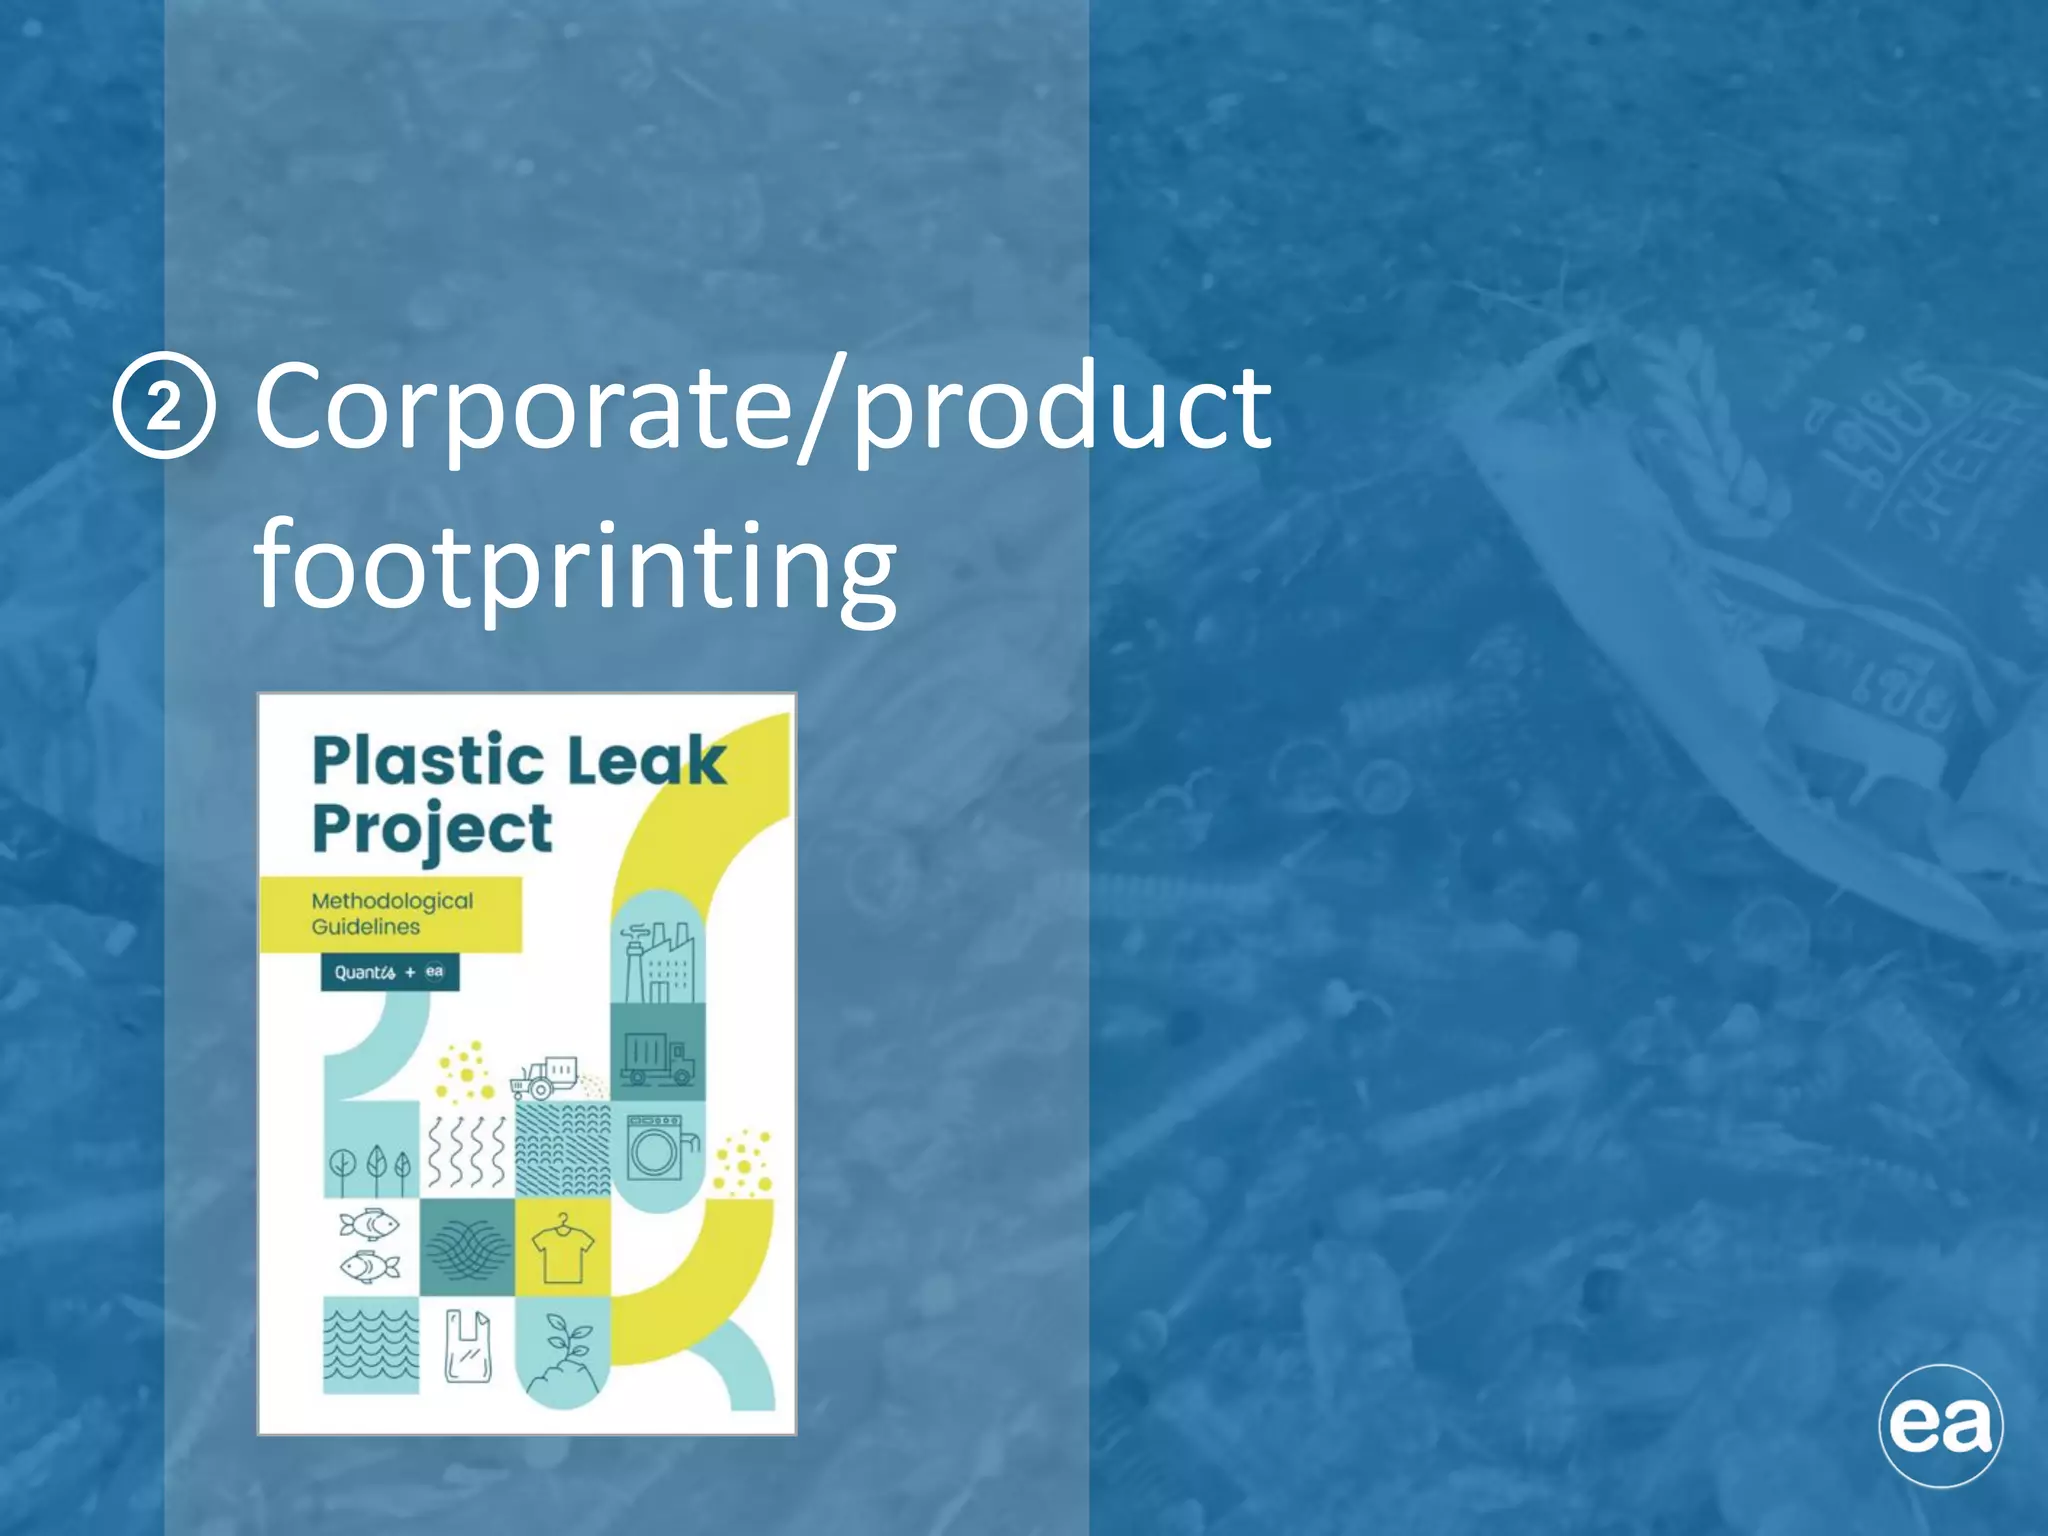
METHODOLOGICAL
STANDARDS
(Micro) plastic fluxes and stocks in Lake Geneva basin
Julien Boucher a, b, *
, Florian Faure c
, Olivier Pompini c
, Zara Plummer a
, Olivier Wieser c
,
Luiz Felippe de Alencastro c
a
EA ECCO, Chemin de Vignes d’Argent 7, 1004 Lausanne, Switzerland
b
University of Applied Sciences and Arts Western Switzerland // HES-SO, HEIG-VD, Yverdon-les-Bains, Switzerland
c
Ecole Polytechnique Federale de Lausanne (EPFL), Central Environmental Laboratory (GR-CEL), Station 2, 1015 Lausanne, Switzerland
a r t i c l e i n f o
Article history:
Available online 22 December 2018
a b s t r a c t
High amounts of macro and microplastic have been reported in rivers, lakes and seas. However, links
between the observed pollution and their sources remain unclear. This study aims to clarify these links in
the Lake Geneva basin by analysing each step of the local plastic life cycle.
Two distinct approaches have been compared: (i) a top-down approach based on modelling socio-
economic activities, plastic losses and releases into the lake, and, (ii) a bottom-up approach based on
extrapolating plastic flows into the lake based on field measurements from 6 different pathways.
The two approaches yield results with similar orders of magnitude and provided a first estimation of
the plastic flow from land to Lake Geneva in the order of magnitude of 55 tons yearÀ1
.
Preliminary mass balance of plastic in Lake Geneva indicates that the vast majority of plastic may be
deposited into the sediments.
© 2018 Elsevier B.V. All rights reserved.
1. Introduction
Plastics are used worldwide, with consumption rates increasing
steadily since the 1950s [1]. In 2016, 335 million tons of plastic were
produced globally, 60 million tons of which were produced in
Europe [2]. Some of these plastics are inadequately managed and
end up in the environment either in the form of mismanaged waste
[3] or directly from the life cycle of some products such as tyre and
road painting abrasion [4,5], textile washing [6], and cosmetics [7]
through shedding, erosion or intentionally dispersed microplastics.
For a review of the contribution of these different sources through a
global inventory of plastic flows leaking to the oceans, see
Refs. [8,9].
This ever-increasing volume of plastic entering oceans, rivers
and lakes is a major concern due to the potential environmental
impacts on biodiversity and ecosystems, as well as impacts on
human health [10,11]. These impacts are caused by different effects
such as entanglement, ingestion and toxicity [12,13] and accumu-
lation in the food web [13,14]. As such, plastic pollution has become
an increasingly pertinent issue requiring a better understanding of
its sources, fate and pathways [15].
Mismanaged plastic waste generally consists of macroplastics,
i.e. plastic above 5 mm diameter that may in turn be fragmented
into smaller pieces (secondary microplastics), once exposed to
environmental conditions [16]. These secondary microplastics are
complemented by the so-called primary microplastics originating
from different sources, and defined as plastic entering oceans or
waterways already smaller than 5 mm [8,17,18]. Secondary micro-
plastics and well as primary microplastics arising from textiles are
described as more abundant in densely urbanized areas [17,19],
whereas some forms of primary microplastics (e.g. plastic pellets)
are more often found in regions where industries are located
[20,21].
However, the precise sources and pathways of plastic pollution
as well as the precise quantities and fate of plastic accumulated
remain uncertain. When it comes to the quantities of plastic
entering or accumulated in the oceans, the literature reveals con-
trasting data. Two streams of research co-exist: one based on
modelling inputs and one based on field measurements. However,
these two approaches currently do not match and yield results
which differ at a scale of several orders of magnitude. On the one
hand, global model estimates of the yearly input of plastic into the
ocean range from 9.5 million tons per year [8] to 12.2 million tons
per year [9]. On the other hand, measurement-based global
* Corresponding author. EA ECCO, Chemin de Vignes d’Argent 7, 1004 Lausanne,
Switzerland.
E-mail address: julien.boucher@shaping-ea.com (J. Boucher).
Contents lists available at ScienceDirect
Trends in Analytical Chemistry
journal homepage: www.elsevier.com/locate/trac
https://doi.org/10.1016/j.trac.2018.11.037
0165-9936/© 2018 Elsevier B.V. All rights reserved.
Trends in Analytical Chemistry 112 (2019) 66e74](https://image.slidesharecdn.com/session4-bouchereaoecdplasticleak20200623v2small-200703164237/75/OECD-Modelling-Plastics-Use-Projections-Workshop-Julien-Boucher-7-2048.jpg)
![26
Identifying hotspots - per POLYMER TYPE
0
500
1000
1500
2000
2500
3000
3500
4000
4500
LDPE Polyester HDPE PET PP Synthetic Rubber PVC PS Other
thousandtonnes
Polymer Hotspot [Thailand 2018]
HDPE
LDPE
Polyester
PVC
PET
PP
Synthetic
Rubber
11%
6%
8%
7%
5%
Legend
Top 3 contributors to
leakage in absolute OR
relative value
Highest contributors to
leakage in absolute AND
relative value
7%
4%
7%
PS
5%](https://image.slidesharecdn.com/session4-bouchereaoecdplasticleak20200623v2small-200703164237/75/OECD-Modelling-Plastics-Use-Projections-Workshop-Julien-Boucher-25-2048.jpg)
![30
Attempt of calibration
(Micro) plastic fluxes and stocks in Lake Geneva basin
Julien Boucher a, b, *
, Florian Faure c
, Olivier Pompini c
, Zara Plummer a
, Olivier Wieser c
,
Luiz Felippe de Alencastro c
a
EA ECCO, Chemin de Vignes d’Argent 7, 1004 Lausanne, Switzerland
b
University of Applied Sciences and Arts Western Switzerland // HES-SO, HEIG-VD, Yverdon-les-Bains, Switzerland
c
Ecole Polytechnique Federale de Lausanne (EPFL), Central Environmental Laboratory (GR-CEL), Station 2, 1015 Lausanne, Switzerland
a r t i c l e i n f o
Article history:
Available online 22 December 2018
a b s t r a c t
High amounts of macro and microplastic have been reported in rivers, lakes and seas. However, links
between the observed pollution and their sources remain unclear. This study aims to clarify these links in
the Lake Geneva basin by analysing each step of the local plastic life cycle.
Two distinct approaches have been compared: (i) a top-down approach based on modelling socio-
economic activities, plastic losses and releases into the lake, and, (ii) a bottom-up approach based on
extrapolating plastic flows into the lake based on field measurements from 6 different pathways.
The two approaches yield results with similar orders of magnitude and provided a first estimation of
the plastic flow from land to Lake Geneva in the order of magnitude of 55 tons yearÀ1
.
Preliminary mass balance of plastic in Lake Geneva indicates that the vast majority of plastic may be
deposited into the sediments.
© 2018 Elsevier B.V. All rights reserved.
1. Introduction
Plastics are used worldwide, with consumption rates increasing
steadily since the 1950s [1]. In 2016, 335 million tons of plastic were
produced globally, 60 million tons of which were produced in
Europe [2]. Some of these plastics are inadequately managed and
end up in the environment either in the form of mismanaged waste
[3] or directly from the life cycle of some products such as tyre and
road painting abrasion [4,5], textile washing [6], and cosmetics [7]
through shedding, erosion or intentionally dispersed microplastics.
For a review of the contribution of these different sources through a
global inventory of plastic flows leaking to the oceans, see
Refs. [8,9].
This ever-increasing volume of plastic entering oceans, rivers
and lakes is a major concern due to the potential environmental
impacts on biodiversity and ecosystems, as well as impacts on
human health [10,11]. These impacts are caused by different effects
such as entanglement, ingestion and toxicity [12,13] and accumu-
lation in the food web [13,14]. As such, plastic pollution has become
an increasingly pertinent issue requiring a better understanding of
its sources, fate and pathways [15].
Mismanaged plastic waste generally consists of macroplastics,
i.e. plastic above 5 mm diameter that may in turn be fragmented
into smaller pieces (secondary microplastics), once exposed to
environmental conditions [16]. These secondary microplastics are
complemented by the so-called primary microplastics originating
from different sources, and defined as plastic entering oceans or
waterways already smaller than 5 mm [8,17,18]. Secondary micro-
plastics and well as primary microplastics arising from textiles are
described as more abundant in densely urbanized areas [17,19],
whereas some forms of primary microplastics (e.g. plastic pellets)
are more often found in regions where industries are located
[20,21].
However, the precise sources and pathways of plastic pollution
as well as the precise quantities and fate of plastic accumulated
remain uncertain. When it comes to the quantities of plastic
entering or accumulated in the oceans, the literature reveals con-
trasting data. Two streams of research co-exist: one based on
modelling inputs and one based on field measurements. However,
these two approaches currently do not match and yield results
which differ at a scale of several orders of magnitude. On the one
hand, global model estimates of the yearly input of plastic into the
ocean range from 9.5 million tons per year [8] to 12.2 million tons
per year [9]. On the other hand, measurement-based global
* Corresponding author. EA ECCO, Chemin de Vignes d’Argent 7, 1004 Lausanne,
Switzerland.
E-mail address: julien.boucher@shaping-ea.com (J. Boucher).
Contents lists available at ScienceDirect
Trends in Analytical Chemistry
journal homepage: www.elsevier.com/locate/trac
https://doi.org/10.1016/j.trac.2018.11.037
0165-9936/© 2018 Elsevier B.V. All rights reserved.
Trends in Analytical Chemistry 112 (2019) 66e74](https://image.slidesharecdn.com/session4-bouchereaoecdplasticleak20200623v2small-200703164237/75/OECD-Modelling-Plastics-Use-Projections-Workshop-Julien-Boucher-29-2048.jpg)
![31
Attempt of calibration
(Micro) plastic fluxes and stocks in Lake Geneva basin
Julien Boucher a, b, *
, Florian Faure c
, Olivier Pompini c
, Zara Plummer a
, Olivier Wieser c
,
Luiz Felippe de Alencastro c
a
EA ECCO, Chemin de Vignes d’Argent 7, 1004 Lausanne, Switzerland
b
University of Applied Sciences and Arts Western Switzerland // HES-SO, HEIG-VD, Yverdon-les-Bains, Switzerland
c
Ecole Polytechnique Federale de Lausanne (EPFL), Central Environmental Laboratory (GR-CEL), Station 2, 1015 Lausanne, Switzerland
a r t i c l e i n f o
Article history:
Available online 22 December 2018
a b s t r a c t
High amounts of macro and microplastic have been reported in rivers, lakes and seas. However, links
between the observed pollution and their sources remain unclear. This study aims to clarify these links in
the Lake Geneva basin by analysing each step of the local plastic life cycle.
Two distinct approaches have been compared: (i) a top-down approach based on modelling socio-
economic activities, plastic losses and releases into the lake, and, (ii) a bottom-up approach based on
extrapolating plastic flows into the lake based on field measurements from 6 different pathways.
The two approaches yield results with similar orders of magnitude and provided a first estimation of
the plastic flow from land to Lake Geneva in the order of magnitude of 55 tons yearÀ1
.
Preliminary mass balance of plastic in Lake Geneva indicates that the vast majority of plastic may be
deposited into the sediments.
© 2018 Elsevier B.V. All rights reserved.
1. Introduction
Plastics are used worldwide, with consumption rates increasing
steadily since the 1950s [1]. In 2016, 335 million tons of plastic were
produced globally, 60 million tons of which were produced in
Europe [2]. Some of these plastics are inadequately managed and
end up in the environment either in the form of mismanaged waste
[3] or directly from the life cycle of some products such as tyre and
road painting abrasion [4,5], textile washing [6], and cosmetics [7]
through shedding, erosion or intentionally dispersed microplastics.
For a review of the contribution of these different sources through a
global inventory of plastic flows leaking to the oceans, see
Refs. [8,9].
This ever-increasing volume of plastic entering oceans, rivers
and lakes is a major concern due to the potential environmental
impacts on biodiversity and ecosystems, as well as impacts on
human health [10,11]. These impacts are caused by different effects
such as entanglement, ingestion and toxicity [12,13] and accumu-
lation in the food web [13,14]. As such, plastic pollution has become
an increasingly pertinent issue requiring a better understanding of
its sources, fate and pathways [15].
Mismanaged plastic waste generally consists of macroplastics,
i.e. plastic above 5 mm diameter that may in turn be fragmented
into smaller pieces (secondary microplastics), once exposed to
environmental conditions [16]. These secondary microplastics are
complemented by the so-called primary microplastics originating
from different sources, and defined as plastic entering oceans or
waterways already smaller than 5 mm [8,17,18]. Secondary micro-
plastics and well as primary microplastics arising from textiles are
described as more abundant in densely urbanized areas [17,19],
whereas some forms of primary microplastics (e.g. plastic pellets)
are more often found in regions where industries are located
[20,21].
However, the precise sources and pathways of plastic pollution
as well as the precise quantities and fate of plastic accumulated
remain uncertain. When it comes to the quantities of plastic
entering or accumulated in the oceans, the literature reveals con-
trasting data. Two streams of research co-exist: one based on
modelling inputs and one based on field measurements. However,
these two approaches currently do not match and yield results
which differ at a scale of several orders of magnitude. On the one
hand, global model estimates of the yearly input of plastic into the
ocean range from 9.5 million tons per year [8] to 12.2 million tons
per year [9]. On the other hand, measurement-based global
* Corresponding author. EA ECCO, Chemin de Vignes d’Argent 7, 1004 Lausanne,
Switzerland.
E-mail address: julien.boucher@shaping-ea.com (J. Boucher).
Contents lists available at ScienceDirect
Trends in Analytical Chemistry
journal homepage: www.elsevier.com/locate/trac
https://doi.org/10.1016/j.trac.2018.11.037
0165-9936/© 2018 Elsevier B.V. All rights reserved.
Trends in Analytical Chemistry 112 (2019) 66e74](https://image.slidesharecdn.com/session4-bouchereaoecdplasticleak20200623v2small-200703164237/75/OECD-Modelling-Plastics-Use-Projections-Workshop-Julien-Boucher-30-2048.jpg)
![32
Attempt of calibration
Top-down
approach
Bottom-up
approach
49
59
Leakage
Tonnes.y-1
8
193
34
83
55
Per Capita Leakage
g.pers.-1.y-1
Lake Geneva
Watershed
World
average 1400
(Micro) plastic fluxes and stocks in Lake Geneva basin
Julien Boucher a, b, *
, Florian Faure c
, Olivier Pompini c
, Zara Plummer a
, Olivier Wieser c
,
Luiz Felippe de Alencastro c
a
EA ECCO, Chemin de Vignes d’Argent 7, 1004 Lausanne, Switzerland
b
University of Applied Sciences and Arts Western Switzerland // HES-SO, HEIG-VD, Yverdon-les-Bains, Switzerland
c
Ecole Polytechnique Federale de Lausanne (EPFL), Central Environmental Laboratory (GR-CEL), Station 2, 1015 Lausanne, Switzerland
a r t i c l e i n f o
Article history:
Available online 22 December 2018
a b s t r a c t
High amounts of macro and microplastic have been reported in rivers, lakes and seas. However, links
between the observed pollution and their sources remain unclear. This study aims to clarify these links in
the Lake Geneva basin by analysing each step of the local plastic life cycle.
Two distinct approaches have been compared: (i) a top-down approach based on modelling socio-
economic activities, plastic losses and releases into the lake, and, (ii) a bottom-up approach based on
extrapolating plastic flows into the lake based on field measurements from 6 different pathways.
The two approaches yield results with similar orders of magnitude and provided a first estimation of
the plastic flow from land to Lake Geneva in the order of magnitude of 55 tons yearÀ1
.
Preliminary mass balance of plastic in Lake Geneva indicates that the vast majority of plastic may be
deposited into the sediments.
© 2018 Elsevier B.V. All rights reserved.
1. Introduction
Plastics are used worldwide, with consumption rates increasing
steadily since the 1950s [1]. In 2016, 335 million tons of plastic were
produced globally, 60 million tons of which were produced in
Europe [2]. Some of these plastics are inadequately managed and
end up in the environment either in the form of mismanaged waste
[3] or directly from the life cycle of some products such as tyre and
road painting abrasion [4,5], textile washing [6], and cosmetics [7]
through shedding, erosion or intentionally dispersed microplastics.
For a review of the contribution of these different sources through a
global inventory of plastic flows leaking to the oceans, see
Refs. [8,9].
This ever-increasing volume of plastic entering oceans, rivers
and lakes is a major concern due to the potential environmental
impacts on biodiversity and ecosystems, as well as impacts on
human health [10,11]. These impacts are caused by different effects
such as entanglement, ingestion and toxicity [12,13] and accumu-
lation in the food web [13,14]. As such, plastic pollution has become
an increasingly pertinent issue requiring a better understanding of
its sources, fate and pathways [15].
Mismanaged plastic waste generally consists of macroplastics,
i.e. plastic above 5 mm diameter that may in turn be fragmented
into smaller pieces (secondary microplastics), once exposed to
environmental conditions [16]. These secondary microplastics are
complemented by the so-called primary microplastics originating
from different sources, and defined as plastic entering oceans or
waterways already smaller than 5 mm [8,17,18]. Secondary micro-
plastics and well as primary microplastics arising from textiles are
described as more abundant in densely urbanized areas [17,19],
whereas some forms of primary microplastics (e.g. plastic pellets)
are more often found in regions where industries are located
[20,21].
However, the precise sources and pathways of plastic pollution
as well as the precise quantities and fate of plastic accumulated
remain uncertain. When it comes to the quantities of plastic
entering or accumulated in the oceans, the literature reveals con-
trasting data. Two streams of research co-exist: one based on
modelling inputs and one based on field measurements. However,
these two approaches currently do not match and yield results
which differ at a scale of several orders of magnitude. On the one
hand, global model estimates of the yearly input of plastic into the
ocean range from 9.5 million tons per year [8] to 12.2 million tons
per year [9]. On the other hand, measurement-based global
* Corresponding author. EA ECCO, Chemin de Vignes d’Argent 7, 1004 Lausanne,
Switzerland.
E-mail address: julien.boucher@shaping-ea.com (J. Boucher).
Contents lists available at ScienceDirect
Trends in Analytical Chemistry
journal homepage: www.elsevier.com/locate/trac
https://doi.org/10.1016/j.trac.2018.11.037
0165-9936/© 2018 Elsevier B.V. All rights reserved.
Trends in Analytical Chemistry 112 (2019) 66e74](https://image.slidesharecdn.com/session4-bouchereaoecdplasticleak20200623v2small-200703164237/75/OECD-Modelling-Plastics-Use-Projections-Workshop-Julien-Boucher-31-2048.jpg)