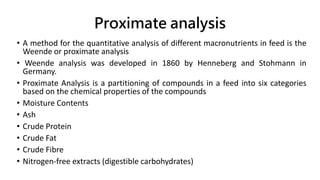
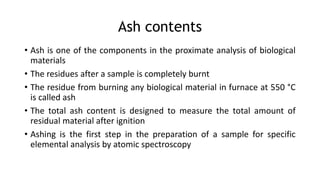
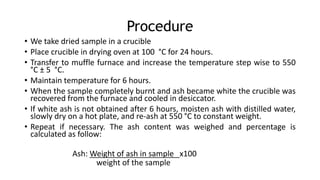
SlideShare a Scribd company logo
1 of 24
Proximate analysis
• A method for the quantitative analysis of different macronutrients in feed is the
Weende or proximate analysis
• Weende analysis was developed in 1860 by Henneberg and Stohmann in
Germany.
• Proximate Analysis is a partitioning of compounds in a feed into six categories
based on the chemical properties of the compounds
• Moisture Contents
• Ash
• Crude Protein
• Crude Fat
• Crude Fibre
• Nitrogen-free extracts (digestible carbohydrates)
Moisture contents
• The moisture contents are very important in the sense: As moisture
content of feed varies, its proximate composition also varies and
consequently it nutritional value also varies
• As the moisture content increased the dry matter decreased, while
purchasing the feed the dry matter content is taken into consideration,
rather than gross weight of the feed
• Moisture content is important in storage of feed
• In general feed more than 11% moisture get mold and spoiled
• Moisture is determined by drying a feed sample in a hot air oven at 100 oC
for a specified length of time
• The loss of weight is the moisture content of the sample
• The residue left over after the removal of moisture is called the dry matter
Procedure
• Accurately weight a moisture dish of appropriate size
• Add approximately 10 g of the sample and reweight
• Place the container in a vacuum oven at 100 °C for
approximately 5 hours.
• Remove dish from the oven, cover, cool in desiccator,
and weight
• Re-dry 1 hr and repeat process until constant weight
has been achieved
• Calculate the percentage moisture (wet weight basis) as
follows:
Percent moisture= (P-a) x 100
P
• P = sample weight in g
a = dried sample weight in g
Ash contents
• Ash is one of the components in the proximate analysis of biological
materials
• The residues after a sample is completely burnt
• The residue from burning any biological material in furnace at 550 °C
is called ash
• The total ash content is designed to measure the total amount of
residual material after ignition
• Ashing is the first step in the preparation of a sample for specific
elemental analysis by atomic spectroscopy
Procedure
• We take dried sample in a crucible
• Place crucible in drying oven at 100 °C for 24 hours.
• Transfer to muffle furnace and increase the temperature step wise to 550
°C ¹ 5 °C.
• Maintain temperature for 6 hours.
• When the sample completely burnt and ash became white the crucible was
recovered from the furnace and cooled in desiccator.
• If white ash is not obtained after 6 hours, moisten ash with distilled water,
slowly dry on a hot plate, and re-ash at 550 °C to constant weight.
• Repeat if necessary. The ash content was weighed and percentage is
calculated as follow:
Ash: Weight of ash in sample x100
weight of the sample
Crude protein
• Estimated by a process developed in 1883 by a Brewer Johann Kjeldahl
• He discovered that "all protein" contains about the same amount of nitrogen (16%).
• He analysed for nitrogen, which is relatively easy, and calculated crude protein on the
basis: 100/16 = 6.25
• therefore: NITROGEN x 6.25 = CRUDE PROTEIN
• The Kjeldahl procedure can be basically divided into three parts: (1) digestion, (2)
distillation, (3) titration.
• Placing 1 gm of the sample containing protein, into a digestion flask, along with 12-15
mL of concentrated sulfuric acid (H2SO4)
• Heating the mixture in the flask until white fumes can be seen, and then continuing
the heating for about 60-90 mins.
• Cooling the flask and cautiously adding 250 ml of water.
• To digested mixture, 40% NaOH was added and the resultant mixture was distilled in
Micro-Kjeldahl apparatus.
• The purpose of distillation, is to separate the ammonia (that is, the nitrogen) from the
digestion mixture
• The liberated ammonia was condensed and collected in Sulphuric acid solution having
methyl orange as an indicator. This dye should turn a strong color, indicating that a
significant amount of the original trapping acid is still present.
Titration
• Putting a standard solution of NaOH (sodium hydroxide) into the buret (a long tube
with a tap at the end), and slowly, slowly adding small amounts of the sodium
hydroxide solution to the acid solution with the dye.
• watching for the point at which the dye turns orange, indicating that the "endpoint"
has been reached and that now all the acid has been neutralized by the base.
• Recording the volume of the neutralizing base (sodium hydroxide solution) that was
necessary to reach the endoint.
• Performing a calculation to find the amount of ammonia, and thus nitrogen, that came
from the original sample.
0.0014 is factor for equivalence of H2SO4 to NH3
Distillation: The action of purifying a liquid by a process of heating and cooling.
Titration is a technique where a solution of known concentration is used to
determine the concentration of an unknown solution
Percentage of Nitrogen in selected sample was calculated as:
To convert to protein multiply by the appropriate factor:
x 6.25 for meat and general protein
x 6.38 for milk protein
x 5.70 for cereal protein.
Crude fat
• Crude fat is also known as ether extract
• It is estimated by extraction with petroleum ether (boiling point 40-60 °C)
by a soxhlet extractor
• A dried, ground sample is extracted with diethyl ether which dissolves fats,
oils, pigments and other fat soluble substances.
• The ether is then evaporated from the fat solution.
• The resulting residue is weighed and referred to as ether extract or crude
fat.
• Both the ether and the samples must be free of moisture to avoid co-
extraction of water-soluble components in the sample such as
carbohydrates, urea, lactic acid, glycerol, etc.
• Low temperatures are used to evaporate the ether and remove residual
moisture to prevent oxidation of the fat.
• The crude fat is determined by extracting powdered sample
with petroleum ether, using a Soxhlet apparatus.
• Dried sample (5 g) was taken in a thimble and was placed in
the extraction tube of Soxhlet apparatus.
• The temperature of the heater was so adjusted that continuous
drops of ether fell on the sample in extraction tube.
• The process of extraction was carried out for 16 hours to allow
complete extraction.
• Then the sample was removed and the solvent was evaporated
under the fume hood.
• The extract was completely dried in oven for 30 minutes at
105oC. The weight of extract was recorded after cooling in
desiccator. Crude fat in the samples were calculated by using
following formula.
• Crude fat (%) = Weight of fat in sample (g) × 100
Weight of sample (g) Soxhlet Extractor
Crude Fiber
• In a 1000 mL beaker, 3 g of dried and fat free sample was taken.
• 200 mL of 1.25 % H2SO4 was added to it and level of beaker was marked.
• This was allowed to boil for 30 minutes with constant stirring
• These contents were filtered while warmed giving 2 to 3 washings with hot water until it
became alkali free.
• The residue was carefully transferred in a crucible (W1) and dried in hot air oven at
100°C for 3-4 hours until smoke ceased to come out.
• Then this sample W2 (sample+crucible) was put in a muffle furnace at 550 °C for 4 hours
until grey color ash was obtained.
• This was allowed to cool in a desiccator and reweighed (W3).
% crude fiber in ground sample = Loss in weight on ignition (W2 - W1) – (W3 - W1) x 100
Weight of the sample
Nitrogen free extract (NFE)
• Nitrogen free extracts percentage was calculated by the formula:
%NFE = 100-(% of crude proteins + % crude fiber + % crude fat + %
crude ash)
• NFE supposedly represents the soluble carbohydrate of the feed, such
as starch and sugar.
Assessment of Nutritional Status
• Nutritional assessment is the interpretation of anthropometric,
biochemical (laboratory), clinical and dietary data to determine whether a
person or groups of persons are well nourished or malnourished.
• The consumption of adequate amount of food both in terms of quantity
and quality is one of the key determinants, which has a significant impact
on the nutritional status
• Eating pattern of an individual is a crucial factor that dictates the
occurrence of a disease, especially some chronic conditions such as
coronary heart disease, hypertension, stroke, diabetes mellitus, and cancer
• In addition, adverse outcomes such as low birth weight, malnutrition,
disability, poor quality of life, and mortality are also related to poor eating
pattern in both developed and under developing countries
METHODS FOR NUTRITIONAL
ASSESSMENT
• The assessment of the nutritional status involves two methods:
• Direct (deals with individuals and measures the objective criteria)
• These methods include ABCD, anthropometric, biochemical, clinical and
dietary measurements to cover all the phases of the disease
• Each of them has some advantages and limitations
• Utilizing all of them to assess the nutritional status gives an overall picture
of an individual’s nutritional status
• The use of any one method or a combination of methods is recommended
depending on the purpose of the nutritional assessment
Indirect (uses community health indices reflecting nutritional
influences)
• Ecological variables including agricultural crops production, Economic
factors e.g. household income, per capita income, population density,
food availability and prices, Cultural and social habits
• Vital health statistics: morbidity, mortality and other health indicators
e.g., infant and under-fives mortality, Utilization of maternal and child
health care services, fertility indices and sanitary conditions
Anthropometric measurements
• Include height, weight, skin-fold thickness, and circumference
• It is an essential component of clinical examination of infants, children &
pregnant women
• It could detect the change of body composition to assess the nutritional
status in specific population groups, including newborn, children and adults
• These measurements are compared to the reference data (standards) of
the same age and sex group, in order to evaluate the nutritional status.
• The advantage is that routine anthropometric measurements can suggest
patterns of growth and development of an individual
Biochemical and Laboratory investigations
• Extremely helpful in detecting early changes in body metabolism and
nutrition before the appearance of clinical signs
• The results obtained are precise, accurate and reproducible
• Initial Laboratory Assessment includes Laboratory tests based on blood
and urine can be important indicators of nutritional status, but they are
influenced by non-nutritional factors as well
• Lab results can be altered by medications, hydration status, and disease
states or other metabolic processes, such as stress
• Hemoglobin estimation is the most important test & useful index of the
overall state of nutrition. Beside anemia it also tells about protein & trace
element nutrition
Dietary assessment
Nutritional intake of humans is assessed by five different methods
1. 24 Hours Dietary Recall
2. Food Frequency Questionnaire
3. Diet history
4. Food Diary
5. Observed Food Consumption
Interpretation of Dietary Data
 Qualitative Method
Using the food pyramid & the basic food groups method
• Different nutrients are classified into 5 groups (fat & oils, bread & cereals, milk
products, meat-fish-poultry, vegetables & fruits)
• Determine the number of servings from each group & compare it with minimum
requirements
Quantitative Method
• The amount of energy & specific nutrients in each food consumed can be calculated
using food composition tables & then compare it with the recommended daily intake
Functional indicators
• These indicators for nutritional status are emerging as an important category of
diagnostic tools and supporting the biochemical investigations
• Some of the commonly used functional indices are for hemostasis and nerve
conduction
Hemostasis or haemostasis is a process to prevent and stop bleeding, meaning to keep
blood within a damaged blood vessel (the opposite of hemostasis is hemorrhage). It is
the first stage of wound healing. This involves coagulation, blood changing from a liquid
to a gel
A nerve conduction velocity (NCV) test — also called a nerve conduction study (NCS) —
measures how fast an electrical impulse moves through your nerve. NCV can
identify nerve damage
Vital statistics
• All the data collected from different countries will present an overall picture of the
nutritional status for that population of interest to help the government-making
policy decisions.
• For example, analysis of morbidity and mortality data can be used in estimating the
prevalence of the disease in the community and identifying the high-risk groups
Ecological factors
• Different ecological factors such as socioeconomic factors, quality,
accessibility, availability of health care services, and diseases effect on
occurrence of malnutrition
• It is extremely important to make an “ecological diagnosis” to identify,
which factors will affect the nutrition status of the community
Protein Quality Assessment
• Protein quality is the digestibility and quantity of essential amino acids for
providing the proteins in correct ratios for human consumption
• Protein quality can be measured by calculating the nitrogen used for tissue
formation divided by the nitrogen absorbed from food. This product is
multiplied by 100 and expressed as a percentage of nitrogen utilized.
• A complete protein or whole protein is a food source of protein that
contains an adequate proportion of each of the nine essential amino acids
necessary in the human diet. Examples of single-source complete proteins
are red meat, poultry, fish, eggs, milk, cheese and yogurt
• A general recommendation for healthy adults is to eat at least 0.36 grams
of protein per pound of your body weight each day — but you
may need more depending on your activity level and general health
Factors Effecting Protein quality
There are a number of factors which may affect the protein quality from food
• The amino acid profile of the protein
• The structure of the protein
• The digestibility of the protein
• The amount of protein consumed in one meal
• Other nutrients and food constituents present in the meal, e.g. fiber,
carbohydrate
• How the food has been prepared
• Recent intake of protein
• The metabolic state of the individual, e.g. illness, exercise, sleep
• The individual's age, weight, sex, and general health
Methods of Determining Protein Quality
1. Amino Acid Scoring (AAS)
• AAS is fast and cheap. It measures the essential amino acids (EAAs) – also
known as indispensable amino acids (IAAs) – present in a protein and
compares the values with a reference protein
2. Protein Efficiency Ratio (PER)
• PER measures the ability of a protein to support the growth. It represents
the ratio of weight gain to the amount of protein consumed
3. Nitrogen Protein Utilization (NPU)
• This is the ratio of the nitrogen used for tissue formation versus the amount
of nitrogen digested. This method doesn’t account for the amino acid profile
4. Biological Value (BV)
• BV is the most commonly used and well-known protein scoring system. It
measures the amount of nitrogen retained in comparison to the amount of
nitrogen absorbed. It looks at how similar the amino acid profile is to that of
human requirements. Proteins are grouped into those of high BV (HBV) and
low BV (LBV)
6. Protein Digestibility-Corrected Amino Acid Score (PDCAAS)
• The protein digestibility-corrected amino acid score (PDCAAS) has been
adopted by FAO/WHO as the preferred method for the measurement of the
protein value in human nutrition
• PDCAAS takes into account the profile of IAAs of the protein in question, as well
as its digestibility in humans; it is the AAS with an added digestibility
component. Scores are from 0.1 to 1.0, with 1.0 being a high-quality protein
7. Digestible Indispensable Amino Acid Score (DIAAS)
DIAAS is much like PDCAAS in that it determines the digestibility of the amino
acids as well as the protein’s contribution to human amino acid and nitrogen
requirements.
DIASS is shown as a percentage and doesn’t limit to scoring the protein to a
maximum value; instead, proteins can have a higher score
DIAAS hasn’t been adopted as the preferred protein scoring method US FAO

More Related Content

What's hot

Production of Acrylonitrile from the ammoxidation of propylene
Production of Acrylonitrile from the ammoxidation of propyleneProduction of Acrylonitrile from the ammoxidation of propylene
Production of Acrylonitrile from the ammoxidation of propylenebiotech energy pvt limited
 
PH measurement in Food and drink
PH  measurement in Food and drinkPH  measurement in Food and drink
PH measurement in Food and drinkBavaneethan Yokananth
 
Estimation of iodine value
Estimation of iodine valueEstimation of iodine value
Estimation of iodine valueJasmineJuliet
 
Protein Analysis - Kjeldhal
Protein Analysis - KjeldhalProtein Analysis - Kjeldhal
Protein Analysis - KjeldhalSanjai
 
Quality analysis of fats and oils ppt
Quality analysis of fats and oils pptQuality analysis of fats and oils ppt
Quality analysis of fats and oils pptSakshi Thakur
 
Energy expenditure and BMR
Energy expenditure and BMREnergy expenditure and BMR
Energy expenditure and BMRSabahat Ali
 
Intereseterification of oils
Intereseterification of oilsIntereseterification of oils
Intereseterification of oilsMuneeb Vml
 
Analysis of lipids, fats & oils
Analysis of lipids, fats & oilsAnalysis of lipids, fats & oils
Analysis of lipids, fats & oilsDr Raj kumar Kudari
 
Meat flavour
Meat flavourMeat flavour
Meat flavourMoksha Chib
 
Chemical Looping Combustion
Chemical Looping CombustionChemical Looping Combustion
Chemical Looping CombustionRajan Lanjekar
 
Analysis of fats, oils & waxes
Analysis of fats, oils & waxesAnalysis of fats, oils & waxes
Analysis of fats, oils & waxesChowdaryPavani
 
Moisture determination and Total solid
Moisture determination and Total solidMoisture determination and Total solid
Moisture determination and Total solidBavaneethan Yokananth
 
Hydration and the role of Sports Drinks
Hydration and the role of Sports DrinksHydration and the role of Sports Drinks
Hydration and the role of Sports DrinksIain82
 
Gas absorption ppt
Gas absorption pptGas absorption ppt
Gas absorption pptAnkit_Mistry
 
Solution Manual for Physical Chemistry – Robert Alberty
Solution Manual for Physical Chemistry – Robert AlbertySolution Manual for Physical Chemistry – Robert Alberty
Solution Manual for Physical Chemistry – Robert AlbertyHenningEnoksen
 

What's hot (20)

Fat analysis
Fat analysisFat analysis
Fat analysis
 
Production of Acrylonitrile from the ammoxidation of propylene
Production of Acrylonitrile from the ammoxidation of propyleneProduction of Acrylonitrile from the ammoxidation of propylene
Production of Acrylonitrile from the ammoxidation of propylene
 
PH measurement in Food and drink
PH  measurement in Food and drinkPH  measurement in Food and drink
PH measurement in Food and drink
 
Food Testing lab
Food Testing labFood Testing lab
Food Testing lab
 
Refining of fats and oils
Refining of fats and oilsRefining of fats and oils
Refining of fats and oils
 
Ashing techniques
Ashing techniques Ashing techniques
Ashing techniques
 
Estimation of iodine value
Estimation of iodine valueEstimation of iodine value
Estimation of iodine value
 
Protein Analysis - Kjeldhal
Protein Analysis - KjeldhalProtein Analysis - Kjeldhal
Protein Analysis - Kjeldhal
 
Quality analysis of fats and oils ppt
Quality analysis of fats and oils pptQuality analysis of fats and oils ppt
Quality analysis of fats and oils ppt
 
Energy expenditure and BMR
Energy expenditure and BMREnergy expenditure and BMR
Energy expenditure and BMR
 
Intereseterification of oils
Intereseterification of oilsIntereseterification of oils
Intereseterification of oils
 
Analysis of lipids, fats & oils
Analysis of lipids, fats & oilsAnalysis of lipids, fats & oils
Analysis of lipids, fats & oils
 
Meat flavour
Meat flavourMeat flavour
Meat flavour
 
Evaporators
EvaporatorsEvaporators
Evaporators
 
Chemical Looping Combustion
Chemical Looping CombustionChemical Looping Combustion
Chemical Looping Combustion
 
Analysis of fats, oils & waxes
Analysis of fats, oils & waxesAnalysis of fats, oils & waxes
Analysis of fats, oils & waxes
 
Moisture determination and Total solid
Moisture determination and Total solidMoisture determination and Total solid
Moisture determination and Total solid
 
Hydration and the role of Sports Drinks
Hydration and the role of Sports DrinksHydration and the role of Sports Drinks
Hydration and the role of Sports Drinks
 
Gas absorption ppt
Gas absorption pptGas absorption ppt
Gas absorption ppt
 
Solution Manual for Physical Chemistry – Robert Alberty
Solution Manual for Physical Chemistry – Robert AlbertySolution Manual for Physical Chemistry – Robert Alberty
Solution Manual for Physical Chemistry – Robert Alberty
 

Similar to 7 Proximate analysis.pptxbiochemistryyyy

Principle of various techniques in estimating chemical and biochemical consti...
Principle of various techniques in estimating chemical and biochemical consti...Principle of various techniques in estimating chemical and biochemical consti...
Principle of various techniques in estimating chemical and biochemical consti...Dr. Vishnu Vrardhan Reddy Pulimi
 
Milk adulteration
Milk adulterationMilk adulteration
Milk adulterationJp Prakash
 
Animal Nutrition Lab Manual 1
Animal Nutrition Lab Manual 1Animal Nutrition Lab Manual 1
Animal Nutrition Lab Manual 1Osama Zahid
 
Analysis of milk and butter
Analysis of milk and butterAnalysis of milk and butter
Analysis of milk and butterAzmaFakhar
 
Quality control lec2
Quality control lec2Quality control lec2
Quality control lec2MOHAMED MADY
 
Optimization of ABE Fermentation from Rice Husk Medium using Clostridium acet...
Optimization of ABE Fermentation from Rice Husk Medium using Clostridium acet...Optimization of ABE Fermentation from Rice Husk Medium using Clostridium acet...
Optimization of ABE Fermentation from Rice Husk Medium using Clostridium acet...pranavdadhich
 
LIPIds notes.pptx
LIPIds notes.pptxLIPIds notes.pptx
LIPIds notes.pptxatwairobert
 
Solvent production
Solvent production Solvent production
Solvent production RamkumarK49
 
B-Glycosides-Glycyrhetinic-acid-Rutin.pptx
B-Glycosides-Glycyrhetinic-acid-Rutin.pptxB-Glycosides-Glycyrhetinic-acid-Rutin.pptx
B-Glycosides-Glycyrhetinic-acid-Rutin.pptxMNGSStudio
 
production of ethenol via molasis
production of ethenol via molasisproduction of ethenol via molasis
production of ethenol via molasisSahil Khanna
 
Special Stains used in Histopathology laboratory
Special Stains used in Histopathology laboratorySpecial Stains used in Histopathology laboratory
Special Stains used in Histopathology laboratoryJoshua33952
 
Dr.Lavanya.S.A - Analytical parameters of kshara kalpana
Dr.Lavanya.S.A -  Analytical parameters of kshara kalpanaDr.Lavanya.S.A -  Analytical parameters of kshara kalpana
Dr.Lavanya.S.A - Analytical parameters of kshara kalpanaDr.Lavanya .S.A
 
Analysis of Milk and Milk Product
Analysis of Milk and Milk ProductAnalysis of Milk and Milk Product
Analysis of Milk and Milk ProductRam Kumar
 
General analytical method of cheese (shameer m.pharm analysis 2020)
General analytical method of cheese (shameer m.pharm analysis 2020)General analytical method of cheese (shameer m.pharm analysis 2020)
General analytical method of cheese (shameer m.pharm analysis 2020)ShameerAbid
 
introduction to food analysis ppt.ppt
introduction to food analysis ppt.pptintroduction to food analysis ppt.ppt
introduction to food analysis ppt.pptsatbirkaur28
 

Similar to 7 Proximate analysis.pptxbiochemistryyyy (20)

Proximate analysis and fibre fraction
Proximate analysis and fibre fraction Proximate analysis and fibre fraction
Proximate analysis and fibre fraction
 
Principle of various techniques in estimating chemical and biochemical consti...
Principle of various techniques in estimating chemical and biochemical consti...Principle of various techniques in estimating chemical and biochemical consti...
Principle of various techniques in estimating chemical and biochemical consti...
 
Milk adulteration
Milk adulterationMilk adulteration
Milk adulteration
 
Animal Nutrition Lab Manual 1
Animal Nutrition Lab Manual 1Animal Nutrition Lab Manual 1
Animal Nutrition Lab Manual 1
 
Lecture 3
Lecture 3Lecture 3
Lecture 3
 
Analysis of milk and butter
Analysis of milk and butterAnalysis of milk and butter
Analysis of milk and butter
 
Quality control lec2
Quality control lec2Quality control lec2
Quality control lec2
 
Optimization of ABE Fermentation from Rice Husk Medium using Clostridium acet...
Optimization of ABE Fermentation from Rice Husk Medium using Clostridium acet...Optimization of ABE Fermentation from Rice Husk Medium using Clostridium acet...
Optimization of ABE Fermentation from Rice Husk Medium using Clostridium acet...
 
LIPIds notes.pptx
LIPIds notes.pptxLIPIds notes.pptx
LIPIds notes.pptx
 
Bakers yeast
Bakers yeastBakers yeast
Bakers yeast
 
Solvent production
Solvent production Solvent production
Solvent production
 
Analysis of milk and milk product
Analysis of milk and milk productAnalysis of milk and milk product
Analysis of milk and milk product
 
B-Glycosides-Glycyrhetinic-acid-Rutin.pptx
B-Glycosides-Glycyrhetinic-acid-Rutin.pptxB-Glycosides-Glycyrhetinic-acid-Rutin.pptx
B-Glycosides-Glycyrhetinic-acid-Rutin.pptx
 
production of ethenol via molasis
production of ethenol via molasisproduction of ethenol via molasis
production of ethenol via molasis
 
Special Stains used in Histopathology laboratory
Special Stains used in Histopathology laboratorySpecial Stains used in Histopathology laboratory
Special Stains used in Histopathology laboratory
 
Dr.Lavanya.S.A - Analytical parameters of kshara kalpana
Dr.Lavanya.S.A -  Analytical parameters of kshara kalpanaDr.Lavanya.S.A -  Analytical parameters of kshara kalpana
Dr.Lavanya.S.A - Analytical parameters of kshara kalpana
 
Analysis of Milk and Milk Product
Analysis of Milk and Milk ProductAnalysis of Milk and Milk Product
Analysis of Milk and Milk Product
 
Peroxide value
Peroxide valuePeroxide value
Peroxide value
 
General analytical method of cheese (shameer m.pharm analysis 2020)
General analytical method of cheese (shameer m.pharm analysis 2020)General analytical method of cheese (shameer m.pharm analysis 2020)
General analytical method of cheese (shameer m.pharm analysis 2020)
 
introduction to food analysis ppt.ppt
introduction to food analysis ppt.pptintroduction to food analysis ppt.ppt
introduction to food analysis ppt.ppt
 

More from AnnaKhurshid

12222432.ppt amino acid & protein metabolism
12222432.ppt  amino acid & protein metabolism12222432.ppt  amino acid & protein metabolism
12222432.ppt amino acid & protein metabolismAnnaKhurshid
 
8402594 pm.ppt metabolism of amino acids
8402594 pm.ppt metabolism of amino acids8402594 pm.ppt metabolism of amino acids
8402594 pm.ppt metabolism of amino acidsAnnaKhurshid
 
4043247.ppt biochemistry of water & electrolyte
4043247.ppt biochemistry of water & electrolyte4043247.ppt biochemistry of water & electrolyte
4043247.ppt biochemistry of water & electrolyteAnnaKhurshid
 
fluidandelectrolyteimbalance-180131131237.ppt
fluidandelectrolyteimbalance-180131131237.pptfluidandelectrolyteimbalance-180131131237.ppt
fluidandelectrolyteimbalance-180131131237.pptAnnaKhurshid
 
celiac disease 0r gluten enteropathy ppty
celiac disease 0r gluten enteropathy pptyceliac disease 0r gluten enteropathy ppty
celiac disease 0r gluten enteropathy pptyAnnaKhurshid
 
10560062.ppt biochemistry of respiratory system
10560062.ppt biochemistry of respiratory system10560062.ppt biochemistry of respiratory system
10560062.ppt biochemistry of respiratory systemAnnaKhurshid
 
NB.ppt biochemistry of amino acid & proteins
NB.ppt biochemistry of amino acid & proteinsNB.ppt biochemistry of amino acid & proteins
NB.ppt biochemistry of amino acid & proteinsAnnaKhurshid
 
newmicrosoftpowerpointpresentation-201231054717.pptx
newmicrosoftpowerpointpresentation-201231054717.pptxnewmicrosoftpowerpointpresentation-201231054717.pptx
newmicrosoftpowerpointpresentation-201231054717.pptxAnnaKhurshid
 
carbon monoxide poisoning ppt forensic medicine
carbon monoxide poisoning ppt forensic medicinecarbon monoxide poisoning ppt forensic medicine
carbon monoxide poisoning ppt forensic medicineAnnaKhurshid
 
ards-230220035206-3eb572a7 respiratory distress syndrome.pptx
ards-230220035206-3eb572a7 respiratory distress syndrome.pptxards-230220035206-3eb572a7 respiratory distress syndrome.pptx
ards-230220035206-3eb572a7 respiratory distress syndrome.pptxAnnaKhurshid
 
organophosphate poisoning1 medicne..pptx
organophosphate poisoning1 medicne..pptxorganophosphate poisoning1 medicne..pptx
organophosphate poisoning1 medicne..pptxAnnaKhurshid
 
5682673.ppt biochemistry of lipid metabolism
5682673.ppt biochemistry of lipid metabolism5682673.ppt biochemistry of lipid metabolism
5682673.ppt biochemistry of lipid metabolismAnnaKhurshid
 
mygeneticspresentation-141130173403-conversion-gate02.pptx
mygeneticspresentation-141130173403-conversion-gate02.pptxmygeneticspresentation-141130173403-conversion-gate02.pptx
mygeneticspresentation-141130173403-conversion-gate02.pptxAnnaKhurshid
 
Anatomy, physiology, biochemistry of GIT.ppt
Anatomy, physiology, biochemistry of GIT.pptAnatomy, physiology, biochemistry of GIT.ppt
Anatomy, physiology, biochemistry of GIT.pptAnnaKhurshid
 
PUD.pptx peptic ulcer disease biochemistrymedicine
PUD.pptx peptic ulcer disease biochemistrymedicinePUD.pptx peptic ulcer disease biochemistrymedicine
PUD.pptx peptic ulcer disease biochemistrymedicineAnnaKhurshid
 
l5nr-171221075659.pptxbiochemistryyyyyyy
l5nr-171221075659.pptxbiochemistryyyyyyyl5nr-171221075659.pptxbiochemistryyyyyyy
l5nr-171221075659.pptxbiochemistryyyyyyyAnnaKhurshid
 
xerostromia.ppt biochemistry of git tract
xerostromia.ppt biochemistry of git tractxerostromia.ppt biochemistry of git tract
xerostromia.ppt biochemistry of git tractAnnaKhurshid
 
Acid base balance slides-biochemistry.ppt
Acid base balance slides-biochemistry.pptAcid base balance slides-biochemistry.ppt
Acid base balance slides-biochemistry.pptAnnaKhurshid
 
enzymes-160517003157.pptxbiochemistryyyy
enzymes-160517003157.pptxbiochemistryyyyenzymes-160517003157.pptxbiochemistryyyy
enzymes-160517003157.pptxbiochemistryyyyAnnaKhurshid
 
organophosphoruspoisoningfinal-170803080008.pptx
organophosphoruspoisoningfinal-170803080008.pptxorganophosphoruspoisoningfinal-170803080008.pptx
organophosphoruspoisoningfinal-170803080008.pptxAnnaKhurshid
 

More from AnnaKhurshid (20)

12222432.ppt amino acid & protein metabolism
12222432.ppt  amino acid & protein metabolism12222432.ppt  amino acid & protein metabolism
12222432.ppt amino acid & protein metabolism
 
8402594 pm.ppt metabolism of amino acids
8402594 pm.ppt metabolism of amino acids8402594 pm.ppt metabolism of amino acids
8402594 pm.ppt metabolism of amino acids
 
4043247.ppt biochemistry of water & electrolyte
4043247.ppt biochemistry of water & electrolyte4043247.ppt biochemistry of water & electrolyte
4043247.ppt biochemistry of water & electrolyte
 
fluidandelectrolyteimbalance-180131131237.ppt
fluidandelectrolyteimbalance-180131131237.pptfluidandelectrolyteimbalance-180131131237.ppt
fluidandelectrolyteimbalance-180131131237.ppt
 
celiac disease 0r gluten enteropathy ppty
celiac disease 0r gluten enteropathy pptyceliac disease 0r gluten enteropathy ppty
celiac disease 0r gluten enteropathy ppty
 
10560062.ppt biochemistry of respiratory system
10560062.ppt biochemistry of respiratory system10560062.ppt biochemistry of respiratory system
10560062.ppt biochemistry of respiratory system
 
NB.ppt biochemistry of amino acid & proteins
NB.ppt biochemistry of amino acid & proteinsNB.ppt biochemistry of amino acid & proteins
NB.ppt biochemistry of amino acid & proteins
 
newmicrosoftpowerpointpresentation-201231054717.pptx
newmicrosoftpowerpointpresentation-201231054717.pptxnewmicrosoftpowerpointpresentation-201231054717.pptx
newmicrosoftpowerpointpresentation-201231054717.pptx
 
carbon monoxide poisoning ppt forensic medicine
carbon monoxide poisoning ppt forensic medicinecarbon monoxide poisoning ppt forensic medicine
carbon monoxide poisoning ppt forensic medicine
 
ards-230220035206-3eb572a7 respiratory distress syndrome.pptx
ards-230220035206-3eb572a7 respiratory distress syndrome.pptxards-230220035206-3eb572a7 respiratory distress syndrome.pptx
ards-230220035206-3eb572a7 respiratory distress syndrome.pptx
 
organophosphate poisoning1 medicne..pptx
organophosphate poisoning1 medicne..pptxorganophosphate poisoning1 medicne..pptx
organophosphate poisoning1 medicne..pptx
 
5682673.ppt biochemistry of lipid metabolism
5682673.ppt biochemistry of lipid metabolism5682673.ppt biochemistry of lipid metabolism
5682673.ppt biochemistry of lipid metabolism
 
mygeneticspresentation-141130173403-conversion-gate02.pptx
mygeneticspresentation-141130173403-conversion-gate02.pptxmygeneticspresentation-141130173403-conversion-gate02.pptx
mygeneticspresentation-141130173403-conversion-gate02.pptx
 
Anatomy, physiology, biochemistry of GIT.ppt
Anatomy, physiology, biochemistry of GIT.pptAnatomy, physiology, biochemistry of GIT.ppt
Anatomy, physiology, biochemistry of GIT.ppt
 
PUD.pptx peptic ulcer disease biochemistrymedicine
PUD.pptx peptic ulcer disease biochemistrymedicinePUD.pptx peptic ulcer disease biochemistrymedicine
PUD.pptx peptic ulcer disease biochemistrymedicine
 
l5nr-171221075659.pptxbiochemistryyyyyyy
l5nr-171221075659.pptxbiochemistryyyyyyyl5nr-171221075659.pptxbiochemistryyyyyyy
l5nr-171221075659.pptxbiochemistryyyyyyy
 
xerostromia.ppt biochemistry of git tract
xerostromia.ppt biochemistry of git tractxerostromia.ppt biochemistry of git tract
xerostromia.ppt biochemistry of git tract
 
Acid base balance slides-biochemistry.ppt
Acid base balance slides-biochemistry.pptAcid base balance slides-biochemistry.ppt
Acid base balance slides-biochemistry.ppt
 
enzymes-160517003157.pptxbiochemistryyyy
enzymes-160517003157.pptxbiochemistryyyyenzymes-160517003157.pptxbiochemistryyyy
enzymes-160517003157.pptxbiochemistryyyy
 
organophosphoruspoisoningfinal-170803080008.pptx
organophosphoruspoisoningfinal-170803080008.pptxorganophosphoruspoisoningfinal-170803080008.pptx
organophosphoruspoisoningfinal-170803080008.pptx
 

Recently uploaded

APM Welcome, APM North West Network Conference, Synergies Across Sectors
APM Welcome, APM North West Network Conference, Synergies Across SectorsAPM Welcome, APM North West Network Conference, Synergies Across Sectors
APM Welcome, APM North West Network Conference, Synergies Across SectorsAssociation for Project Management
 
Grant Readiness 101 TechSoup and Remy Consulting
Grant Readiness 101 TechSoup and Remy ConsultingGrant Readiness 101 TechSoup and Remy Consulting
Grant Readiness 101 TechSoup and Remy ConsultingTechSoup
 
Arihant handbook biology for class 11 .pdf
Arihant handbook biology for class 11 .pdfArihant handbook biology for class 11 .pdf
Arihant handbook biology for class 11 .pdfchloefrazer622
 
The basics of sentences session 2pptx copy.pptx
The basics of sentences session 2pptx copy.pptxThe basics of sentences session 2pptx copy.pptx
The basics of sentences session 2pptx copy.pptxheathfieldcps1
 
PSYCHIATRIC History collection FORMAT.pptx
PSYCHIATRIC   History collection FORMAT.pptxPSYCHIATRIC   History collection FORMAT.pptx
PSYCHIATRIC History collection FORMAT.pptxPoojaSen20
 
mini mental status format.docx
mini    mental       status     format.docxmini    mental       status     format.docx
mini mental status format.docxPoojaSen20
 
The Most Excellent Way | 1 Corinthians 13
The Most Excellent Way | 1 Corinthians 13The Most Excellent Way | 1 Corinthians 13
The Most Excellent Way | 1 Corinthians 13Steve Thomason
 
Software Engineering Methodologies (overview)
Software Engineering Methodologies (overview)Software Engineering Methodologies (overview)
Software Engineering Methodologies (overview)eniolaolutunde
 
Mastering the Unannounced Regulatory Inspection
Mastering the Unannounced Regulatory InspectionMastering the Unannounced Regulatory Inspection
Mastering the Unannounced Regulatory InspectionSafetyChain Software
 
CARE OF CHILD IN INCUBATOR..........pptx
CARE OF CHILD IN INCUBATOR..........pptxCARE OF CHILD IN INCUBATOR..........pptx
CARE OF CHILD IN INCUBATOR..........pptxGaneshChakor2
 
SOCIAL AND HISTORICAL CONTEXT - LFTVD.pptx
SOCIAL AND HISTORICAL CONTEXT - LFTVD.pptxSOCIAL AND HISTORICAL CONTEXT - LFTVD.pptx
SOCIAL AND HISTORICAL CONTEXT - LFTVD.pptxiammrhaywood
 
Employee wellbeing at the workplace.pptx
Employee wellbeing at the workplace.pptxEmployee wellbeing at the workplace.pptx
Employee wellbeing at the workplace.pptxNirmalaLoungPoorunde1
 
Presiding Officer Training module 2024 lok sabha elections
Presiding Officer Training module 2024 lok sabha electionsPresiding Officer Training module 2024 lok sabha elections
Presiding Officer Training module 2024 lok sabha electionsanshu789521
 
Incoming and Outgoing Shipments in 1 STEP Using Odoo 17
Incoming and Outgoing Shipments in 1 STEP Using Odoo 17Incoming and Outgoing Shipments in 1 STEP Using Odoo 17
Incoming and Outgoing Shipments in 1 STEP Using Odoo 17Celine George
 
How to Make a Pirate ship Primary Education.pptx
How to Make a Pirate ship Primary Education.pptxHow to Make a Pirate ship Primary Education.pptx
How to Make a Pirate ship Primary Education.pptxmanuelaromero2013
 
Q4-W6-Restating Informational Text Grade 3
Q4-W6-Restating Informational Text Grade 3Q4-W6-Restating Informational Text Grade 3
Q4-W6-Restating Informational Text Grade 3JemimahLaneBuaron
 
microwave assisted reaction. General introduction
microwave assisted reaction. General introductionmicrowave assisted reaction. General introduction
microwave assisted reaction. General introductionMaksud Ahmed
 

Recently uploaded (20)

APM Welcome, APM North West Network Conference, Synergies Across Sectors
APM Welcome, APM North West Network Conference, Synergies Across SectorsAPM Welcome, APM North West Network Conference, Synergies Across Sectors
APM Welcome, APM North West Network Conference, Synergies Across Sectors
 
Grant Readiness 101 TechSoup and Remy Consulting
Grant Readiness 101 TechSoup and Remy ConsultingGrant Readiness 101 TechSoup and Remy Consulting
Grant Readiness 101 TechSoup and Remy Consulting
 
Arihant handbook biology for class 11 .pdf
Arihant handbook biology for class 11 .pdfArihant handbook biology for class 11 .pdf
Arihant handbook biology for class 11 .pdf
 
The basics of sentences session 2pptx copy.pptx
The basics of sentences session 2pptx copy.pptxThe basics of sentences session 2pptx copy.pptx
The basics of sentences session 2pptx copy.pptx
 
TataKelola dan KamSiber Kecerdasan Buatan v022.pdf
TataKelola dan KamSiber Kecerdasan Buatan v022.pdfTataKelola dan KamSiber Kecerdasan Buatan v022.pdf
TataKelola dan KamSiber Kecerdasan Buatan v022.pdf
 
PSYCHIATRIC History collection FORMAT.pptx
PSYCHIATRIC   History collection FORMAT.pptxPSYCHIATRIC   History collection FORMAT.pptx
PSYCHIATRIC History collection FORMAT.pptx
 
mini mental status format.docx
mini    mental       status     format.docxmini    mental       status     format.docx
mini mental status format.docx
 
Model Call Girl in Bikash Puri Delhi reach out to us at 🔝9953056974🔝
Model Call Girl in Bikash Puri  Delhi reach out to us at 🔝9953056974🔝Model Call Girl in Bikash Puri  Delhi reach out to us at 🔝9953056974🔝
Model Call Girl in Bikash Puri Delhi reach out to us at 🔝9953056974🔝
 
The Most Excellent Way | 1 Corinthians 13
The Most Excellent Way | 1 Corinthians 13The Most Excellent Way | 1 Corinthians 13
The Most Excellent Way | 1 Corinthians 13
 
Software Engineering Methodologies (overview)
Software Engineering Methodologies (overview)Software Engineering Methodologies (overview)
Software Engineering Methodologies (overview)
 
Mastering the Unannounced Regulatory Inspection
Mastering the Unannounced Regulatory InspectionMastering the Unannounced Regulatory Inspection
Mastering the Unannounced Regulatory Inspection
 
CARE OF CHILD IN INCUBATOR..........pptx
CARE OF CHILD IN INCUBATOR..........pptxCARE OF CHILD IN INCUBATOR..........pptx
CARE OF CHILD IN INCUBATOR..........pptx
 
CĂłdigo Creativo y Arte de Software | Unidad 1
CĂłdigo Creativo y Arte de Software | Unidad 1CĂłdigo Creativo y Arte de Software | Unidad 1
CĂłdigo Creativo y Arte de Software | Unidad 1
 
SOCIAL AND HISTORICAL CONTEXT - LFTVD.pptx
SOCIAL AND HISTORICAL CONTEXT - LFTVD.pptxSOCIAL AND HISTORICAL CONTEXT - LFTVD.pptx
SOCIAL AND HISTORICAL CONTEXT - LFTVD.pptx
 
Employee wellbeing at the workplace.pptx
Employee wellbeing at the workplace.pptxEmployee wellbeing at the workplace.pptx
Employee wellbeing at the workplace.pptx
 
Presiding Officer Training module 2024 lok sabha elections
Presiding Officer Training module 2024 lok sabha electionsPresiding Officer Training module 2024 lok sabha elections
Presiding Officer Training module 2024 lok sabha elections
 
Incoming and Outgoing Shipments in 1 STEP Using Odoo 17
Incoming and Outgoing Shipments in 1 STEP Using Odoo 17Incoming and Outgoing Shipments in 1 STEP Using Odoo 17
Incoming and Outgoing Shipments in 1 STEP Using Odoo 17
 
How to Make a Pirate ship Primary Education.pptx
How to Make a Pirate ship Primary Education.pptxHow to Make a Pirate ship Primary Education.pptx
How to Make a Pirate ship Primary Education.pptx
 
Q4-W6-Restating Informational Text Grade 3
Q4-W6-Restating Informational Text Grade 3Q4-W6-Restating Informational Text Grade 3
Q4-W6-Restating Informational Text Grade 3
 
microwave assisted reaction. General introduction
microwave assisted reaction. General introductionmicrowave assisted reaction. General introduction
microwave assisted reaction. General introduction
 

7 Proximate analysis.pptxbiochemistryyyy

  • 1. Proximate analysis • A method for the quantitative analysis of different macronutrients in feed is the Weende or proximate analysis • Weende analysis was developed in 1860 by Henneberg and Stohmann in Germany. • Proximate Analysis is a partitioning of compounds in a feed into six categories based on the chemical properties of the compounds • Moisture Contents • Ash • Crude Protein • Crude Fat • Crude Fibre • Nitrogen-free extracts (digestible carbohydrates)
  • 2. Moisture contents • The moisture contents are very important in the sense: As moisture content of feed varies, its proximate composition also varies and consequently it nutritional value also varies • As the moisture content increased the dry matter decreased, while purchasing the feed the dry matter content is taken into consideration, rather than gross weight of the feed • Moisture content is important in storage of feed • In general feed more than 11% moisture get mold and spoiled • Moisture is determined by drying a feed sample in a hot air oven at 100 oC for a specified length of time • The loss of weight is the moisture content of the sample • The residue left over after the removal of moisture is called the dry matter
  • 3. Procedure • Accurately weight a moisture dish of appropriate size • Add approximately 10 g of the sample and reweight • Place the container in a vacuum oven at 100 °C for approximately 5 hours. • Remove dish from the oven, cover, cool in desiccator, and weight • Re-dry 1 hr and repeat process until constant weight has been achieved • Calculate the percentage moisture (wet weight basis) as follows: Percent moisture= (P-a) x 100 P • P = sample weight in g a = dried sample weight in g
  • 4. Ash contents • Ash is one of the components in the proximate analysis of biological materials • The residues after a sample is completely burnt • The residue from burning any biological material in furnace at 550 °C is called ash • The total ash content is designed to measure the total amount of residual material after ignition • Ashing is the first step in the preparation of a sample for specific elemental analysis by atomic spectroscopy
  • 5. Procedure • We take dried sample in a crucible • Place crucible in drying oven at 100 °C for 24 hours. • Transfer to muffle furnace and increase the temperature step wise to 550 °C Âą 5 °C. • Maintain temperature for 6 hours. • When the sample completely burnt and ash became white the crucible was recovered from the furnace and cooled in desiccator. • If white ash is not obtained after 6 hours, moisten ash with distilled water, slowly dry on a hot plate, and re-ash at 550 °C to constant weight. • Repeat if necessary. The ash content was weighed and percentage is calculated as follow: Ash: Weight of ash in sample x100 weight of the sample
  • 6. Crude protein • Estimated by a process developed in 1883 by a Brewer Johann Kjeldahl • He discovered that "all protein" contains about the same amount of nitrogen (16%). • He analysed for nitrogen, which is relatively easy, and calculated crude protein on the basis: 100/16 = 6.25 • therefore: NITROGEN x 6.25 = CRUDE PROTEIN • The Kjeldahl procedure can be basically divided into three parts: (1) digestion, (2) distillation, (3) titration. • Placing 1 gm of the sample containing protein, into a digestion flask, along with 12-15 mL of concentrated sulfuric acid (H2SO4) • Heating the mixture in the flask until white fumes can be seen, and then continuing the heating for about 60-90 mins. • Cooling the flask and cautiously adding 250 ml of water.
  • 7. • To digested mixture, 40% NaOH was added and the resultant mixture was distilled in Micro-Kjeldahl apparatus. • The purpose of distillation, is to separate the ammonia (that is, the nitrogen) from the digestion mixture • The liberated ammonia was condensed and collected in Sulphuric acid solution having methyl orange as an indicator. This dye should turn a strong color, indicating that a significant amount of the original trapping acid is still present. Titration • Putting a standard solution of NaOH (sodium hydroxide) into the buret (a long tube with a tap at the end), and slowly, slowly adding small amounts of the sodium hydroxide solution to the acid solution with the dye. • watching for the point at which the dye turns orange, indicating that the "endpoint" has been reached and that now all the acid has been neutralized by the base. • Recording the volume of the neutralizing base (sodium hydroxide solution) that was necessary to reach the endoint. • Performing a calculation to find the amount of ammonia, and thus nitrogen, that came from the original sample.
  • 8. 0.0014 is factor for equivalence of H2SO4 to NH3 Distillation: The action of purifying a liquid by a process of heating and cooling. Titration is a technique where a solution of known concentration is used to determine the concentration of an unknown solution Percentage of Nitrogen in selected sample was calculated as: To convert to protein multiply by the appropriate factor: x 6.25 for meat and general protein x 6.38 for milk protein x 5.70 for cereal protein.
  • 9. Crude fat • Crude fat is also known as ether extract • It is estimated by extraction with petroleum ether (boiling point 40-60 °C) by a soxhlet extractor • A dried, ground sample is extracted with diethyl ether which dissolves fats, oils, pigments and other fat soluble substances. • The ether is then evaporated from the fat solution. • The resulting residue is weighed and referred to as ether extract or crude fat. • Both the ether and the samples must be free of moisture to avoid co- extraction of water-soluble components in the sample such as carbohydrates, urea, lactic acid, glycerol, etc. • Low temperatures are used to evaporate the ether and remove residual moisture to prevent oxidation of the fat.
  • 10. • The crude fat is determined by extracting powdered sample with petroleum ether, using a Soxhlet apparatus. • Dried sample (5 g) was taken in a thimble and was placed in the extraction tube of Soxhlet apparatus. • The temperature of the heater was so adjusted that continuous drops of ether fell on the sample in extraction tube. • The process of extraction was carried out for 16 hours to allow complete extraction. • Then the sample was removed and the solvent was evaporated under the fume hood. • The extract was completely dried in oven for 30 minutes at 105oC. The weight of extract was recorded after cooling in desiccator. Crude fat in the samples were calculated by using following formula. • Crude fat (%) = Weight of fat in sample (g) × 100 Weight of sample (g) Soxhlet Extractor
  • 11. Crude Fiber • In a 1000 mL beaker, 3 g of dried and fat free sample was taken. • 200 mL of 1.25 % H2SO4 was added to it and level of beaker was marked. • This was allowed to boil for 30 minutes with constant stirring • These contents were filtered while warmed giving 2 to 3 washings with hot water until it became alkali free. • The residue was carefully transferred in a crucible (W1) and dried in hot air oven at 100°C for 3-4 hours until smoke ceased to come out. • Then this sample W2 (sample+crucible) was put in a muffle furnace at 550 °C for 4 hours until grey color ash was obtained. • This was allowed to cool in a desiccator and reweighed (W3). % crude fiber in ground sample = Loss in weight on ignition (W2 - W1) – (W3 - W1) x 100 Weight of the sample
  • 12. Nitrogen free extract (NFE) • Nitrogen free extracts percentage was calculated by the formula: %NFE = 100-(% of crude proteins + % crude fiber + % crude fat + % crude ash) • NFE supposedly represents the soluble carbohydrate of the feed, such as starch and sugar.
  • 13. Assessment of Nutritional Status • Nutritional assessment is the interpretation of anthropometric, biochemical (laboratory), clinical and dietary data to determine whether a person or groups of persons are well nourished or malnourished. • The consumption of adequate amount of food both in terms of quantity and quality is one of the key determinants, which has a significant impact on the nutritional status • Eating pattern of an individual is a crucial factor that dictates the occurrence of a disease, especially some chronic conditions such as coronary heart disease, hypertension, stroke, diabetes mellitus, and cancer • In addition, adverse outcomes such as low birth weight, malnutrition, disability, poor quality of life, and mortality are also related to poor eating pattern in both developed and under developing countries
  • 14. METHODS FOR NUTRITIONAL ASSESSMENT • The assessment of the nutritional status involves two methods: • Direct (deals with individuals and measures the objective criteria) • These methods include ABCD, anthropometric, biochemical, clinical and dietary measurements to cover all the phases of the disease • Each of them has some advantages and limitations • Utilizing all of them to assess the nutritional status gives an overall picture of an individual’s nutritional status • The use of any one method or a combination of methods is recommended depending on the purpose of the nutritional assessment
  • 15. Indirect (uses community health indices reflecting nutritional influences) • Ecological variables including agricultural crops production, Economic factors e.g. household income, per capita income, population density, food availability and prices, Cultural and social habits • Vital health statistics: morbidity, mortality and other health indicators e.g., infant and under-fives mortality, Utilization of maternal and child health care services, fertility indices and sanitary conditions
  • 16. Anthropometric measurements • Include height, weight, skin-fold thickness, and circumference • It is an essential component of clinical examination of infants, children & pregnant women • It could detect the change of body composition to assess the nutritional status in specific population groups, including newborn, children and adults • These measurements are compared to the reference data (standards) of the same age and sex group, in order to evaluate the nutritional status. • The advantage is that routine anthropometric measurements can suggest patterns of growth and development of an individual Biochemical and Laboratory investigations • Extremely helpful in detecting early changes in body metabolism and nutrition before the appearance of clinical signs • The results obtained are precise, accurate and reproducible
  • 17. • Initial Laboratory Assessment includes Laboratory tests based on blood and urine can be important indicators of nutritional status, but they are influenced by non-nutritional factors as well • Lab results can be altered by medications, hydration status, and disease states or other metabolic processes, such as stress • Hemoglobin estimation is the most important test & useful index of the overall state of nutrition. Beside anemia it also tells about protein & trace element nutrition
  • 18. Dietary assessment Nutritional intake of humans is assessed by five different methods 1. 24 Hours Dietary Recall 2. Food Frequency Questionnaire 3. Diet history 4. Food Diary 5. Observed Food Consumption Interpretation of Dietary Data  Qualitative Method Using the food pyramid & the basic food groups method • Different nutrients are classified into 5 groups (fat & oils, bread & cereals, milk products, meat-fish-poultry, vegetables & fruits) • Determine the number of servings from each group & compare it with minimum requirements Quantitative Method • The amount of energy & specific nutrients in each food consumed can be calculated using food composition tables & then compare it with the recommended daily intake
  • 19. Functional indicators • These indicators for nutritional status are emerging as an important category of diagnostic tools and supporting the biochemical investigations • Some of the commonly used functional indices are for hemostasis and nerve conduction Hemostasis or haemostasis is a process to prevent and stop bleeding, meaning to keep blood within a damaged blood vessel (the opposite of hemostasis is hemorrhage). It is the first stage of wound healing. This involves coagulation, blood changing from a liquid to a gel A nerve conduction velocity (NCV) test — also called a nerve conduction study (NCS) — measures how fast an electrical impulse moves through your nerve. NCV can identify nerve damage Vital statistics • All the data collected from different countries will present an overall picture of the nutritional status for that population of interest to help the government-making policy decisions. • For example, analysis of morbidity and mortality data can be used in estimating the prevalence of the disease in the community and identifying the high-risk groups
  • 20. Ecological factors • Different ecological factors such as socioeconomic factors, quality, accessibility, availability of health care services, and diseases effect on occurrence of malnutrition • It is extremely important to make an “ecological diagnosis” to identify, which factors will affect the nutrition status of the community
  • 21. Protein Quality Assessment • Protein quality is the digestibility and quantity of essential amino acids for providing the proteins in correct ratios for human consumption • Protein quality can be measured by calculating the nitrogen used for tissue formation divided by the nitrogen absorbed from food. This product is multiplied by 100 and expressed as a percentage of nitrogen utilized. • A complete protein or whole protein is a food source of protein that contains an adequate proportion of each of the nine essential amino acids necessary in the human diet. Examples of single-source complete proteins are red meat, poultry, fish, eggs, milk, cheese and yogurt • A general recommendation for healthy adults is to eat at least 0.36 grams of protein per pound of your body weight each day — but you may need more depending on your activity level and general health
  • 22. Factors Effecting Protein quality There are a number of factors which may affect the protein quality from food • The amino acid profile of the protein • The structure of the protein • The digestibility of the protein • The amount of protein consumed in one meal • Other nutrients and food constituents present in the meal, e.g. fiber, carbohydrate • How the food has been prepared • Recent intake of protein • The metabolic state of the individual, e.g. illness, exercise, sleep • The individual's age, weight, sex, and general health
  • 23. Methods of Determining Protein Quality 1. Amino Acid Scoring (AAS) • AAS is fast and cheap. It measures the essential amino acids (EAAs) – also known as indispensable amino acids (IAAs) – present in a protein and compares the values with a reference protein 2. Protein Efficiency Ratio (PER) • PER measures the ability of a protein to support the growth. It represents the ratio of weight gain to the amount of protein consumed 3. Nitrogen Protein Utilization (NPU) • This is the ratio of the nitrogen used for tissue formation versus the amount of nitrogen digested. This method doesn’t account for the amino acid profile 4. Biological Value (BV) • BV is the most commonly used and well-known protein scoring system. It measures the amount of nitrogen retained in comparison to the amount of nitrogen absorbed. It looks at how similar the amino acid profile is to that of human requirements. Proteins are grouped into those of high BV (HBV) and low BV (LBV)
  • 24. 6. Protein Digestibility-Corrected Amino Acid Score (PDCAAS) • The protein digestibility-corrected amino acid score (PDCAAS) has been adopted by FAO/WHO as the preferred method for the measurement of the protein value in human nutrition • PDCAAS takes into account the profile of IAAs of the protein in question, as well as its digestibility in humans; it is the AAS with an added digestibility component. Scores are from 0.1 to 1.0, with 1.0 being a high-quality protein 7. Digestible Indispensable Amino Acid Score (DIAAS) DIAAS is much like PDCAAS in that it determines the digestibility of the amino acids as well as the protein’s contribution to human amino acid and nitrogen requirements. DIASS is shown as a percentage and doesn’t limit to scoring the protein to a maximum value; instead, proteins can have a higher score DIAAS hasn’t been adopted as the preferred protein scoring method US FAO