How Earth-imaging satellites tracked the changes over the last 25 years in the wake of the nuclear accident. By Astrium GEO-Information Services. More Information on www.astrium-geo.com.
Reconnaissance satellite or Spy Satellite Shakir Memon
Reconnaissance satellites provide intelligence information about other countries' military activities from space. There are several types, including imagery satellites, signals intelligence satellites, early warning satellites, and satellites that detect nuclear explosions. Reconnaissance satellites played an important role in conflicts like the Vietnam and Iraq wars by providing positions of enemy troops and equipment. While useful for military purposes, they also raise privacy and security concerns due to their surveillance capabilities. The KH-11 satellite launched by the US in 1976 was a milestone as the first American satellite to use digital imaging to take high resolution photographs from orbit.
The document discusses the use of meteorological satellites, weather balloons, and sounding rockets for weather forecasting. It provides background on severe weather events that have caused major damage, highlighting the need for improved forecasting. It then describes some of the first meteorological satellites, including TIROS-1, which was the first to transmit cloud photos from space. It also discusses the NIMBUS satellites, which had improved coverage over the TIROS satellites and helped enable long-term observations of phenomena like the ozone hole.
Types of satellite metrological & resource satellitesManish Kothe
The document discusses different types of satellites used for remote sensing including earth resource satellites, Landsat series satellites, SPOT satellites, Indian remote sensing satellites, IKONOS, meteorological/weather satellites like NOAA and GOES, and Indian national satellites like INSAT. It provides details on the sensors, spectral and spatial resolution, swath width, orbital altitude, and launch period of these various satellite systems used for monitoring earth's resources, weather, environment and climate.
This technical seminar report discusses spy satellites. It provides an overview of spy satellites including their evolution from early balloons and aircraft to modern optical and radar imaging satellites. It describes the key types of spy satellites such as optical imaging, nuclear detection, and radar imaging satellites. The report also outlines the basic architecture of spy satellites including their payload, control section, and recovery vehicle. It discusses technologies used in blocks of US KH-11 spy satellites and applications such as change detection, mapping, and military uses. Finally, it notes future directions including more powerful private and government satellites.
The document summarizes India's remote sensing satellite program. It began with the Aryabhata satellite in 1975 and includes both satellites launched on foreign rockets as well as India's indigenously developed satellites launched using the PSLV rocket. The IRS satellite program supports applications in agriculture, water resources, forestry, geology and other areas. Key satellites discussed include IRS-1A, IRS-1B, IRS-1C, Resourcesat and Cartosat. The IRS system currently includes 11 operational satellites providing data at a variety of spatial, spectral and temporal resolutions to support civilian remote sensing.
Thermal infrared remote sensing involves observing electromagnetic radiation emitted from objects in the thermal infrared wavelength range of 3-14 micrometers. In this range, sensors can detect the thermal radiative properties of ground materials. Thermal infrared imagery captures relative differences in surface temperature or radiance. Interpreting thermal images requires understanding factors like the time of day the image was taken, whether it is a positive or negative image, and how emissivity and other surface characteristics impact observed radiation and temperature values.
This document provides an overview of optical remote sensing. It discusses the different types of optical remote sensing systems including panchromatic, multispectral, super spectral, and hyperspectral imaging systems. It describes the key characteristics and capabilities of each type of system. The document also discusses resolutions in remote sensing including spatial, spectral, temporal, and radiometric resolutions. It outlines several applications of optical remote sensing including urban mapping, hydrological monitoring, environmental monitoring, agriculture/forestry, and hazard identification. Finally, it lists some examples of data sources for different types of optical remote sensing systems.
The ambiguities between snow, clouds and sea ice could potentially be resolved by:
- Using multi-spectral data to exploit differences in reflectance spectra between snow, clouds and sea ice at different wavelengths.
- Combining visible/infrared data with microwave data, since microwave is less sensitive to clouds and can better distinguish between dry snow, wet snow and sea ice based on their emissivity/scattering properties.
- Using temporal information from multiple images over time. Snow and sea ice coverage would be relatively static while clouds are more transient.
- Ancillary data like weather reports, reanalysis data and climatological information on snow/ice distribution could provide context to help interpret the satellite observations.
This presentation discusses scales used in photographs. It explains that scale is the ratio of an object's size in a photo to its actual size on the ground. Scale can be expressed through a unit equivalent, representative fraction, or ratio. Knowing the camera focal length and aircraft altitude allows one to determine the scale of a vertical photograph. The presentation was given by Mr. Amol V. Ghogare of SRES, SCOE, Kopargaon on the topic of scales used in photographs.
Lec_13_Introduction to Remote Sensing (RS)Atiqa khan
Remote sensing involves obtaining information about objects without direct contact using sensors to measure reflected or emitted electromagnetic radiation. It includes gathering data from aircraft or spacecraft using techniques ranging from aerial photographs to satellite images. The basic principle is that electromagnetic radiation interacts with the atmosphere and earth, and radiation reflected or emitted from objects is the source of remote sensing data.
The Landsat program is the longest running satellite program for imaging Earth. It began in 1972 with the launch of Landsat 1 and has continued with subsequent launches of Landsat satellites every few years. Landsat satellites acquire millions of images with spectral bands at resolutions from 15-60 meters to support research in global change, agriculture, geology, forestry and other areas. Landsat 7, launched in 1999, still operates today despite an instrument failure, providing images every 16 days.
geo information ppt in disaster managementKirpaldumaniya
1) Geographic Information Systems (GIS) integrate hardware, software and data to visualize, analyze and display spatial information that can be used for disaster management planning and response.
2) GIS and remote sensing technologies such as satellites can be used to map hazards, monitor disaster-prone areas, assess damage and support situational awareness during emergencies like earthquakes and floods.
3) GPS provides precise location data that enables GIS mapping and supports disaster operations by tracking personnel and resources in the field.
The advantage of digital imagery is that it allows us to manipulate the digital pixel values in the image. Even after the radiometric corrections image may still not be optimized for visual interpretation. An image 'enhancement' is basically anything that makes it easier or better to visually interpret. An enhancement is performed for a specific application as well. This enhancement may be inappropriate for another purpose, which would demand a different type of enhancement.
Filtering is used to enhance the appearance of an image. Spatial filters are designed to highlight or suppress specific features in an image based on their spatial frequency. ‘Rough’ textured areas of an image, where the changes in tone are abrupt, have high spatial frequencies, while ‘smooth’ areas with little variation have low spatial frequencies. A common filtering procedure involves moving a ‘matrix' of a few pixels in dimension (ie. 3x3, 5x5, etc.) over each pixel in the image, using mathematical calculation and replacing the central pixel with the new value.
A low-pass filter is designed to emphasize larger, homogeneous areas of similar tone and reduce the smaller detail in an image. Thus, low-pass filters generally serve to smooth the appearance of an image. In some cases, like 'low-pass filtering', the enhanced image can actually look worse than the original, but such an enhancement was likely performed to help the interpreter see low spatial frequency features among the usual high frequency clutter found in an image. High-pass filters do the opposite and serve to sharpen the appearance of fine detail in an image. Directional, or edge detection filters are designed to highlight linear features, such as roads or field boundaries. These filters can also be designed to enhance features which are oriented in specific directions.
THIS PRESENTATION IS TO HELP YOU PERFORM THE TASK STEP BY STEP.
mateorological and ocean monitoring satellite (2).pptxsapna kinattinkara
This document summarizes meteorological and ocean monitoring satellites. It discusses the main types of meteorological satellites including geostationary and polar-orbiting satellites. It provides details on specific meteorological satellite programs run by countries and organizations like the US, Europe, India, and Japan. These include NOAA, GOES, Meteosat, Nimbus, Megha-Tropiques, and INSAT satellites. The document also describes the common sensors and image types used by these satellites like AVHRR, TOVS, and visible, infrared, water vapor images. It explains the features and uses of these different sensor images.
Cartografia de Risco de Incêndio Florestal com Software Open SourcePedro Venancio
Cartografia de Risco de Incêndio Florestal com Software Open Source
1. O documento descreve o uso de softwares livres e de código aberto (QGIS, GRASS e gvSIG) para desenvolver mapas de risco de incêndios florestais.
2. Utilizando diversos dados estatísticos, o autor gerou mapas mostrando a probabilidade de ignições, visibilidade, tempos de resposta e fatores topográficos.
3. Os resultados demonstram que softwares livres podem ser usados com sucesso para gerar cartografias
Photogrammetry is the science of obtaining information about physical objects through photographs, without needing direct contact. It involves measuring and analyzing captured images. The name comes from Greek roots meaning "light", "drawing", and "to measure". Key developments included using photography for mapmaking in the 1840s-1850s, the photogrammetric stereoplotter in the 1890s, and aerial photography from balloons and planes in the 1860s-1900s, advancing the field into the digital era.
Digital image processing and interpretationP.K. Mani
This document provides an introduction to digital image interpretation. It discusses what digital images are, how they can be displayed in color composites, and how surface features typically appear on true and false color composites. It also outlines the main steps in digital image processing, including preprocessing, enhancement, transformation, and classification. Preprocessing operations like radiometric and geometric corrections are described in detail. Methods for image registration, resampling, and spatial filtering are also explained. Spatial filters can be used for tasks like edge detection, image smoothing, and enhancing linear features. Examples demonstrate the effects of low-pass filtering for speckle removal and high-pass edge detection.
Remote sensing involves obtaining information about objects without physical contact. It works by sensing and recording electromagnetic radiation reflected or emitted from targets. The key components are an energy source, sensor, platforms, and data analysis to extract information. Sensors can be optical, thermal, or microwave. Platforms include satellites, aircraft, and ground bases. Applications of remote sensing include agriculture, forestry, geology, hydrology, urban planning, and national security.
Energy interaction with earth surface featuressuchismita11
Electromagnetic energy interacts with earth surface features through transmission, reflection, and absorption. The proportion of energy transmitted, reflected, or absorbed depends on factors like the material composition of the feature and the wavelength of the energy. Remote sensing is interested in the reflected energy, which can be specular or diffuse depending on the roughness of the surface relative to the wavelength. The spectral reflectance of a feature varies with wavelength and is characteristic of the material, showing absorption features related to constituents like water and chlorophyll in vegetation. Thermal emission or absorption also depends on the temperature of the feature relative to its surroundings.
Remote sensing is the collection of information about Earth's surface without direct contact. It uses sensors on satellites and aircraft to detect and measure electromagnetic radiation reflected or emitted from objects. There are two types of remote sensing - active uses sensors that emit energy like radar, while passive detects natural energy like sunlight. Applications include monitoring agriculture, forestry, geology, oceans, and the environment. NASA operates many satellites that use different parts of the electromagnetic spectrum to analyze features and changes on Earth.
This document discusses stereoscopy and parallax measurement in aerial photography. Stereoscopy uses two photographs of the same ground area taken from separate positions to create a stereo pair that enables three-dimensional viewing. Parallax is the displacement of an object caused by a change in the point of observation. Stereoscopic parallax occurs when photographs are taken of the same object from different positions, allowing measurement of differences in elevation.
Remote Sensing: Principal Component AnalysisKamlesh Kumar
Principal components analysis is a orthogonal transformational technique (preserving the symmetry between vectors and angles) to reveal new set of data arguably better from the original data set and better capture the essential information as well. It happens often that some variables are highly correlated with a lot of duplication. Instead of discarding the redundant data, principal components analysis condenses the info. in inter-correlated variables into a few variables, called principal components.
The main idea of Principal Component Analysis (PCA) is to reduce the dimensionality of a data set consisting of many variables correlated with each other, either heavily or lightly, while retaining the variation present in the dataset, up to the maximum extent.
THIS PRESENTATION IS TO HELP YOU PERFORM THE TASK STEP BY STEP.
Learn more about Spot Image's offer. This document features an overview of products, services and geospatial solutions provided by Spot Image.
More information on http://www.spotimage.com
25 anni di immagini satellitari su Chernobylfiumevento
Astrium fa una presentazione di alcune delle immagini di Chernobyl più significative rilevate dai satelliti. Assieme a questo sguardo sull'evoluzione del disastro, affianca una presentazione dei vari satelliti che hanno permesso l'acquisizione di suddette immagini.
Impact of climate change in coastal environments with satellite dataSpot Image
Use of SPOTMaps and HRS elevation data to evaluate the potential impact of climate change in coastal environments.
With Spot Image and Geospatial Intelligence.
A 27 anni dal disastro nucleare migliaia di famiglie convivono con livelli di radioattività incompatibili con la salute. Senza nessun futuro. Portiamole via da lì!
Firma la petizione: www.change.org/viadachernobyl
GPS tracking can provide many benefits to businesses that operate vehicle fleets. It allows companies to monitor the real-time location and activity of every vehicle, track each vehicle's daily activities and status. This helps increase productivity, reduce costs, improve customer service and build reputation. Specifically, GPS tracking can help decrease fuel consumption and insurance premiums, validate time cards, ensure accurate billing, quickly respond to customer requests, eliminate unnecessary paperwork and reduce liability. It also increases revenue by boosting productivity, winning more clients, retaining current clients, and reducing costs through lower fuel bills, reduced payroll and vehicle maintenance costs. GPS tracking provides a valuable management tool for fleet operations.
This document provides information about COH Technologies and its customer interaction management solutions. It discusses COH's technology capabilities including its patent pending technology, global clients and processes supported. It also outlines COH's product and services portfolio, growth and recognition in the industry. The document highlights key features of COH's solutions for enterprises, contact centers, SOHOs and service providers including productivity, availability, capability and extensibility. It promotes COH's solutions as enabling pace ahead through these features.
This talk was given by Magnolia CTO Philipp Bärfuss at Magnolia Conference 2015 in Basel, Switzerland.
A overview of key improvements in Magnolia 5.4 from Magnolia CTO Philipp Bärfuss, along with a walkthrough of our product strategy and goals.
Este documento es una guía de usuario para una cámara digital. Proporciona instrucciones sobre el uso básico y avanzado de la cámara, incluyendo detalles sobre los modos de disparo como Auto, Tv, Av y M, funciones de reproducción, Wi-Fi y menús de configuración. La guía también contiene apéndices con solución de problemas, especificaciones de la cámara y un índice.
This document discusses creating an accessible and inclusive mobile experience. It begins by noting that while some devices like the iPhone are popular, they only represent a small portion of the overall mobile device market and user population. It then examines the need to make the mobile web accessible to all users, not just those with certain devices, and provides examples of how usage and capabilities vary greatly across the global mobile landscape. The document advocates for an adaptive approach that considers this diversity and creates an experience optimized for all types of mobile browsers and networks.
This document discusses Google Maps and Earth Enterprise products and services for businesses. It highlights how maps have transformed lives by changing how people get from place to place and discover their surroundings. It then discusses how Google Maps and Earth can help businesses make better decisions, optimize assets and people, drive customer engagement, and build apps. It outlines the key Enterprise products and capabilities around creating, storing, sharing, and managing location data and collaborating. The document promotes Google's mapping tools and data for building map-enabled enterprise solutions in a simple, powerful and useful way.
Leptonmaps supplies RF Maps, RF Network Planning, RF Planning, RF Network planning Maps for different cities and countries which makes rf map planning easy.
This document provides guidance on making decisions through a 7 step process. It uses the example of a person named Amy who wants a new cell phone that costs more than she has saved. The 7 steps are: 1) Relax 2) Say something positive 3) Identify the problem 4) Consider choices 5) Weigh consequences 6) Prioritize what's important 7) Make the decision. For Amy, the document outlines her choices, consequences, and recommends waiting to save more money as the best option based on her priorities.
This document provides a summary of common mistakes in PowerPoint presentation design and tips to avoid them. It identifies the top 5 mistakes as including putting too much information on slides, not using enough visuals, using poor quality visuals, having a disorganized "visual vomit" style, and lack of preparation. The document emphasizes telling a story over slide design, using whitespace on slides, consistent formatting, and spending significant time preparing presentations.
Landsat satellites have been collecting images of Earth's surface for over 30 years, with the first launched in 1972 and most recent in 1999. Instruments onboard have acquired millions of images providing a unique resource for agriculture, geology, forestry, planning, education, mapping, and climate change research. TIROS was NASA's first step to determine if satellites could study Earth, proving weather forecasting from space. AVHRR on NOAA satellites provides global coverage since 1979 in visible, near-infrared, and thermal bands at 1.1km resolution for environmental monitoring.
The purpose of choosing this topic is to aware you about sentinel satellites that leads to new discoveries and ultimately changes the arena of Remote Sensing.
Indian Satellite Program (2001-2020)
India has developed an extensive satellite program over the past two decades focused on earth observation, communication, space science, and navigation. Key satellites include resources satellites to monitor land and water resources, radar satellites like RISAT for all-weather imaging, Cartosat satellites for mapping applications, Oceansat for ocean and atmospheric monitoring, space science satellites like Chandrayaan and Astrosat, and navigation satellites. The program is led by ISRO and has supported applications in agriculture, disaster management, and development planning.
1) The document examines the performance of the EGM2008 global geoid model against GPS and leveling data from Scandinavia, adjacent Baltic areas, and Greenland.
2) Testing in Scandinavia and Baltic areas found that EGM2008 performs at the same level as the best regional geoid model NKG2004, with a standard deviation from leveling-derived geoid heights of 0.24 meters.
3) In Greenland, EGM2008 could not be directly evaluated due to a lack of leveling data, but comparisons to GPS-altimetry data showed performance on par with the regional model GOCINA04.
This document discusses several remote sensing platforms and satellites used for earth observation. It provides information on satellites such as Landsat, SPOT, Ikonos, RADARSAT, as well as international observation programs from agencies such as ESA, ISRO, and JAXA. The document outlines technical specifications including sensors, spectral bands, spatial resolutions, orbits, and coverage areas of the different systems.
The document discusses various remote sensing platforms and Earth observing satellites. It provides information on the characteristics and sensors of satellites operated by different space agencies including Landsat, SPOT, Ikonos, GOES, Meteosat, RADARSAT, IRS series from India, JERS-1 and ADEOS from Japan, and ESA satellites. The document contains detailed tables summarizing the technical specifications of these satellites and their instruments.
remote sensing platforms materials for studentWidyastutiSAA
The document discusses several remote sensing platforms and satellites used for earth observation. It provides details on the characteristics and sensors of Landsat, SPOT, Ikonos, RADARSAT, GOES, Meteosat, IRS and Japanese satellites. These satellites collect multi-spectral imagery for applications like land use mapping, environmental monitoring, disaster management and resource exploration. The document compares the spectral bands, resolutions, coverage and revisit times of the different missions.
Scanners, image resolution, orbit in remote sensing, pk maniP.K. Mani
This document provides information about different types of satellite orbits and sensors. It discusses polar orbits, geostationary orbits, and examples of weather satellites like METEOSAT, NOAA, and GOES that use these orbit types. It also describes imaging sensors on these satellites and their specifications. Sensors on other platforms like Landsat, SPOT, ERS, and Radarsat are outlined along with their characteristics and applications. Scanning techniques for collecting multispectral data like across-track and along-track scanning are defined.
SPOT is a commercial Earth observation satellite system operated by Spot Image. It began in the 1970s with SPOT 1 launched in 1986, and continues today with SPOT 6 and SPOT 7 launched in 2012 and 2014 respectively. The SPOT satellites provide high-resolution optical imagery to map the Earth's surface and monitor human activities and natural phenomena. SPOT 7 carries multispectral sensors and has a resolution of 1.5 meters for panchromatic imagery and 6 meters for multispectral, allowing it to map wide areas quickly and be used for applications like weather prediction, urban mapping, and land use analysis.
This document provides an overview of ocean monitoring satellites operated by ISRO. It discusses Oceansat-1, launched in 1999, and Oceansat-2, launched in 2009. Both satellites carry instruments to monitor ocean color, wind speed, sea surface temperature, and other metrics. Oceansat-3 is planned for 2012-13 to continue these ocean observations. Data from the Oceansat satellites are used for applications like fisheries monitoring, cyclone forecasting, climate research, and assessing water quality.
The document discusses the potential for lunar ultraviolet observatories. It notes that the Moon provides a stable location with no atmosphere to observe UV radiation from sources like the intergalactic medium, exoplanets, and the Earth's magnetosphere and exosphere. A proposed mission called EarthASAP would use a cubesat in lunar orbit to produce the first 3D map of the Earth's exosphere and monitor interactions between the Earth and solar wind. Such observations from the Moon's perspective could provide important data for studying exoplanets and space weather effects. The document outlines the science goals and technological requirements for EarthASAP and lunar UV observatories more broadly.
This presentation covers:
Basics of Satellite communication
Indian Communication satellites
Satellite link and elements of satellite communication
Frequency bands of satellite communication
Different orbits of satellite communication
Link budget calculations
Spaceborne Imagery For Environmental & Disaster Monitoringgpetrie
The document discusses the use of spaceborne imagery for environmental and disaster monitoring. It provides examples of how satellite imagery has been used to monitor various natural disasters such as flooding, landslides, volcanic eruptions and forest fires. It also discusses how satellites are used to monitor ongoing environmental changes, such as receding glaciers, sand and dust storms, algal blooms, mining, agriculture and deforestation. Different types of satellites are used depending on the specific monitoring needs and situations.
Envisat was a large Earth observation satellite launched by the European Space Agency in 2002. It carried 10 instruments to observe the land, oceans, ice, and atmosphere. Envisat had a sun-synchronous polar orbit at an altitude of 790 km, with an orbital period of 101 minutes and a repeat cycle of 35 days. It was designed for a 5 year mission but operated for over 10 years, until contact was lost in 2012. Envisat's observations were used to study topics like atmospheric chemistry, ocean temperatures, winds, hydrology, agriculture, natural hazards, and more.
A multi wavelength_analysis_of_m8_insight_on_the_nature_of_arp_loopSérgio Sacani
This document presents a multi-wavelength analysis of M81 and Arp's loop, a peculiar ring-like structure around M81. Optical images reveal Arp's loop has a filamentary structure with many overlapping dust features. Infrared images show Arp's loop has infrared colors and emission properties similar to Galactic cirrus clouds in the region. The results suggest the light at optical wavelengths comes from recent star formation near M81, M81's extended disk, and scattered light from Galactic cirrus, while the infrared emission is dominated by cold dust from Galactic cirrus.
This document provides an overview of solar storms and space weather. It discusses properties of coronal mass ejections and solar flares, why they occur due to the solar magnetic field becoming unstable, and their effects like geomagnetic storms and auroras. Examples of extreme solar storms in 1921, 1982, 2003 and 2012 are presented. The document also describes the Swedish Space Weather Center's role in providing forecasts and information to users in Sweden and internationally.
This document discusses the potential for radio astronomy on the far side of the Moon. It notes that the lunar environment provides shielding from radio interference and a stable surface for simple antenna arrays. The document proposes that very low frequency radio astronomy to study the "Dark Ages" and "Cosmic Dawn" of the early universe could best be performed from the radio-protected zone of the lunar far side using a phased array of dipole antennas. It describes the Netherlands-Chinese Low-Frequency Explorer (NCLE) lunar satellite experiment onboard the Chinese Chang'E 4 relay satellite as a first step towards pathfinding radio astronomy capabilities on the far side of the Moon.
Similar to Nuclear - 25 years of satellite imagery over Chernobyl (20)
In his public lecture, Christian Timmerer provides insights into the fascinating history of video streaming, starting from its humble beginnings before YouTube to the groundbreaking technologies that now dominate platforms like Netflix and ORF ON. Timmerer also presents provocative contributions of his own that have significantly influenced the industry. He concludes by looking at future challenges and invites the audience to join in a discussion.
Programming Foundation Models with DSPy - Meetup SlidesZilliz
Prompting language models is hard, while programming language models is easy. In this talk, I will discuss the state-of-the-art framework DSPy for programming foundation models with its powerful optimizers and runtime constraint system.
For the full video of this presentation, please visit: https://www.edge-ai-vision.com/2024/06/building-and-scaling-ai-applications-with-the-nx-ai-manager-a-presentation-from-network-optix/
Robin van Emden, Senior Director of Data Science at Network Optix, presents the “Building and Scaling AI Applications with the Nx AI Manager,” tutorial at the May 2024 Embedded Vision Summit.
In this presentation, van Emden covers the basics of scaling edge AI solutions using the Nx tool kit. He emphasizes the process of developing AI models and deploying them globally. He also showcases the conversion of AI models and the creation of effective edge AI pipelines, with a focus on pre-processing, model conversion, selecting the appropriate inference engine for the target hardware and post-processing.
van Emden shows how Nx can simplify the developer’s life and facilitate a rapid transition from concept to production-ready applications.He provides valuable insights into developing scalable and efficient edge AI solutions, with a strong focus on practical implementation.
Driving Business Innovation: Latest Generative AI Advancements & Success StorySafe Software
Are you ready to revolutionize how you handle data? Join us for a webinar where we’ll bring you up to speed with the latest advancements in Generative AI technology and discover how leveraging FME with tools from giants like Google Gemini, Amazon, and Microsoft OpenAI can supercharge your workflow efficiency.
During the hour, we’ll take you through:
Guest Speaker Segment with Hannah Barrington: Dive into the world of dynamic real estate marketing with Hannah, the Marketing Manager at Workspace Group. Hear firsthand how their team generates engaging descriptions for thousands of office units by integrating diverse data sources—from PDF floorplans to web pages—using FME transformers, like OpenAIVisionConnector and AnthropicVisionConnector. This use case will show you how GenAI can streamline content creation for marketing across the board.
Ollama Use Case: Learn how Scenario Specialist Dmitri Bagh has utilized Ollama within FME to input data, create custom models, and enhance security protocols. This segment will include demos to illustrate the full capabilities of FME in AI-driven processes.
Custom AI Models: Discover how to leverage FME to build personalized AI models using your data. Whether it’s populating a model with local data for added security or integrating public AI tools, find out how FME facilitates a versatile and secure approach to AI.
We’ll wrap up with a live Q&A session where you can engage with our experts on your specific use cases, and learn more about optimizing your data workflows with AI.
This webinar is ideal for professionals seeking to harness the power of AI within their data management systems while ensuring high levels of customization and security. Whether you're a novice or an expert, gain actionable insights and strategies to elevate your data processes. Join us to see how FME and AI can revolutionize how you work with data!
Full-RAG: A modern architecture for hyper-personalizationZilliz
Mike Del Balso, CEO & Co-Founder at Tecton, presents "Full RAG," a novel approach to AI recommendation systems, aiming to push beyond the limitations of traditional models through a deep integration of contextual insights and real-time data, leveraging the Retrieval-Augmented Generation architecture. This talk will outline Full RAG's potential to significantly enhance personalization, address engineering challenges such as data management and model training, and introduce data enrichment with reranking as a key solution. Attendees will gain crucial insights into the importance of hyperpersonalization in AI, the capabilities of Full RAG for advanced personalization, and strategies for managing complex data integrations for deploying cutting-edge AI solutions.
HCL Notes and Domino License Cost Reduction in the World of DLAUpanagenda
Webinar Recording: https://www.panagenda.com/webinars/hcl-notes-and-domino-license-cost-reduction-in-the-world-of-dlau/
The introduction of DLAU and the CCB & CCX licensing model caused quite a stir in the HCL community. As a Notes and Domino customer, you may have faced challenges with unexpected user counts and license costs. You probably have questions on how this new licensing approach works and how to benefit from it. Most importantly, you likely have budget constraints and want to save money where possible. Don’t worry, we can help with all of this!
We’ll show you how to fix common misconfigurations that cause higher-than-expected user counts, and how to identify accounts which you can deactivate to save money. There are also frequent patterns that can cause unnecessary cost, like using a person document instead of a mail-in for shared mailboxes. We’ll provide examples and solutions for those as well. And naturally we’ll explain the new licensing model.
Join HCL Ambassador Marc Thomas in this webinar with a special guest appearance from Franz Walder. It will give you the tools and know-how to stay on top of what is going on with Domino licensing. You will be able lower your cost through an optimized configuration and keep it low going forward.
These topics will be covered
- Reducing license cost by finding and fixing misconfigurations and superfluous accounts
- How do CCB and CCX licenses really work?
- Understanding the DLAU tool and how to best utilize it
- Tips for common problem areas, like team mailboxes, functional/test users, etc
- Practical examples and best practices to implement right away
Building Production Ready Search Pipelines with Spark and MilvusZilliz
Spark is the widely used ETL tool for processing, indexing and ingesting data to serving stack for search. Milvus is the production-ready open-source vector database. In this talk we will show how to use Spark to process unstructured data to extract vector representations, and push the vectors to Milvus vector database for search serving.
Unlocking Productivity: Leveraging the Potential of Copilot in Microsoft 365, a presentation by Christoforos Vlachos, Senior Solutions Manager – Modern Workplace, Uni Systems
TrustArc Webinar - 2024 Global Privacy SurveyTrustArc
How does your privacy program stack up against your peers? What challenges are privacy teams tackling and prioritizing in 2024?
In the fifth annual Global Privacy Benchmarks Survey, we asked over 1,800 global privacy professionals and business executives to share their perspectives on the current state of privacy inside and outside of their organizations. This year’s report focused on emerging areas of importance for privacy and compliance professionals, including considerations and implications of Artificial Intelligence (AI) technologies, building brand trust, and different approaches for achieving higher privacy competence scores.
See how organizational priorities and strategic approaches to data security and privacy are evolving around the globe.
This webinar will review:
- The top 10 privacy insights from the fifth annual Global Privacy Benchmarks Survey
- The top challenges for privacy leaders, practitioners, and organizations in 2024
- Key themes to consider in developing and maintaining your privacy program
Best 20 SEO Techniques To Improve Website Visibility In SERPPixlogix Infotech
Boost your website's visibility with proven SEO techniques! Our latest blog dives into essential strategies to enhance your online presence, increase traffic, and rank higher on search engines. From keyword optimization to quality content creation, learn how to make your site stand out in the crowded digital landscape. Discover actionable tips and expert insights to elevate your SEO game.
Pushing the limits of ePRTC: 100ns holdover for 100 daysAdtran
At WSTS 2024, Alon Stern explored the topic of parametric holdover and explained how recent research findings can be implemented in real-world PNT networks to achieve 100 nanoseconds of accuracy for up to 100 days.
Let's Integrate MuleSoft RPA, COMPOSER, APM with AWS IDP along with Slackshyamraj55
Discover the seamless integration of RPA (Robotic Process Automation), COMPOSER, and APM with AWS IDP enhanced with Slack notifications. Explore how these technologies converge to streamline workflows, optimize performance, and ensure secure access, all while leveraging the power of AWS IDP and real-time communication via Slack notifications.
Sudheer Mechineni, Head of Application Frameworks, Standard Chartered Bank
Discover how Standard Chartered Bank harnessed the power of Neo4j to transform complex data access challenges into a dynamic, scalable graph database solution. This keynote will cover their journey from initial adoption to deploying a fully automated, enterprise-grade causal cluster, highlighting key strategies for modelling organisational changes and ensuring robust disaster recovery. Learn how these innovations have not only enhanced Standard Chartered Bank’s data infrastructure but also positioned them as pioneers in the banking sector’s adoption of graph technology.
Cosa hanno in comune un mattoncino Lego e la backdoor XZ?Speck&Tech
ABSTRACT: A prima vista, un mattoncino Lego e la backdoor XZ potrebbero avere in comune il fatto di essere entrambi blocchi di costruzione, o dipendenze di progetti creativi e software. La realtà è che un mattoncino Lego e il caso della backdoor XZ hanno molto di più di tutto ciò in comune.
Partecipate alla presentazione per immergervi in una storia di interoperabilità, standard e formati aperti, per poi discutere del ruolo importante che i contributori hanno in una comunità open source sostenibile.
BIO: Sostenitrice del software libero e dei formati standard e aperti. È stata un membro attivo dei progetti Fedora e openSUSE e ha co-fondato l'Associazione LibreItalia dove è stata coinvolta in diversi eventi, migrazioni e formazione relativi a LibreOffice. In precedenza ha lavorato a migrazioni e corsi di formazione su LibreOffice per diverse amministrazioni pubbliche e privati. Da gennaio 2020 lavora in SUSE come Software Release Engineer per Uyuni e SUSE Manager e quando non segue la sua passione per i computer e per Geeko coltiva la sua curiosità per l'astronomia (da cui deriva il suo nickname deneb_alpha).
GraphSummit Singapore | The Future of Agility: Supercharging Digital Transfor...Neo4j
Leonard Jayamohan, Partner & Generative AI Lead, Deloitte
This keynote will reveal how Deloitte leverages Neo4j’s graph power for groundbreaking digital twin solutions, achieving a staggering 100x performance boost. Discover the essential role knowledge graphs play in successful generative AI implementations. Plus, get an exclusive look at an innovative Neo4j + Generative AI solution Deloitte is developing in-house.
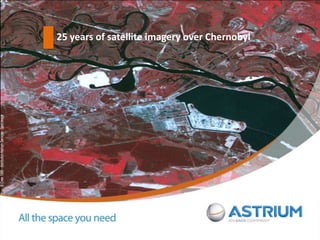
2. 25 years of satellite imagery over Chernobyl How Earth-imaging satellites tracked the changes over the last 25 years in the wake of the Chernobyl nuclear accident. On 26 April 1986, reactor n°4 at the Chernobyl nuclear power plant in Ukraine exploded. Ten days later, the SPOT 1 satellite ─ in only its 2nd month of operational service ─ acquired an image of a now hostile environment on the other side of the Iron Curtain. This image proved the value of Earth-imaging satellites in managing and mitigating natural and man-made disasters. 25 years on, the SPOT series of satellites has grown and new kinds of satellites have been launched. The Ukrainian power plant has become the poster child for the globalization of ecological issues. Work has continued in the radioactive area, spotlighted by increasingly precise and detailed satellite Earth imagery. 26 April 1986 - Nuclear disaster 6 May 1986 - SPOT 1 image 1986-1988- Nuclear plant decontamination 1986 - Farming activity stops 1988 - A new radioactive environment 1986-1988 - New roads 1996 - Containing the Pripet River 1996-2005 - Reforestation 1986-2005 - Radioactive waste disposal 2007 - New construction work on site SPOT 1 image acquired on 6 May 1986 at a resolution of 20 metres, 10 days after the Chernobyl nuclear power plant accident. This TerraSAR-X radar image of 3 April 2011 shows the Chernobyl power plant covered by snow. Acquired 25 years after the accident, the image symbolizes the increasingly diverse range and performance of satellite Earth-observation technologies and applications. Pripyat - A ghost town Page2 www.astrium-geo.com
6. SPOT 2 launched 22 January 1990, de-orbited July 2009 after 20 years in service, during which it acquired 6½ million images covering a total of 23.4 billion sq.km
7. SPOT 3 launched 26 September 1993, ceased operating November 1996Page4 www.astrium-geo.com
8. The Chernobyl nuclear power plant was designed to operate six RBMK-type reactors each capable of generating 1,000 megawatts of power. The first four reactors were aligned in pairs in a symmetrical arrangement. Reactor n°4 is the one furthest west. It entered service in 1984 and exploded on 26 April 1986. The explosion hurled debris as far as 400 metres from the reactor. Page5 www.astrium-geo.com
9.
10.
11. PASTEL: one of two optical terminals using laser technology making up the SILEX satellite-to-satellite communication systemPage6 www.astrium-geo.com
12. Forests have been felled and topsoil has been scoured away by bulldozers to a depth of 10 to 15 centimetres. The resulting bare soils are shown in white in the satellite image. Work has continued in the zone set aside for reactors n°5 and 6, notably cutting of water supply channels. During negotiations, the Russian authorities put the full weight of the region’s energy needs in the balance and did not halt construction of these new reactors immediately. Page7 www.astrium-geo.com
13.
14. 10 m in four-band multispectral mode (red, green, near-infrared and short-wave infrared)
15. HRS instrument: stereopair acquisition at 10-m resolution over an area of 120 km x 60 kmSPOT 5 was launched on 3 May 2002, carrying the VEGETATION-2 instrument. Page8 www.astrium-geo.com
16. The first signs of recovery were already apparent in the 1988 image. Renewed photosynthesis is clearly visible, notably in the forests shown in dark red. The exclusion zone around Chernobyl has been left to evolve alone, without human intervention. Today, it is the world’s first radioactive ecological reserve. Plants are growing and animals roaming freely. Bears and wolves have replaced humans as the top predators. Page9 www.astrium-geo.com
20. Global monitoring mode: 1 km Envisat was orbited on 1 March 2002 to ensure data continuity of the ERS missions and contribute to the study of Earth’s environment. Page10 www.astrium-geo.com
21. The road goes to the town of Slavutich, built after the disaster to house the population evacuated from the exclusion zone. Many people from the new town worked on the site of the former power plant, monitoring and maintaining it, and for scientific purposes. They travelled to work on the new road or by train. Page11 www.astrium-geo.com
22.
23. 8 metres in four-band multispectral mode (red, blue, green and near-infrared)
24. Ground footprint of 24 km x 24 km.FORMOSAT-2 was launched on 21 May 2004. Page12 www.astrium-geo.com
25. The Pripyat River runs for 710 km, flowing through the exclusion zone from north-west to south-east. It joins the Dnieper River just outside the town of Chernobyl, originally a small river port. The river floods profusely when snows melt in spring and it is constantly forming new meanders as its course changes. Page13 www.astrium-geo.com
26.
27. 4 m in four-band multispectral mode (red, blue, green and near-infrared)
28. Ground footprint of 15 km x 15 km.KOMPSAT-2 was launched on 28 July 2006. Page14 www.astrium-geo.com
29. The forest surface area could cover 65% to 70% of the region. Pasture land and swampland will decrease significantly. These changes are forming a stable layer of vegetation able to withstand fires. Page15 www.astrium-geo.com
32. ScanSAR mode: 18 m for a footprint of 100 km x 150 kmMission: TerraSAR-X was launched on 15 June 2007 and TanDEM-X on 21 June 2010. Page16 www.astrium-geo.com
33. Clean-up operations generated huge amounts of radioactive waste and contaminated equipment. Some of this waste is buried in trenches or in containers screened by clay or concrete to prevent leaching into the groundwater inside the 30-km exclusion zone. An examination of these structures concluded that for as long as the layer of clay remains intact, radioactive contamination of groundwater should be negligible. Page17 www.astrium-geo.com
34.
35. 2 m in four-band multispectral mode (red, green, blue and near-infrared)Mission: The two Pléiades satellites will launch between 2011 and 2012. Page18 www.astrium-geo.com