Download to read offline


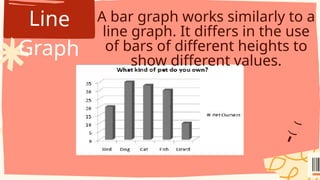
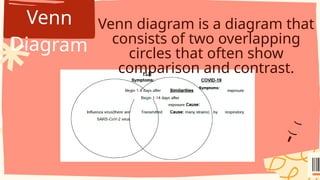
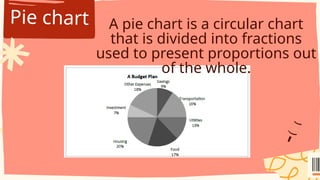

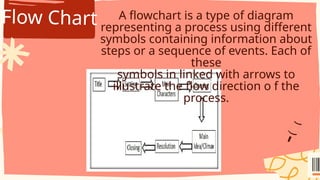


Dive into the dynamic world of non-linear texts, where visuals like charts, graphs, tables, and diagrams reshape how we read and understand information. This lesson explores the key differences between linear (straightforward, paragraph-based) and non-linear (visual, exploratory) texts, teaching learners not just how to decode them—but also how to transcode between them. Through interactive exercises, students will: Define and differentiate linear vs. non-linear texts—linear texts require sequential reading, like essays and letters, while non-linear texts allow visual navigation through elements like graphs, tables, flowcharts, and maps www.slideshare.net +1 . Identify common forms: line graphs, bar graphs, pie charts, Venn diagrams, concept maps, and more www.slideshare.net +1 . Transcode information: transform a linear paragraph into the most effective visual form, and vice versa www.slideshare.net +1 . Interpret non-linear visuals, extracting patterns, proportions, trends, and insights through guided questions www.slideshare.net +1 . Engage collaboratively: work in groups to transcode content—such as cultural comparisons or narratives—into visually compelling formats like Venn diagrams or flowcharts www.slideshare.net +1 . Why This Lesson Works Promotes critical thinking: Choosing the right format to visualize information encourages thoughtful analysis. Enhances comprehension: Visuals help learners quickly grasp complex ideas that might be hidden in dense text. Fosters versatility: Builds a transferable skill—fluidly moving between text and visuals is invaluable across subjects and real-world scenarios.


