Download as PDF, PPTX


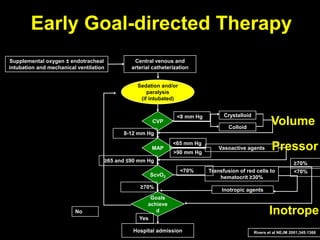
![Inverse Correlation between PWTT and SV
-8
-6
-4
-2
0
2
4
-100 -80 -60 -40 -20 0 20 40 60 80 100
ΔPWTT[ms]
ΔSV[cc]
y=-0.0511*x-0.876
r=-0.71(p<0.001)
n=560
Animal Experiment: Correlation between
the change of PWTT and SV since the
starting time (Sugo. et. al. IEEE, 1998)
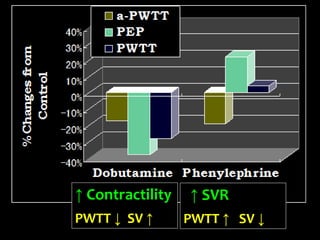
Positive inotropic:
Dobutamine
Negative inotropic:
Propranolol/pentobarbital
Vasoconstriction:
Phenylephrine
Vasodilation:
Nitroglycerin
Hypovolemia:
Removal/ transfusion of blood](https://image.slidesharecdn.com/non-invasiveguidedgdt-190122163310/85/Non-invasive-guided-gdt-17-320.jpg)


![●
●●
●
●
●
●
●
●
●
●
●
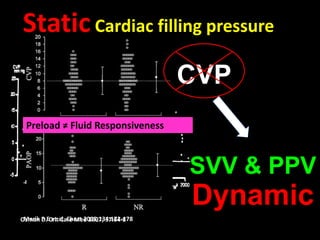
= [(38 - 17) x 80] / 1.2
= 1400 dyn.s/cm5
SVR = [(MAP-CVP) x 80] / CO](https://image.slidesharecdn.com/non-invasiveguidedgdt-190122163310/85/Non-invasive-guided-gdt-67-320.jpg)
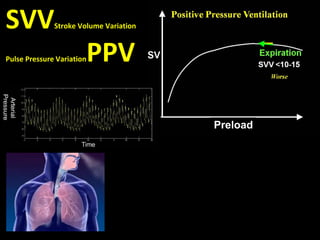
![= [(1.39 x Hb x SaO2)+(0.003 x PaO2)] x CI x 10
= [(1.39 x 6.2 x 0.97)+(0.003 x 100)] x 2.3 x 10
= 199.1 ml O2/min/m2
DO2I = CaO2 x CI x 10](https://image.slidesharecdn.com/non-invasiveguidedgdt-190122163310/85/Non-invasive-guided-gdt-72-320.jpg)


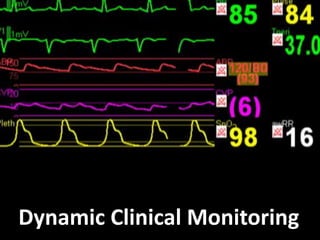
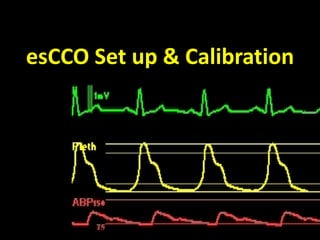
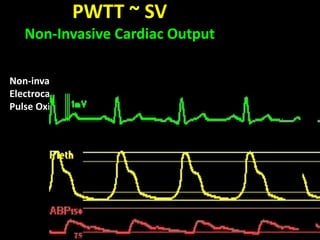
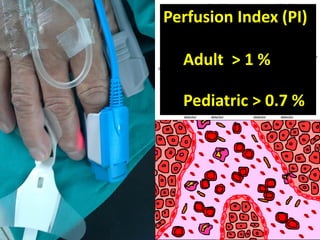
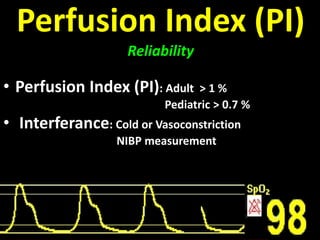
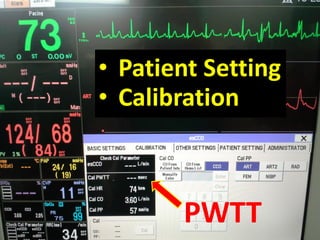
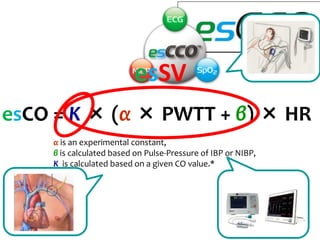
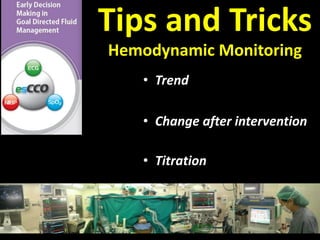
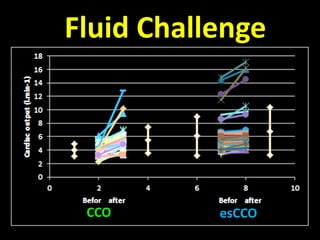
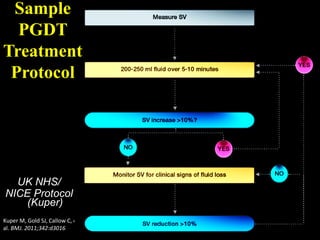
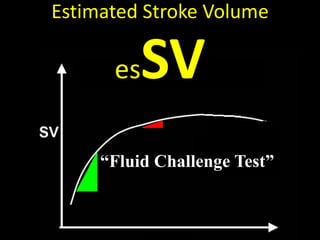
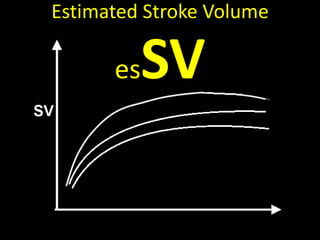
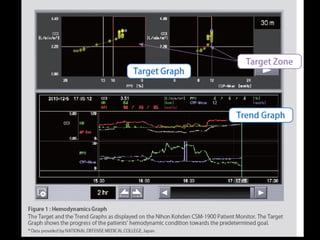
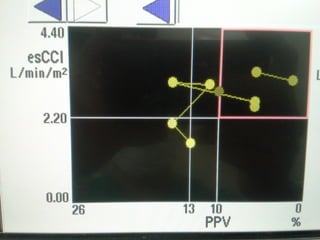
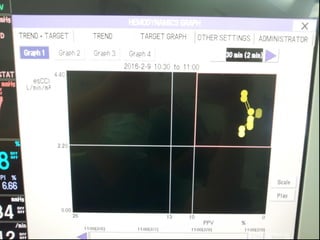
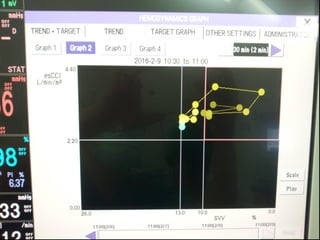
This document discusses non-invasive guided goal-directed therapy (GDT) for hemodynamic monitoring and optimization. It describes using a bedside monitor to continuously and non-invasively estimate cardiac output and stroke volume based on pulse wave transit time analysis of ECG and pulse oximetry signals. The method is calibrated using intermittent non-invasive blood pressure readings. Studies show this approach can guide fluid administration and help achieve hemodynamic goals like those used in invasive GDT protocols to improve outcomes. The document provides details on set up, use, and limitations of this non-invasive GDT method for perioperative hemodynamic optimization.


