Download to read offline
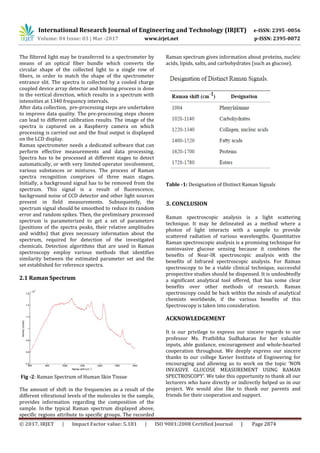
![International Research Journal of Engineering and Technology (IRJET) e-ISSN: 2395 -0056
Volume: 04 Issue: 03 | Mar -2017 www.irjet.net p-ISSN: 2395-0072
© 2017, IRJET | Impact Factor value: 5.181 | ISO 9001:2008 Certified Journal | Page 2875
REFERENCES
[1] The Diabetes Control and Complications Trial
Research Group, ‘‘The effect of intensive
treatment of diabetes on the development and
progression of long-term complications in insulin-
dependent diabetes mellitus,’’ N. Engl. J. Med. 329,
977–986 ~1993
[2] O. S. Khalil, ‘‘Spectroscopic and clinical aspects of
noninvasive glucose measurements,’’ Clin. Chem.
45, 165–177 ~1999
[3] M. R. Robinson, R. P. Eaton, D. M. Haaland, G. W.
Koepp, E. V. Thomas, B. R. Stallard, and P. L.
Robinson, ‘‘Noninvasive glucose monitoring in
diabetic patients: a preliminary evaluation,’’ Clin.
Chem. 38, 1618–1622 ~1992
[4] U. A. Muller, B. Mertes, C. Fischbacher, K. U.
Jageman, and K. Danzer, ‘‘Non-invasive blood
glucose monitoring by means of near infrared
spectroscopy: methods for improving the
reliability of calibration models,’’ Int. J. Artif.
Organs 20, 285–290 ~1997
[5] M. Gniadecka, O. Faurskov Nielsen, D. H.
Christensen, and H. C. Wulf, ‘‘Structure of water,
proteins, and lipids in intact human skin, hair, and
nail,’’ J. Invest. Dermatol. 110, 393–398 ~1998
[6] M. Gniadecka, H. C. Wulf, O. F. Nielsen, D. H.
Christensen, and J. Hercogova, ‘‘Distinctive
molecular abnormalities in benign and malignant
skin lesions: Studies by Raman spectroscopy,’’
Photochem. Photobiol. 66, 418–423 ~1997
[7] Lambert, J. L.; Morookian, J. M.; Sirk, S. J.; Borchert,
M. S. Journal of Raman Spectroscopy 2002, 33,
524-529](https://image.slidesharecdn.com/irjet-v4i3722-171215090500/85/Non-Invasive-Glucose-Measurement-using-Raman-Spectroscopy-4-320.jpg)

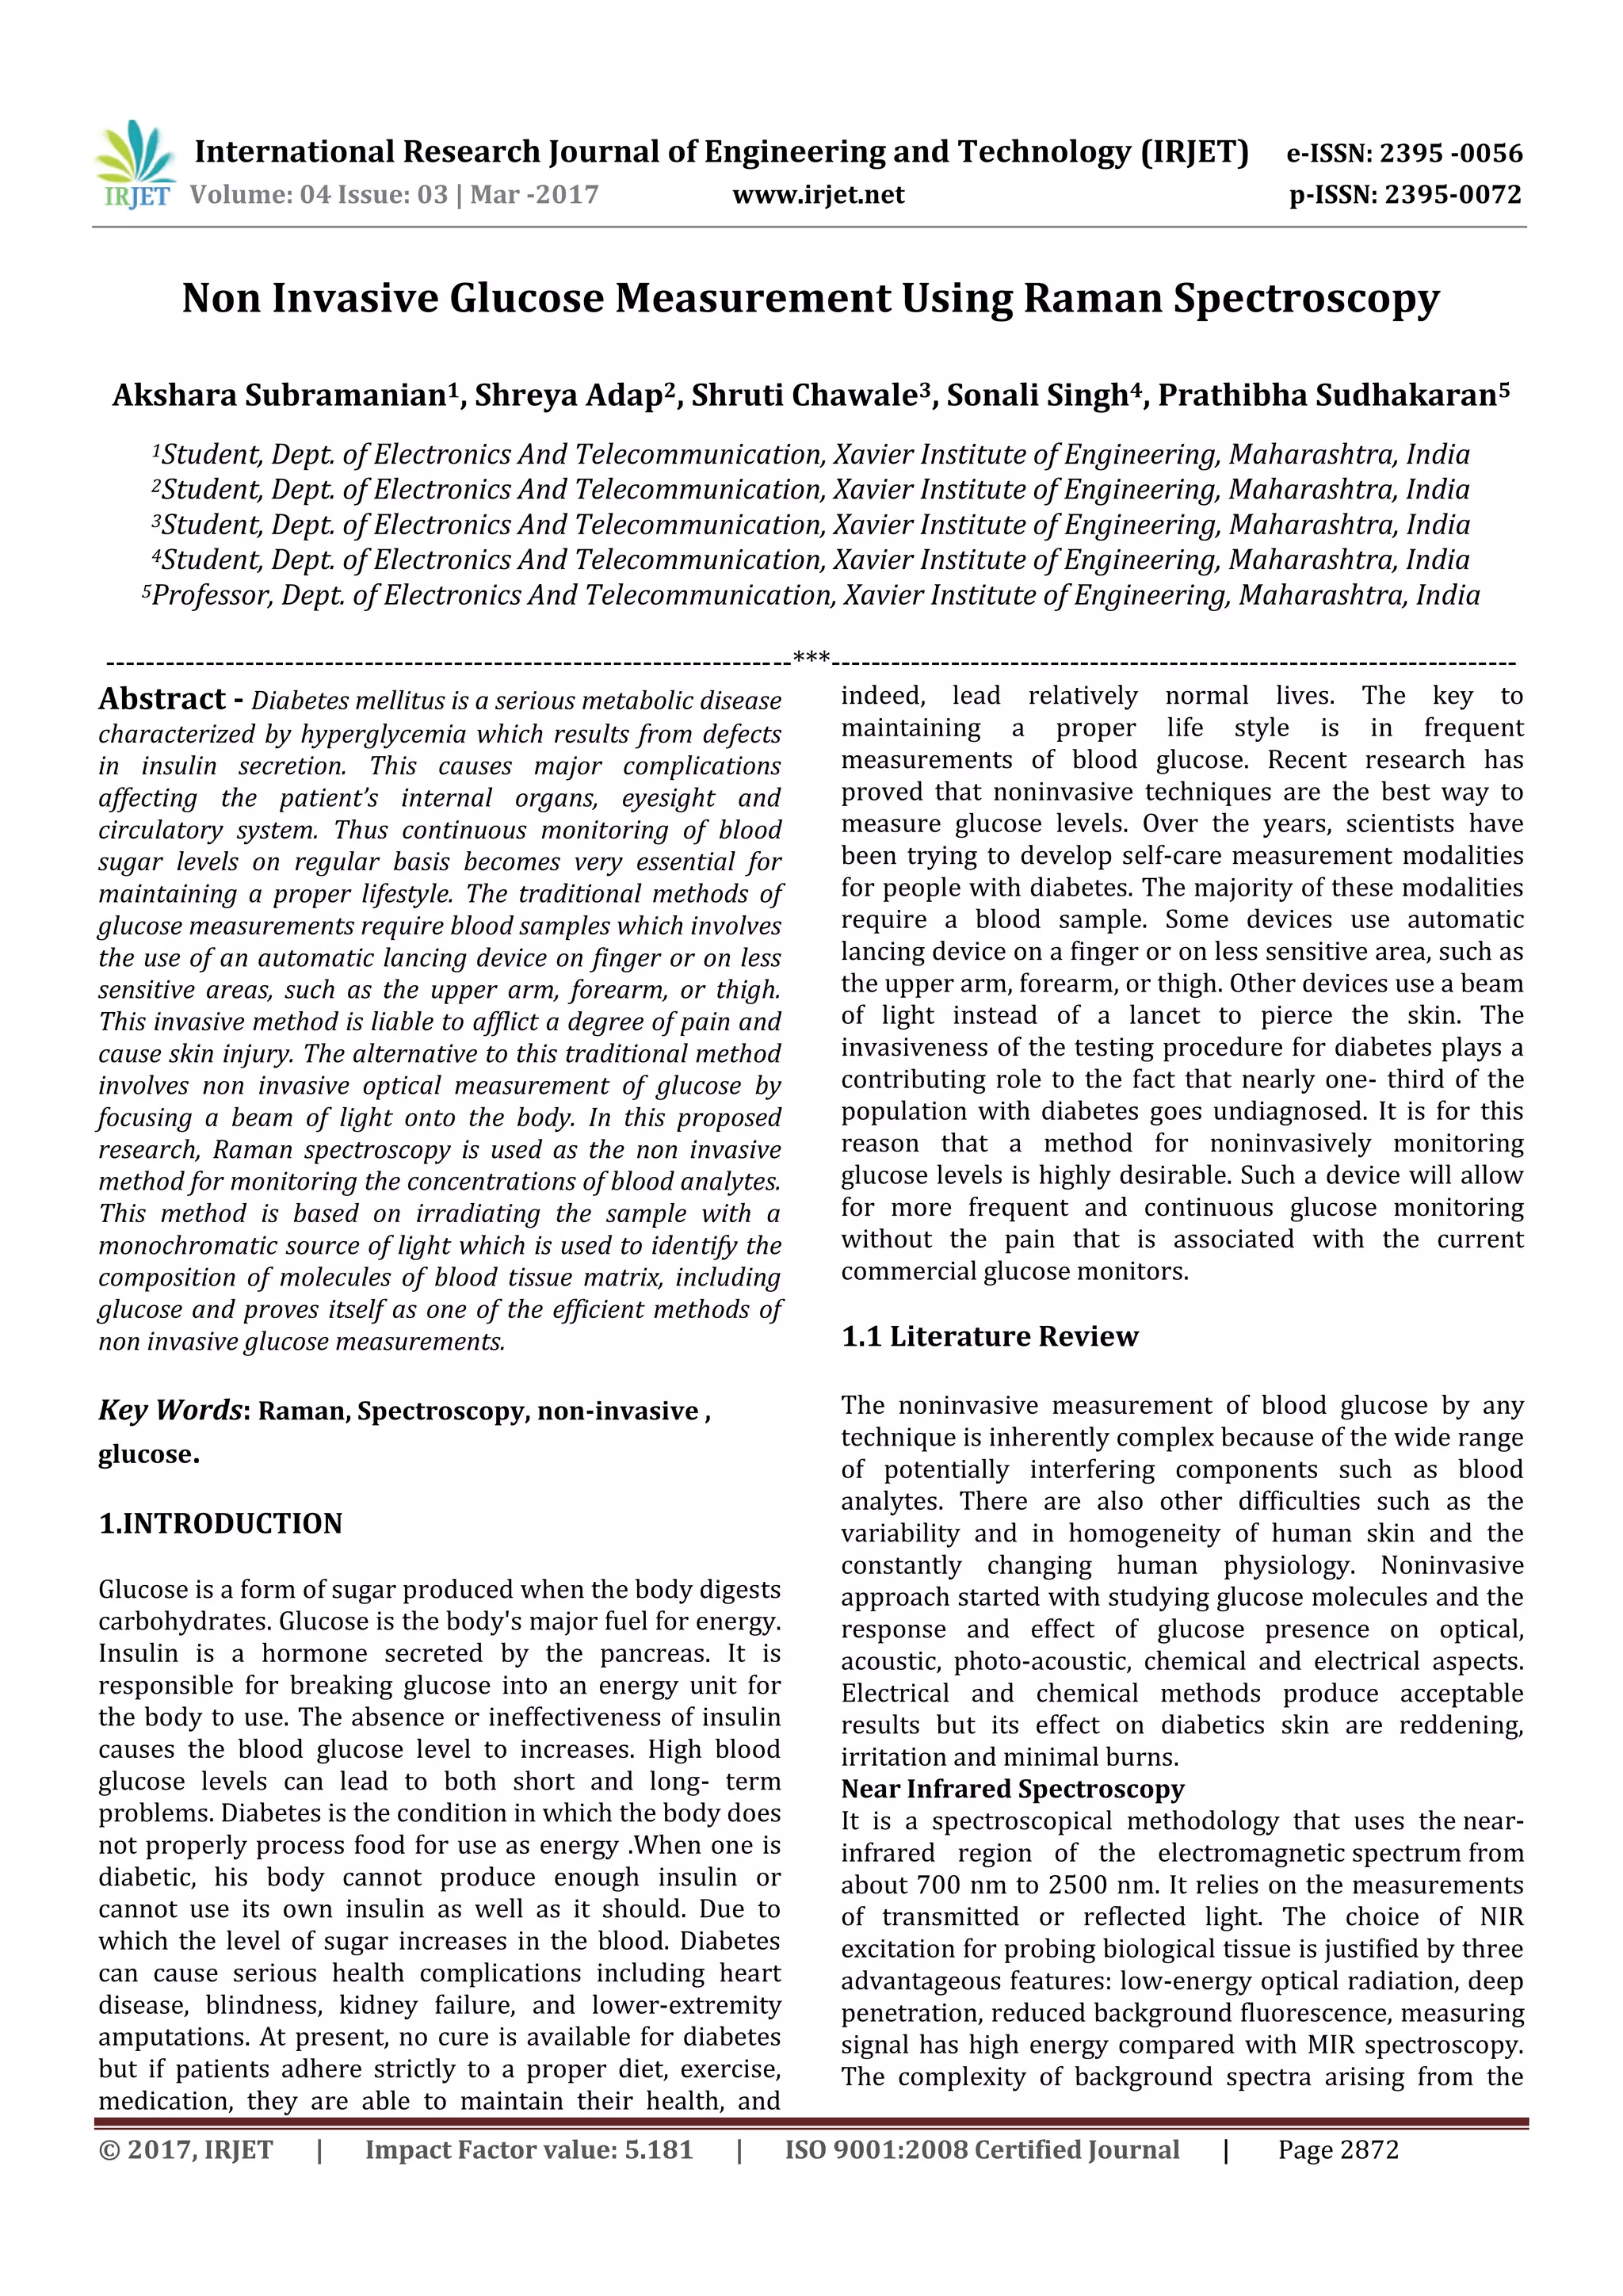
This document discusses non-invasive glucose measurement using Raman spectroscopy. It begins with an introduction to diabetes and the need for frequent blood glucose monitoring. Current methods are invasive and painful. The document then reviews various non-invasive optical methods studied previously, including near-infrared spectroscopy, photo-acoustic spectroscopy, and optical coherence tomography, which all have limitations. It focuses on Raman spectroscopy, which resolves limitations of other techniques by using inelastic light scattering to obtain a molecular fingerprint spectrum. The methodology section describes the setup, which uses an 830nm laser as the excitation source and collects inelastically scattered light to identify glucose and other molecules for non-invasive concentration measurements.