Download to read offline
![International INTERNATIONAL Journal of Electronics and JOURNAL Communication Engineering OF ELECTRONICS & Technology (IJECET), AND
ISSN 0976 –
6464(Print), ISSN 0976 – 6472(Online), Volume 5, Issue 7, July (2014), pp. 32-38 © IAEME
COMMUNICATION ENGINEERING TECHNOLOGY (IJECET)
ISSN 0976 – 6464(Print)
ISSN 0976 – 6472(Online)
Volume 5, Issue 7, July (2014), pp. 32-38
© IAEME: http://www.iaeme.com/IJECET.asp
Journal Impact Factor (2014): 7.2836 (Calculated by GISI)
www.jifactor.com
IJECET
© I A E M E
APPLICATION OF RF SPECTROSCOPY FOR BLOOD GLUCOSE
MEASUREMENT
Ingrid Anne P. Nazareth1, Sulaxana R. Vernekar2, Rajendra S. Gad3, Gourish M. Naik4
1, 2Research Scholar, Dept. of Electronics, Taleigao Plateau, Goa University, Goa, India,
3Associate Professor, Dept. of Electronics, Taleigao Plateau, Goa University, Goa, India,
4Professor Head, Dept. of Electronics, Taleigao Plateau, Goa University, Goa, India,
32
ABSTRACT
The design and the fabrication of RF characteristics measurement cell to estimate the
constituents of human blood is described in this manuscript. The human blood has over 100
constituents of which glucose and cholesterol are important parameters which needs to be quantified
for monitoring health parameters. It is necessary to find out the level of glucose in blood separately
in order to determine the level of Cholesterol more accurately. Hence the authors propose a quick,
portable and low-cost device which could be used to monitor the level of glucose and other important
parameters. This manuscript includes the data obtained for Glucose dissolved in water as per
percentage found in the human blood. The data will be fed to a multivariate system programmed in a
FPGA device to estimate the glucose concentration. The results shown here are in the RF range of
10MHz-4GHz.
Keywords: Glucose, PLS, RF Spectroscopy.
1. INTRODUCTION
Glucose is by far the most common carbohydrate and classified as a monosaccharide, an
aldose, a hexose, and is a reducing sugar. It is also known as dextrose, because it is dextrorotatory.
Glucose is also called blood sugar as it circulates in the blood at a concentration of 70-110 mg/dL (or
70-110 mg/100 ml) of blood. Glucose is initially synthesized by chlorophyll in plants using carbon
dioxide from the air and sunlight as an energy source. Glucose is further converted to starch for
storage. It is the main source of energy used by the body.[1]
Normally, blood glucose levels increase slightly after eating. This increase causes the
pancreas to release insulin so that the blood glucose levels do not get too high. Blood glucose levels
that remain high over time can damage the eyes, kidneys, nerves, and blood vessels. Diabetes](https://image.slidesharecdn.com/40120140507005-140924050301-phpapp02/85/40120140507005-1-320.jpg)
![International INTERNATIONAL Journal of Electronics and JOURNAL Communication Engineering OF ELECTRONICS & Technology (IJECET), AND
ISSN 0976 –
6464(Print), ISSN 0976 – 6472(Online), Volume 5, Issue 7, July (2014), pp. 32-38 © IAEME
COMMUNICATION ENGINEERING TECHNOLOGY (IJECET)
ISSN 0976 – 6464(Print)
ISSN 0976 – 6472(Online)
Volume 5, Issue 7, July (2014), pp. 32-38
© IAEME: http://www.iaeme.com/IJECET.asp
Journal Impact Factor (2014): 7.2836 (Calculated by GISI)
www.jifactor.com
IJECET
© I A E M E
APPLICATION OF RF SPECTROSCOPY FOR BLOOD GLUCOSE
MEASUREMENT
Ingrid Anne P. Nazareth1, Sulaxana R. Vernekar2, Rajendra S. Gad3, Gourish M. Naik4
1, 2Research Scholar, Dept. of Electronics, Taleigao Plateau, Goa University, Goa, India,
3Associate Professor, Dept. of Electronics, Taleigao Plateau, Goa University, Goa, India,
4Professor Head, Dept. of Electronics, Taleigao Plateau, Goa University, Goa, India,
32
ABSTRACT
The design and the fabrication of RF characteristics measurement cell to estimate the
constituents of human blood is described in this manuscript. The human blood has over 100
constituents of which glucose and cholesterol are important parameters which needs to be quantified
for monitoring health parameters. It is necessary to find out the level of glucose in blood separately
in order to determine the level of Cholesterol more accurately. Hence the authors propose a quick,
portable and low-cost device which could be used to monitor the level of glucose and other important
parameters. This manuscript includes the data obtained for Glucose dissolved in water as per
percentage found in the human blood. The data will be fed to a multivariate system programmed in a
FPGA device to estimate the glucose concentration. The results shown here are in the RF range of
10MHz-4GHz.
Keywords: Glucose, PLS, RF Spectroscopy.
1. INTRODUCTION
Glucose is by far the most common carbohydrate and classified as a monosaccharide, an
aldose, a hexose, and is a reducing sugar. It is also known as dextrose, because it is dextrorotatory.
Glucose is also called blood sugar as it circulates in the blood at a concentration of 70-110 mg/dL (or
70-110 mg/100 ml) of blood. Glucose is initially synthesized by chlorophyll in plants using carbon
dioxide from the air and sunlight as an energy source. Glucose is further converted to starch for
storage. It is the main source of energy used by the body.[1]
Normally, blood glucose levels increase slightly after eating. This increase causes the
pancreas to release insulin so that the blood glucose levels do not get too high. Blood glucose levels
that remain high over time can damage the eyes, kidneys, nerves, and blood vessels. Diabetes](https://image.slidesharecdn.com/40120140507005-140924050301-phpapp02/75/40120140507005-1-2048.jpg)
![International Journal of Electronics and Communication Engineering Technology (IJECET), ISSN 0976 –
6464(Print), ISSN 0976 – 6472(Online), Volume 5, Issue 7, July (2014), pp. 32-38 © IAEME
mellitus (DM) also known simply as diabetes, is a group of metabolic diseases in which there are
high blood sugar levels over a prolonged period.[2] Other conditions that can cause high blood
glucose levels include: Severe stress, Heart attack, Stroke, Cushing's syndrome, Low values
symptoms of hypoglycemia and insulinoma. Low glucose levels are caused by: Addison's disease,
hypothyroidism, cirrhosis, Kidney failure, Malnutrition or an eating disorder, such as anorexia.
In India, a recent study showed that total annual expenditure by patients on diabetes care was,
on average, INR (Indian Rupee value) 10,000 (US $227) in urban areas and INR 6,260 (US $142) in
rural areas. An increase of 113% was observed in the total expenditure between 1998 and 2005 in the
urban population. Low-income groups spent a higher proportion of their income on diabetes care
(34% and 27% for urban poor versus rural poor respectively) without subsidies. The medical costs
incurred by a person with diabetes are two to fivefold higher than those incurred by people without
diabetes. The average expenditure per patient per year would be a minimum of INR 4,500
(approximately US $120). Therefore, the estimated annual cost of diabetes care would be
approximately 180,000 million rupees.[3]
Venipuncture is the collection of blood from a vein, usually for laboratory testing. The site
from where blood is drawn from a vein located the inside of the elbow or the back of the hand is
cleaned with germ-killing medicine (antiseptic). An elastic band is put around the upper arm to apply
pressure to the area. This makes the vein swell with blood. A needle is inserted into the vein wherein
a slight pain or a sting or a throbbing at the site after the blood is drawn is often felt. The blood
collects into an airtight vial or tube attached to the needle. The elastic band is removed from the arm.
The needle is taken out and the spot is covered with a bandage to stop bleeding. The tubes containing
blood/serum contain a variety of additives when transported back to the laboratory. Reagents vary
between laboratories and therefore it is important to know which tube the individual laboratory
requires for which test. Whole blood needs to be mixed with Ethylene diaminete traacetic acid to
prevent it clotting.
33
2. PREPARATION OF SAMPLES
The Glucose in the normal human blood ranges from 70-110mg/dL. Here the experiment is
conducted with average concentration of glucose i.e. 90mg/dL. Double distilled water is used to
prepare solution samples with concentrations spanning from half to normal concentration and also
double and triple concentration. Each sample consists of 14 mL of water and 1mL of Alcohol is
added to water in order to dissolve the above said constituent. Experiments were performed in 2
modes at a particular time (fast sweep and slow sweep). The experiment was repeated after 1 hour
and 2 hours in order to nullify the environmental effect. The differences were compared to the first
measure and were found to be accurate.
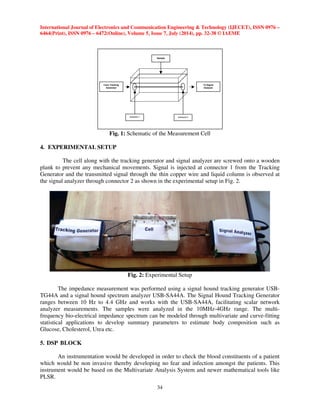
3. CELL DESIGN
A rectangular shaped cell was designed to measure the RF responses of various blood
constituents as shown in Fig. 1. It is made up of plastic sheets having length 12.5cms, breadth 1cm
and height 2cms. It was covered with a thin copper foil inside and outside the cell. This cell was
further placed in an iron container to prevent external radiation. The cell and the iron container were
individually grounded. There are 2 connectors placed on either side of the cell. There is a thin Copper
wire running through the center of the cell from Connector 1 to Connector 2.](https://image.slidesharecdn.com/40120140507005-140924050301-phpapp02/85/40120140507005-2-320.jpg)
![International Journal of Electronics and Communication Engineering Technology (IJECET), ISSN 0976 –
6464(Print), ISSN 0976 – 6472(Online), Volume 5, Issue 7, July (2014), pp. 32-38 © IAEME
Multivariate analysis (MVA) is based on the statistical principle of multivariate statistics,
which involves observation and analysis of more than one statistical outcome variable at a time.
Recent advances in computer technology and instrumentation techniques have enabled us to collect
precise and varieties of data from chemical and biological processes. With the increased data
dimensionality, Multivariate Statistical Process Control (MVSPC) has become very important and
essential tool to extract the useful information from the measured data for improving process
performance and product quality. During the last decade, this has been successfully applied for
monitoring and modelling chemical / biological processes. [4][5][6][7][8] One of the most popular
MVSPC techniques is Partial Least Squares (PLS). PLS is a multivariate process identification
method that projects the input-output data down into a latent space, extracting a number of principal
factors with an orthogonal structure, while capturing most of the variance in the original data. [9][10]
35
6. FIGURES AND TABLE
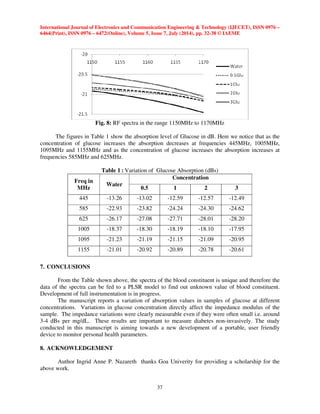
By using the above setup, the graphs are recorded as shown in Fig. 3 to Fig. 8. It may be
noted here that even though the experiment was conducted from 10MHz to 4GHz continuously, the
responses were found only in certain regions and some of them are shown in Fig. 3 to Fig. 8.
It can be observed from the graph shown in Fig. 3 that as the concentration of Glucose
increases, the absorption decreases. A peak of Glucose is observed at 445MHz. Further in Fig. 4, the
absorption increases as the concentration of Glucose increases. There is a peak at 585MHz. Fig. 5
shows a trough at 625 MHz and as the concentration of glucose increases the absorption increases.
Fig. 3: RF spectra in the range 430MHz to 450MHz
Fig. 4: RF spectra in the range 580MHz to 600MHz](https://image.slidesharecdn.com/40120140507005-140924050301-phpapp02/85/40120140507005-4-320.jpg)
![International Journal of Electronics and Communication Engineering Technology (IJECET), ISSN 0976 –
6464(Print), ISSN 0976 – 6472(Online), Volume 5, Issue 7, July (2014), pp. 32-38 © IAEME
38
REFERENCES
[1] About diabetes. World Health Organization. Retrieved 4 April 2014.
[2] American Diabetes Association (2013). Standards of medical care in diabetes—2013.
Diabetes Care, 36(Suppl 1): S11–S66.
[3] Ramachandran A. Current scenario of diabetes in India. J Diabetes. 2009; 1:18-28.
[4] Lee DS, Jeon CO, Park JM, Chang KS. Hybrid neural network modelling of a full-scale
industrial wastewater treatment process. Biotechnol Bioeng 2002; 78:670–82.
[5] Lee DS, Park JM, Vanrolleghem PA. Adaptive multiscale principal component analysis for
on-line monitoring of a sequencing batch reactor. J Biotechnol 2005; 116:195–210.
[6] Lee DS, Vanrolleghem PA. Monitoring of a sequencing batch reactor using adaptive
multiblock principal component analysis. Biotechnol Bioeng 2003; 82(4):489–97.
[7] MacGregor JF, Kourti T. Statistical process control of multivariate processes. Control Eng
Pract 1995; 3:403–14.
[8] Wise BM, Gallagher NB. The process chemometrics approach to process monitoring and
fault detection. J Proc Control 1996; 6:329–48.
[9] Geladi P, Kowalski BR. Partial least-squares regression: a tutorial. Anal Chim Acta 1986;
185:1–17.
[10] Wold S, Ruhe A, Wold H, Dunn WJ. The Collinearity problem in linear regression. The
partial least squares approach to generalized inverse. SIAM J Sci Stat Comput 1984;
3:735–43.
[11] H. Ajith Hebbar and K.S.Jayantha, “Separation of Organic Based Oil and Grease from
Restaurant Wastewater using a Horizontal Flow Batch Reactor Containing Laterite Medium”,
International Journal of Advanced Research in Engineering Technology (IJARET),
Volume 5, Issue 2, 2014, pp. 152 - 155, ISSN Print: 0976-6480, ISSN Online: 0976-6499.](https://image.slidesharecdn.com/40120140507005-140924050301-phpapp02/85/40120140507005-7-320.jpg)

This document describes a study on using RF spectroscopy to measure blood glucose levels. Researchers designed a rectangular measurement cell and used a tracking generator and signal analyzer to collect RF response data from glucose solutions of varying concentrations between 10MHz-4GHz. The results showed variations in absorption levels that correlated with glucose concentration at certain frequencies. The goal is to develop a non-invasive, portable device for glucose monitoring by feeding the RF spectral data into a multivariate analysis model programmed on an FPGA.


![Getting Started with Apache Spark: Big Data Made Simple [Free Meetup]](https://cdn.slidesharecdn.com/ss_thumbnails/apachesparkgettingstarted-260203175547-8361bcc3-thumbnail.jpg?width=640&height=640&fit=bounds)