Download to read offline


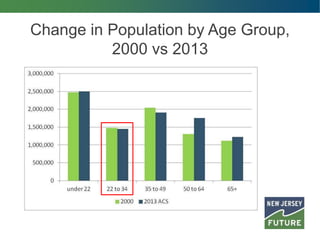
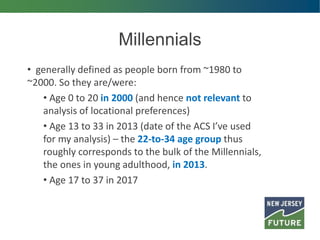
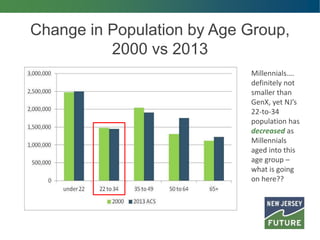
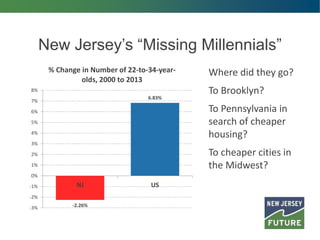

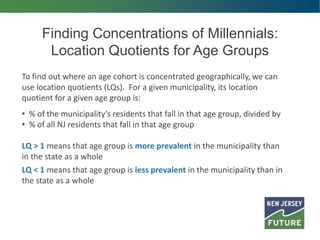
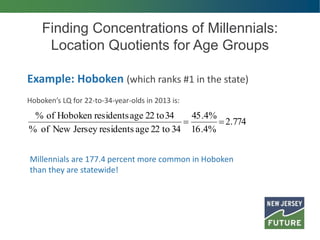
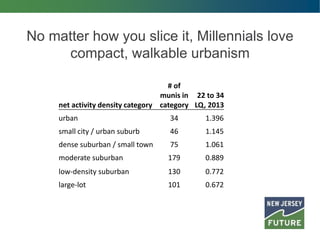
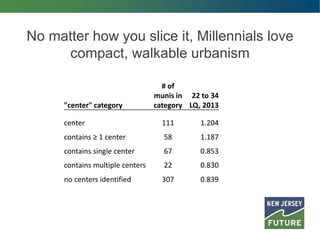

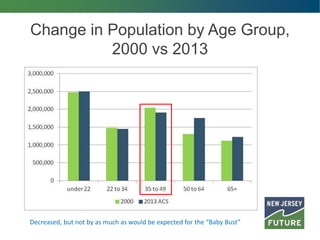
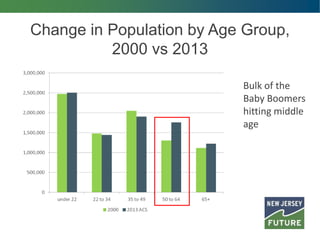
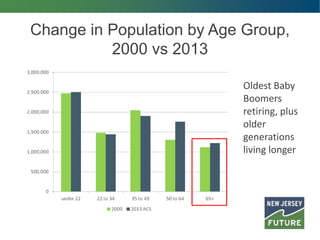


This document summarizes trends in New Jersey's population by age group between 2000 and 2013. It finds that while Millennials make up a large generation, NJ's 22-34 population has declined as Millennials have aged. Many likely moved to cheaper housing elsewhere. However, Millennials who have stayed in NJ prefer compact, walkable places with a high density of destinations. Generation X showed a similar preference when they were young adults. While older generations like Baby Boomers moved to suburbs as they aged, Generation X has retained some preference for walkable urbanism in early middle age. The trends suggest NJ will need to build more housing and retrofit areas to attract and accommodate younger residents in the future.


