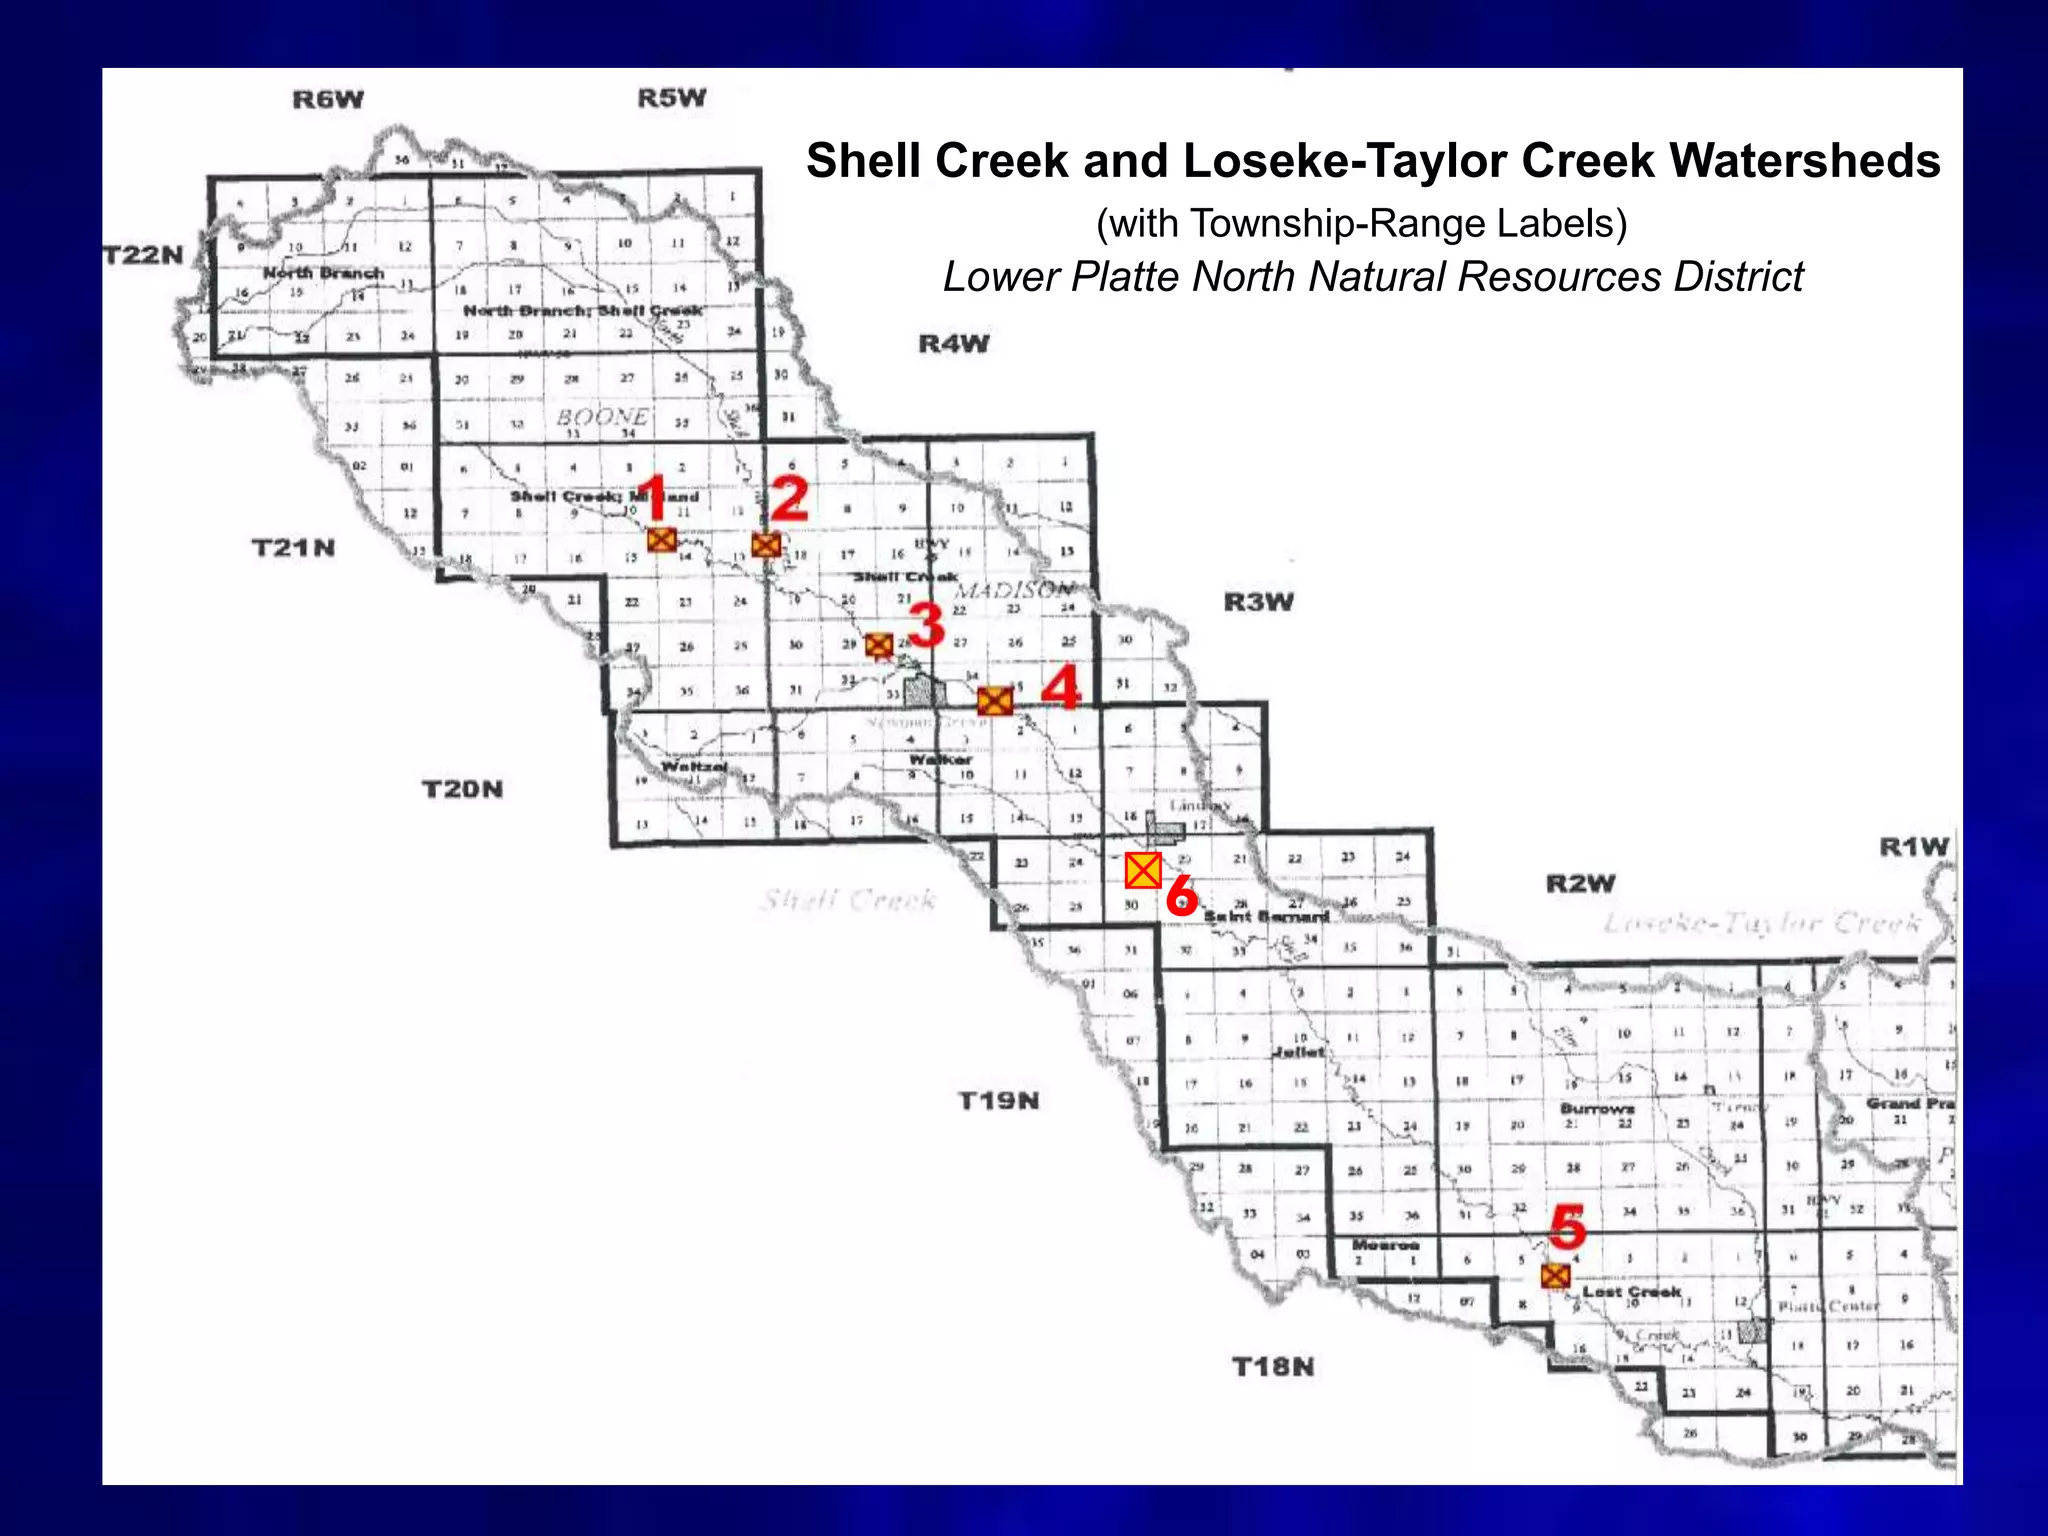
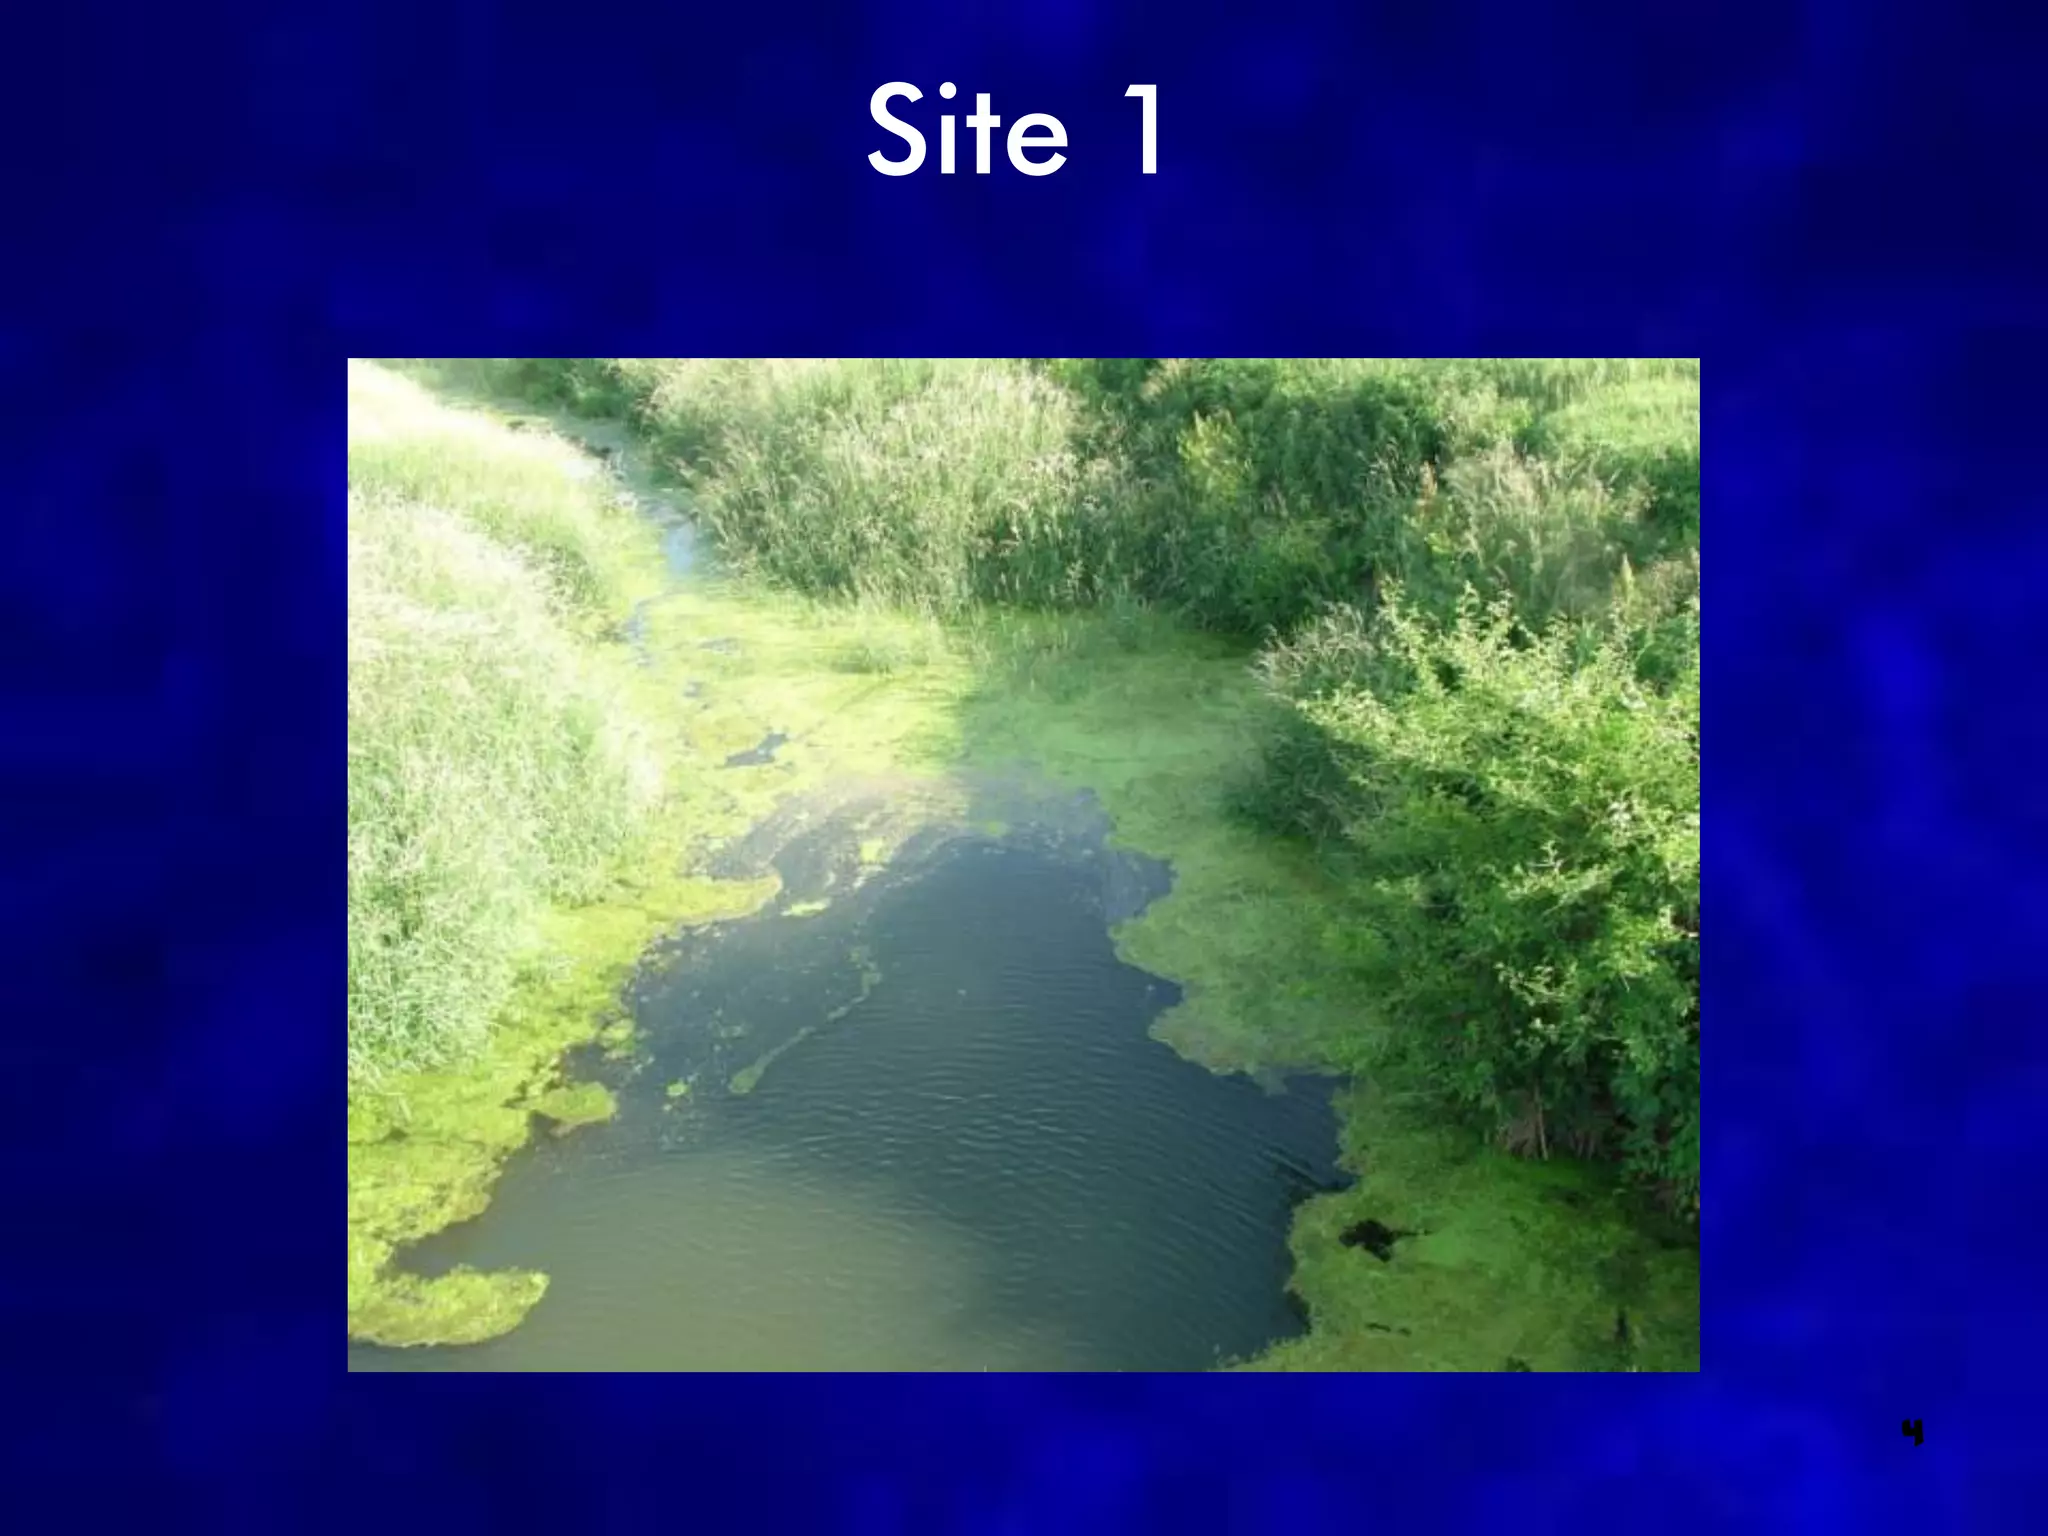
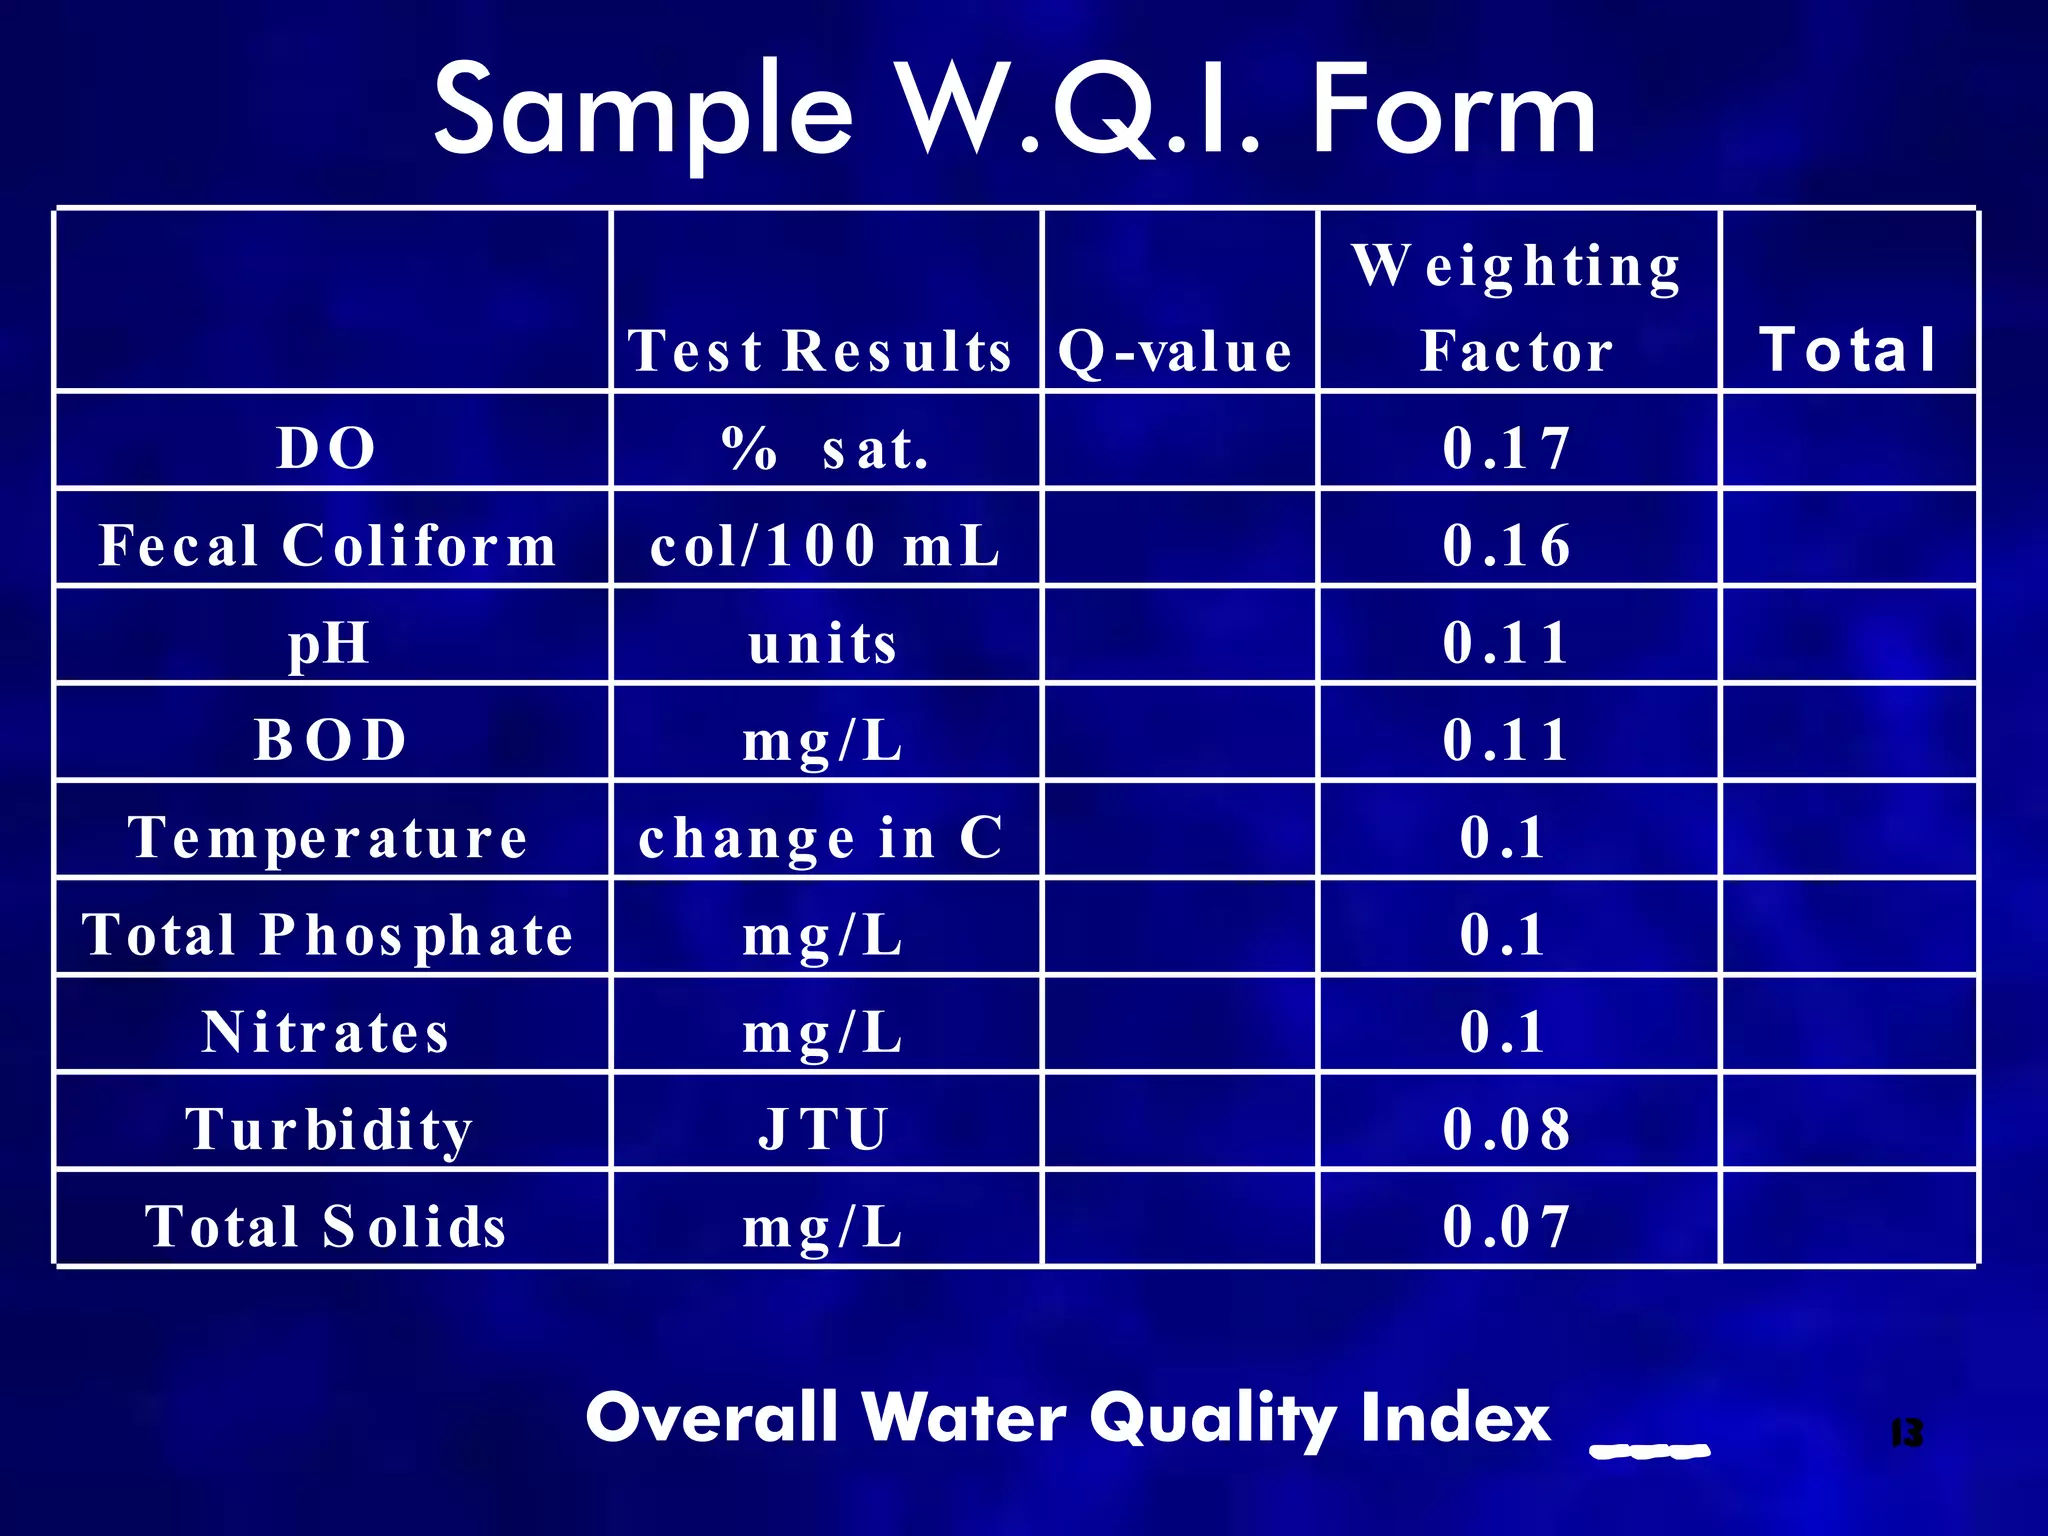
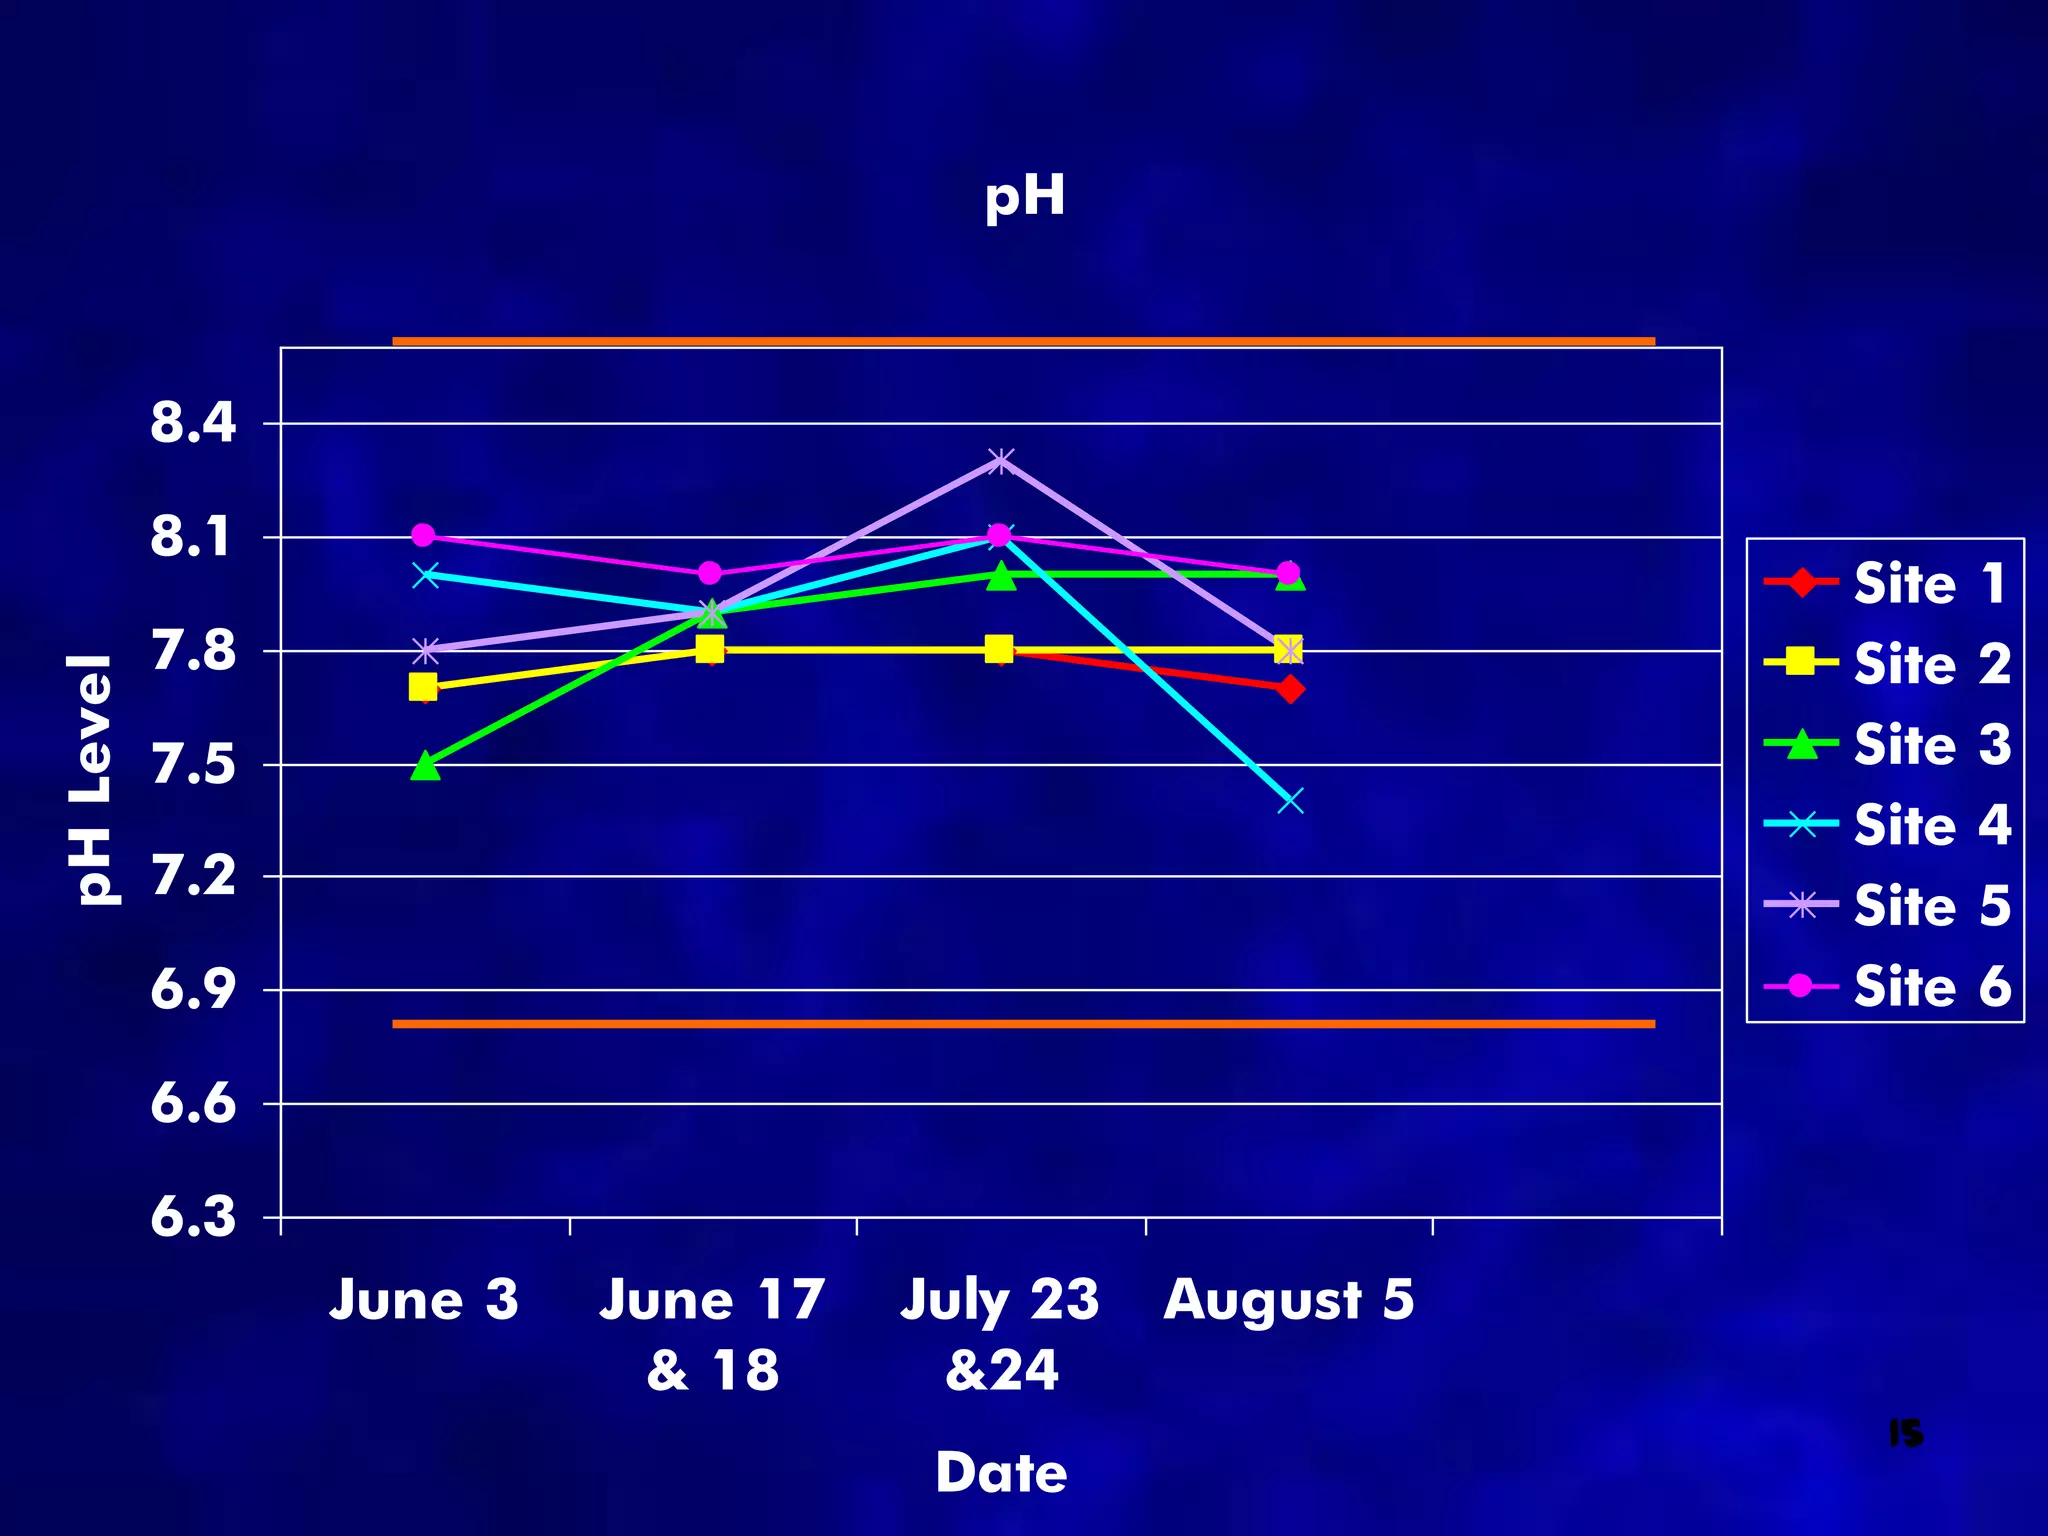
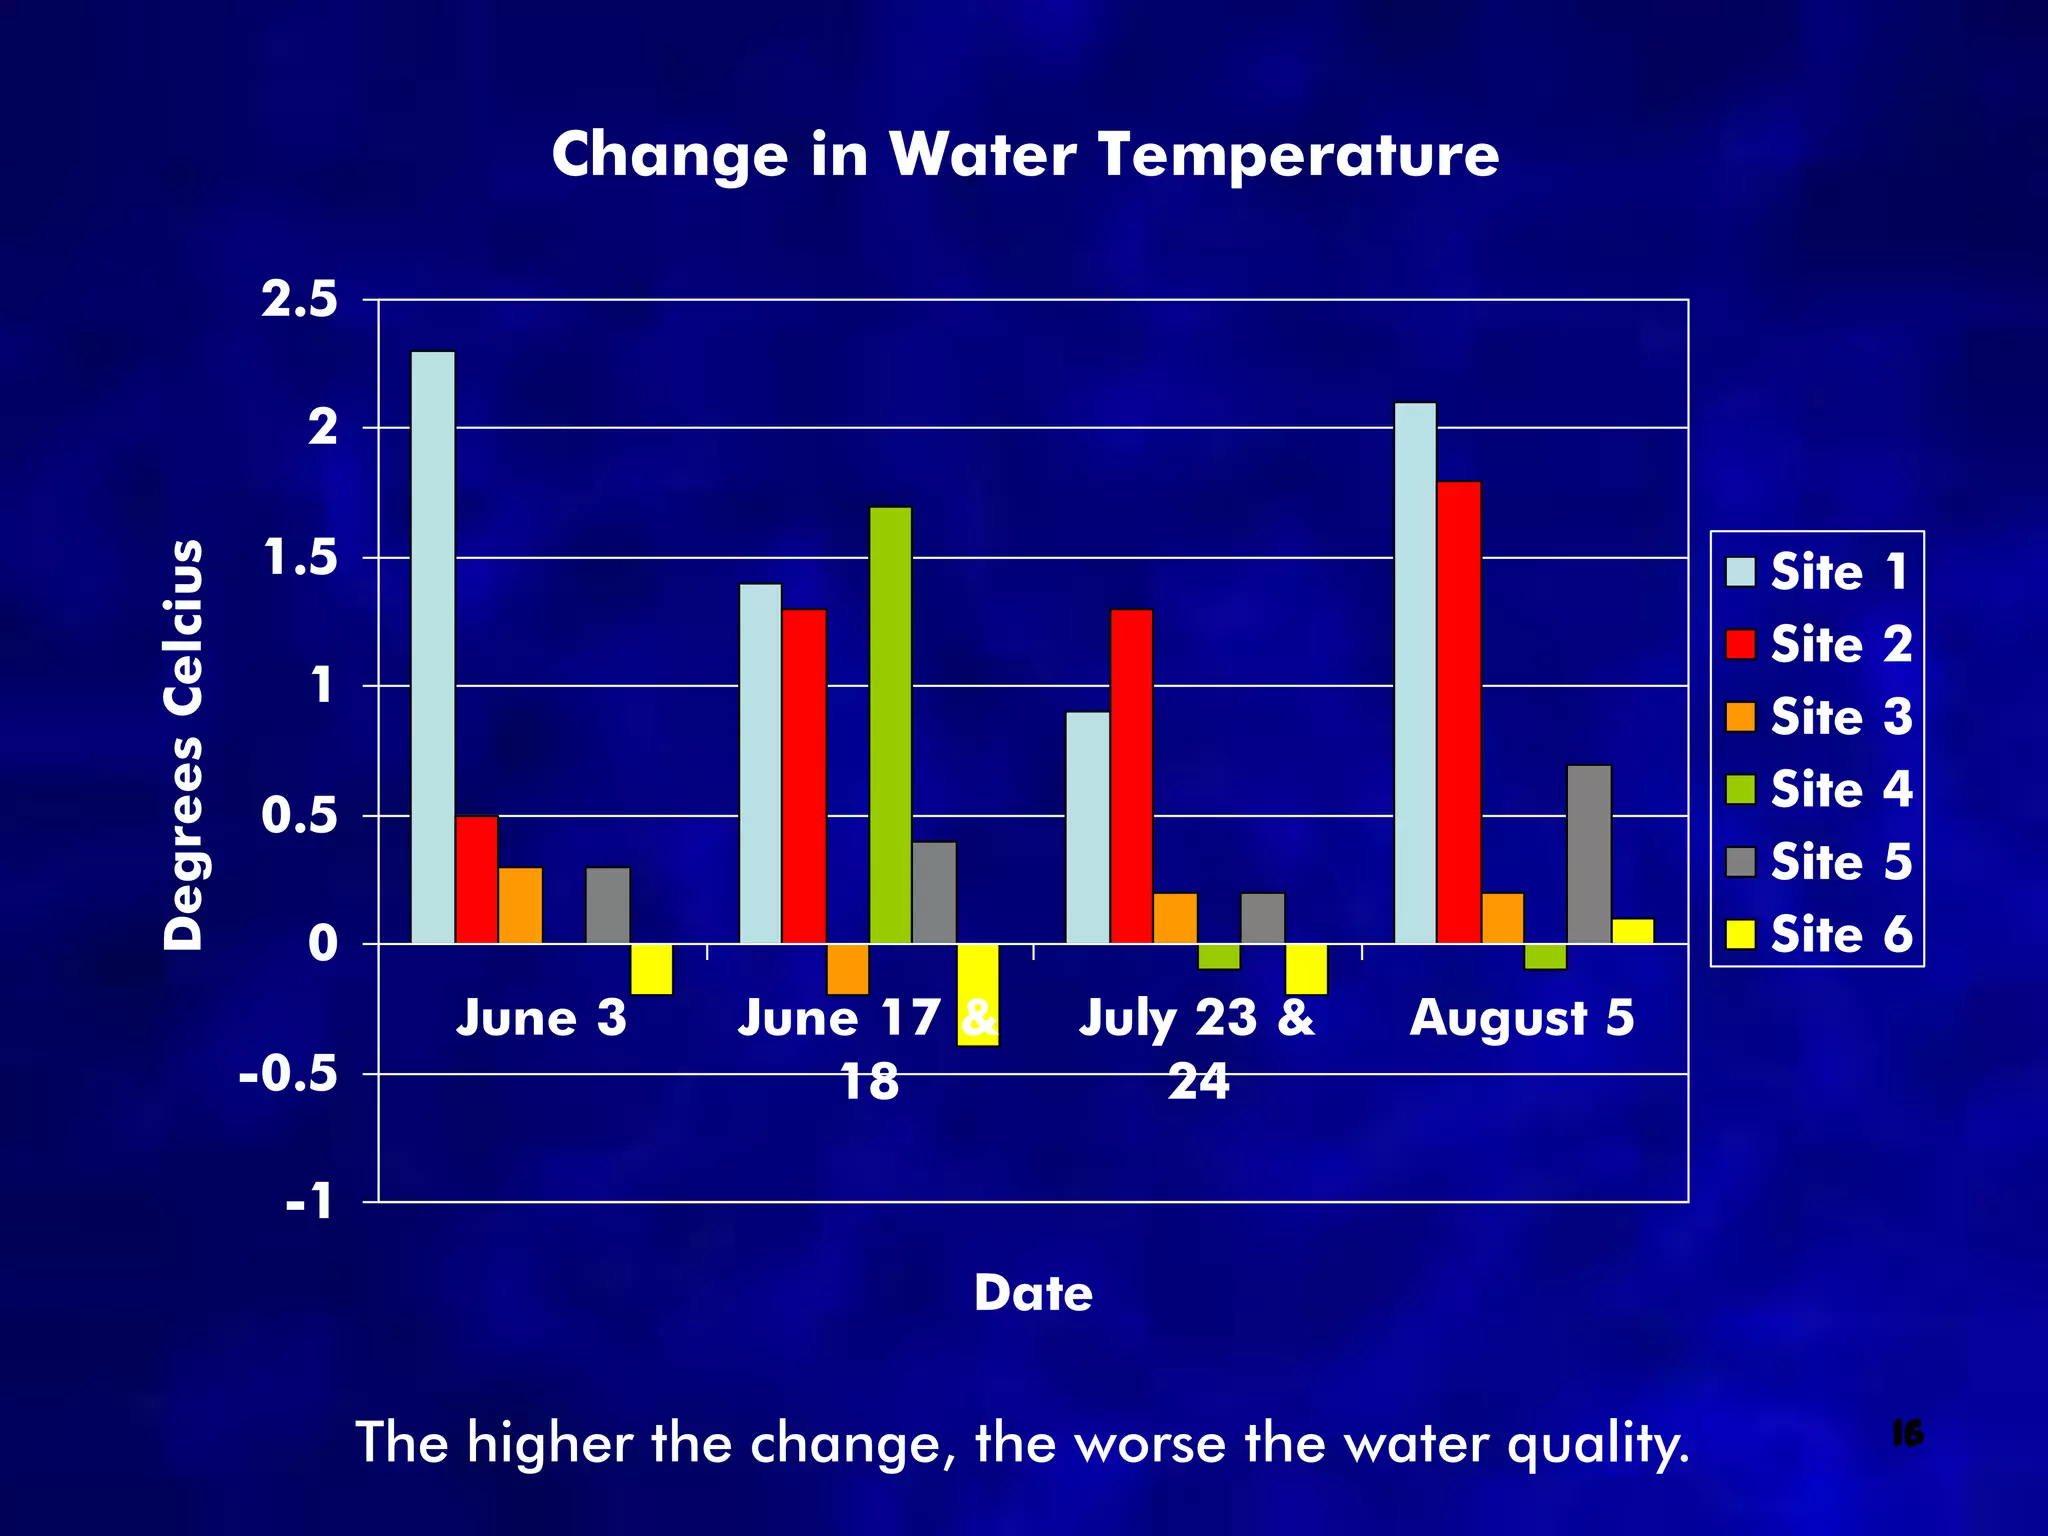
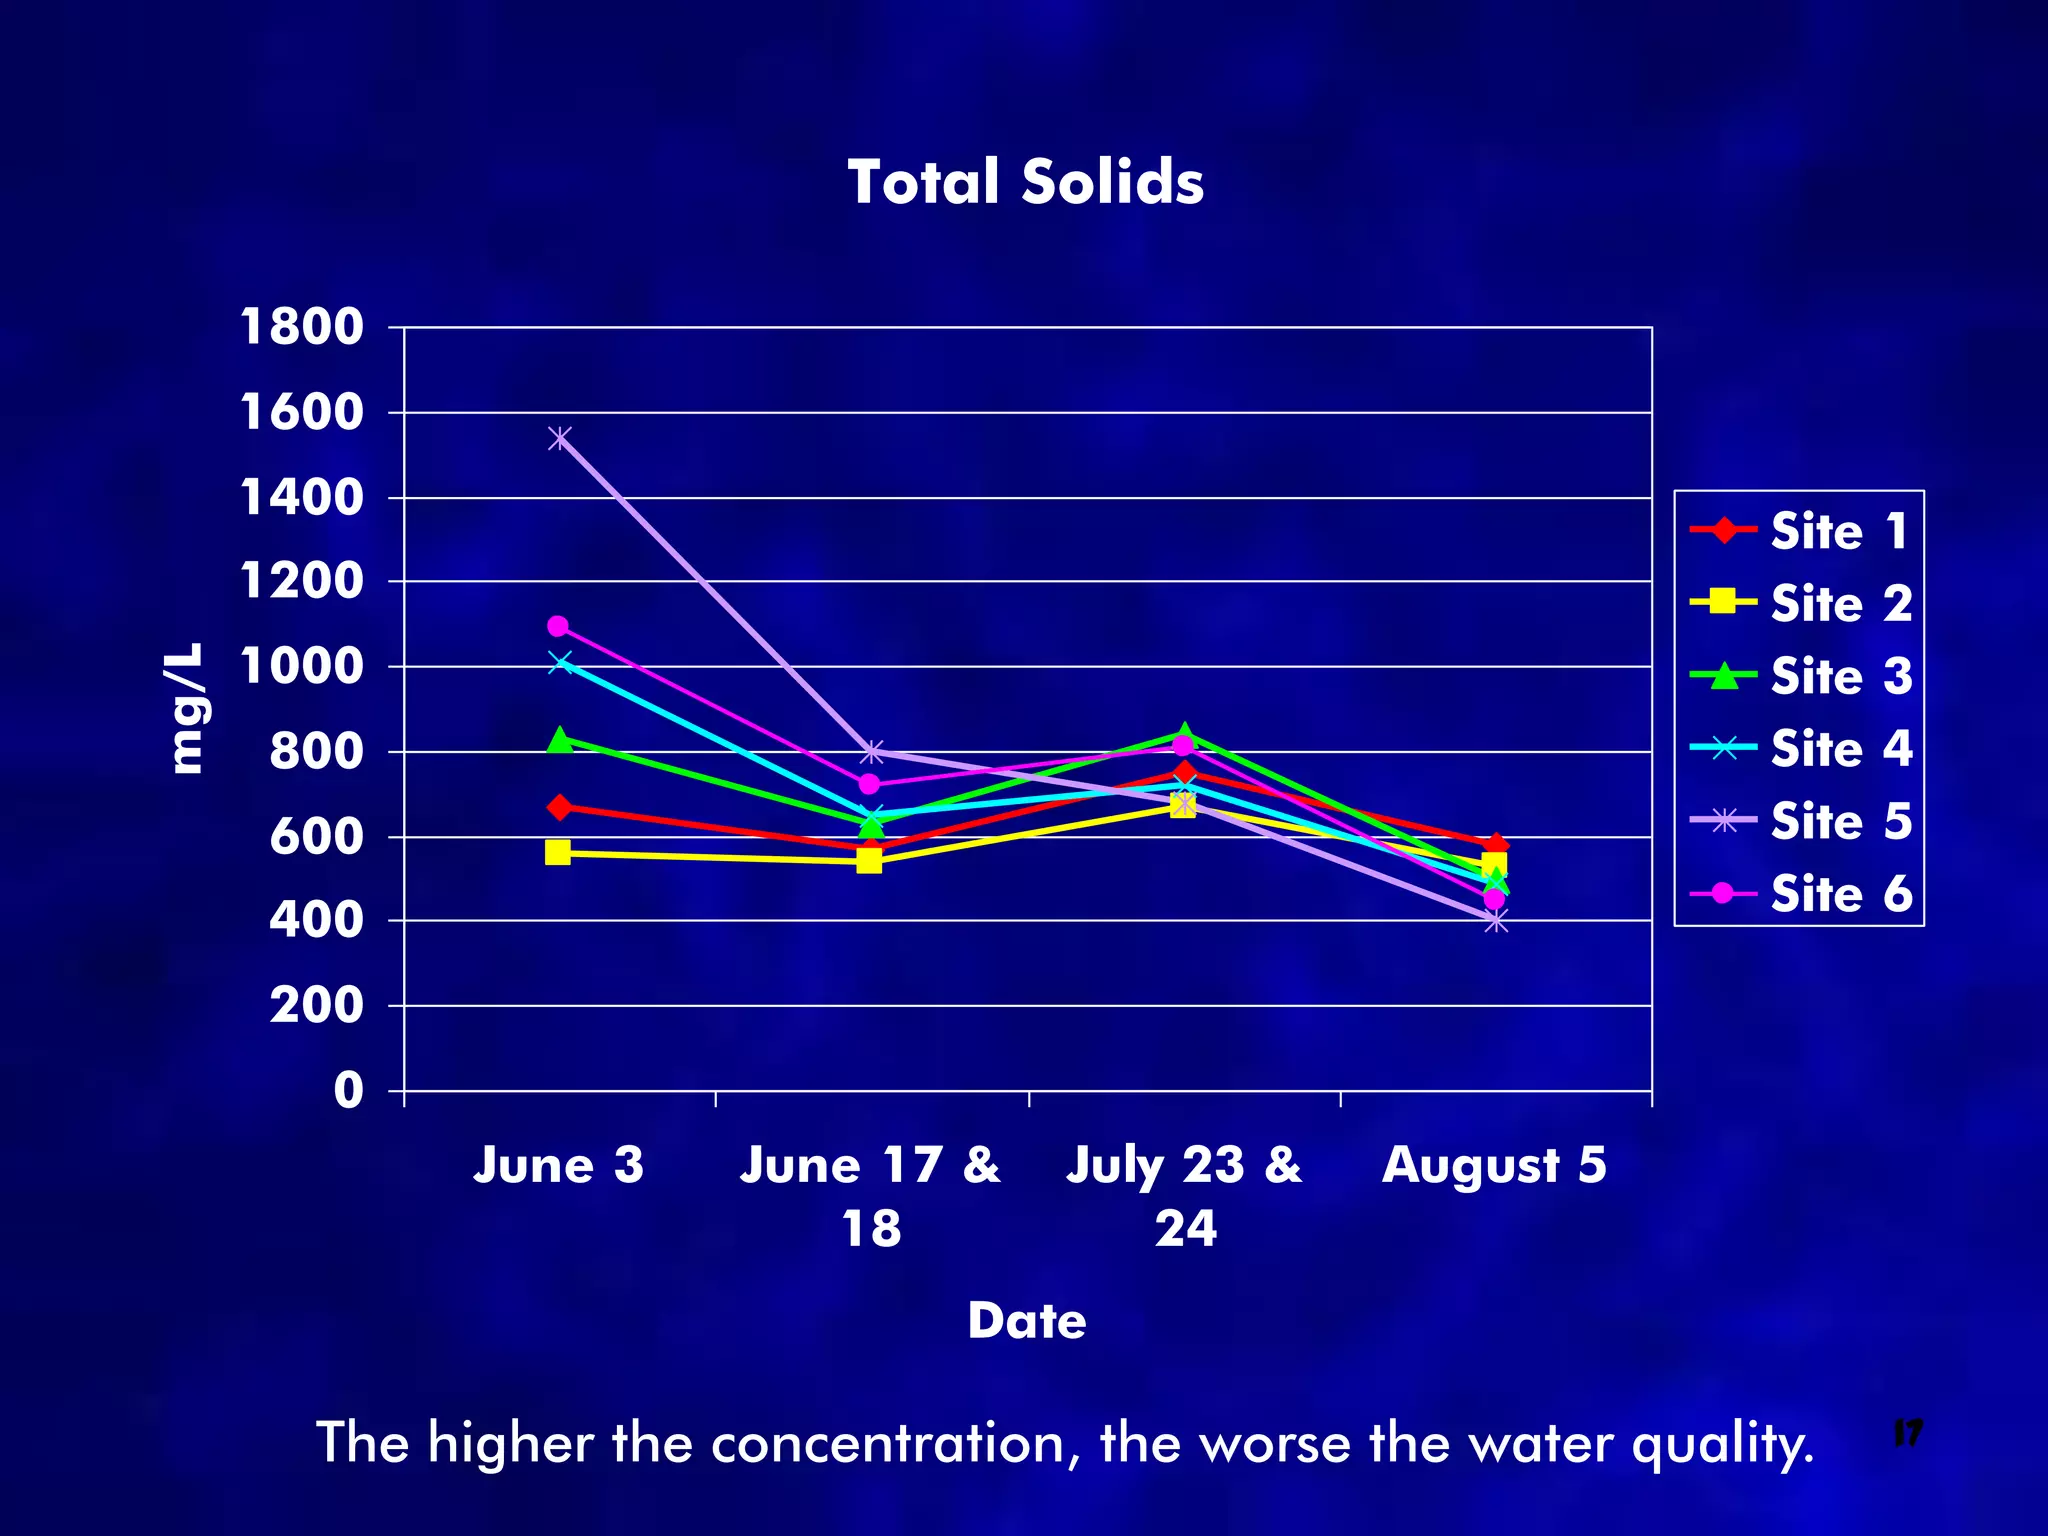
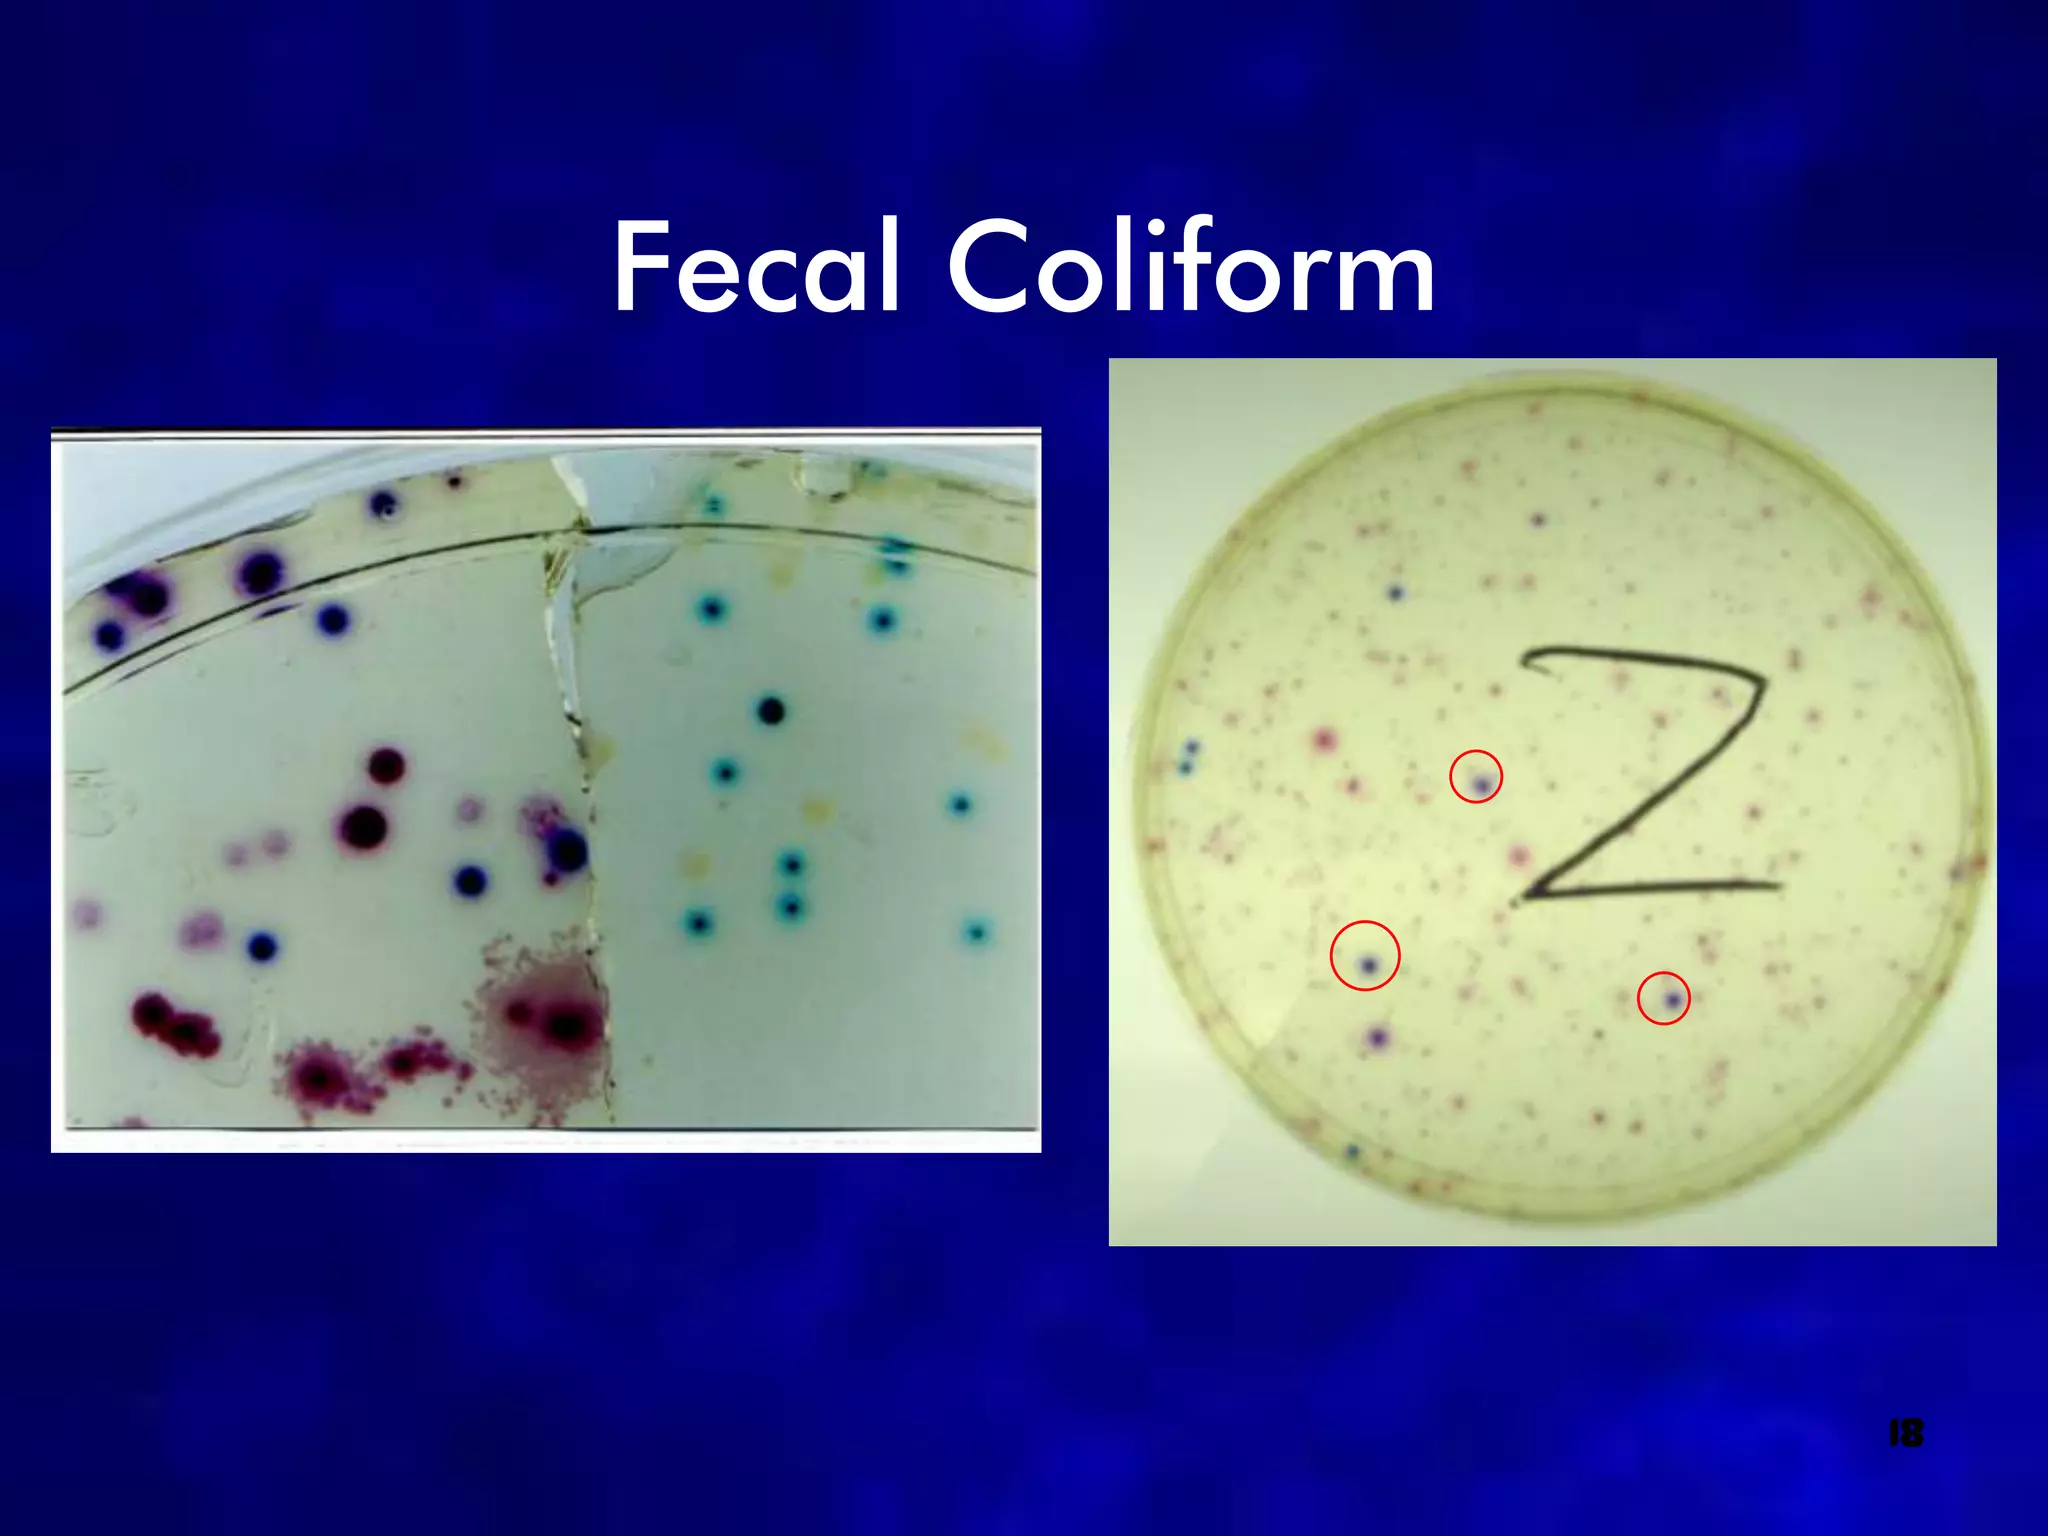
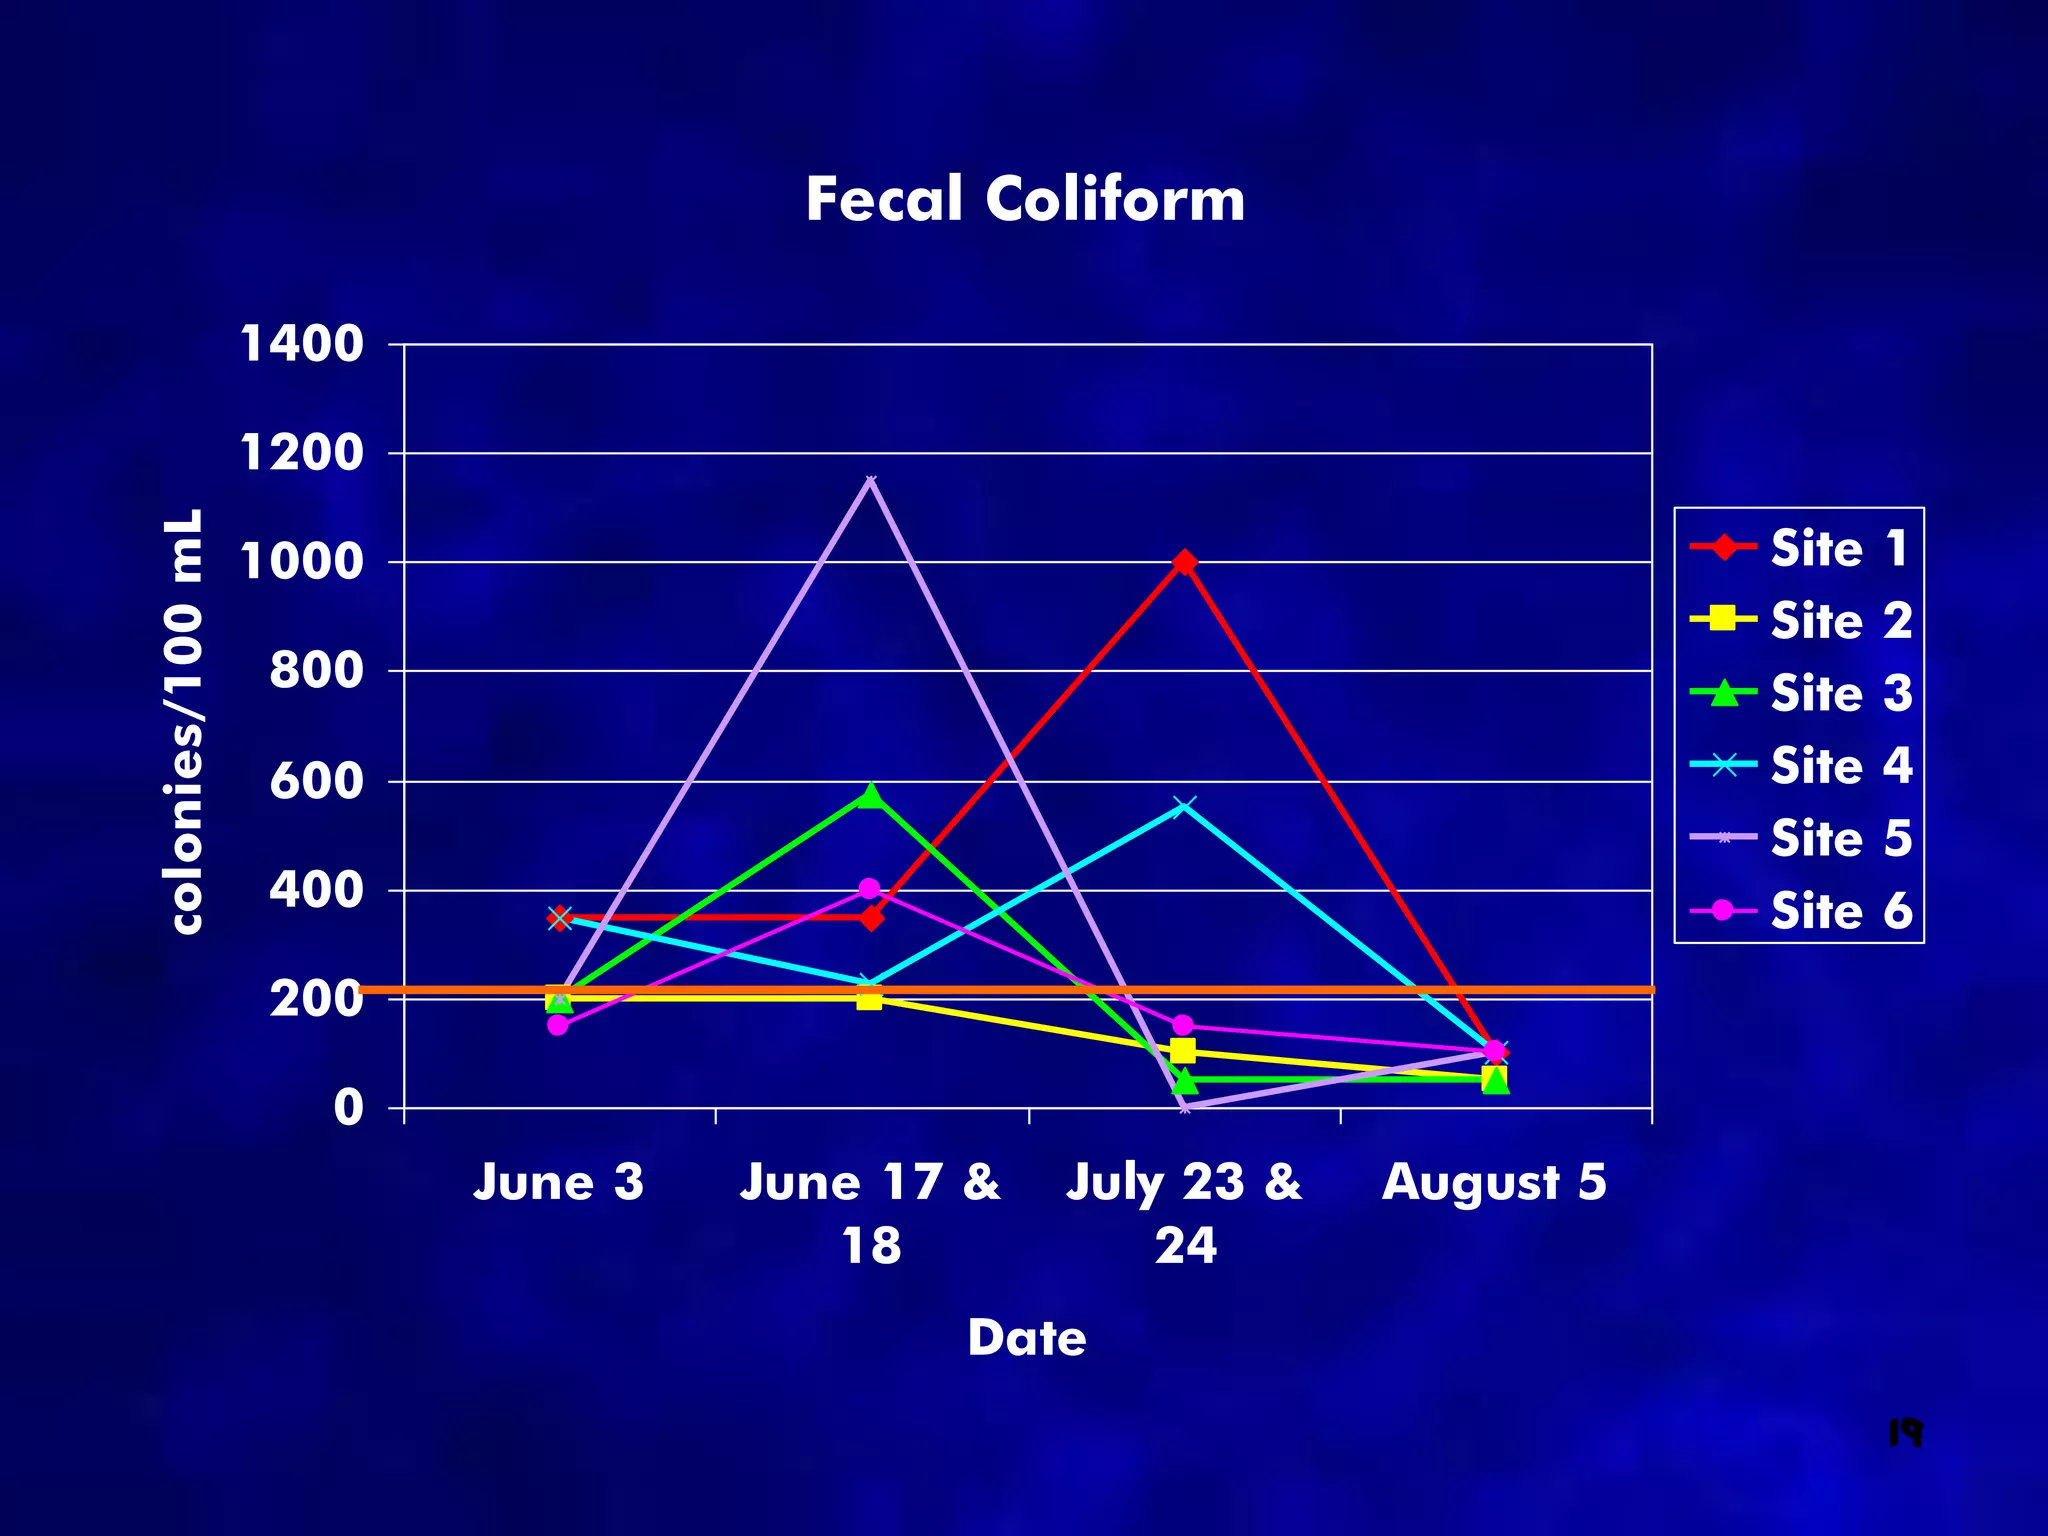
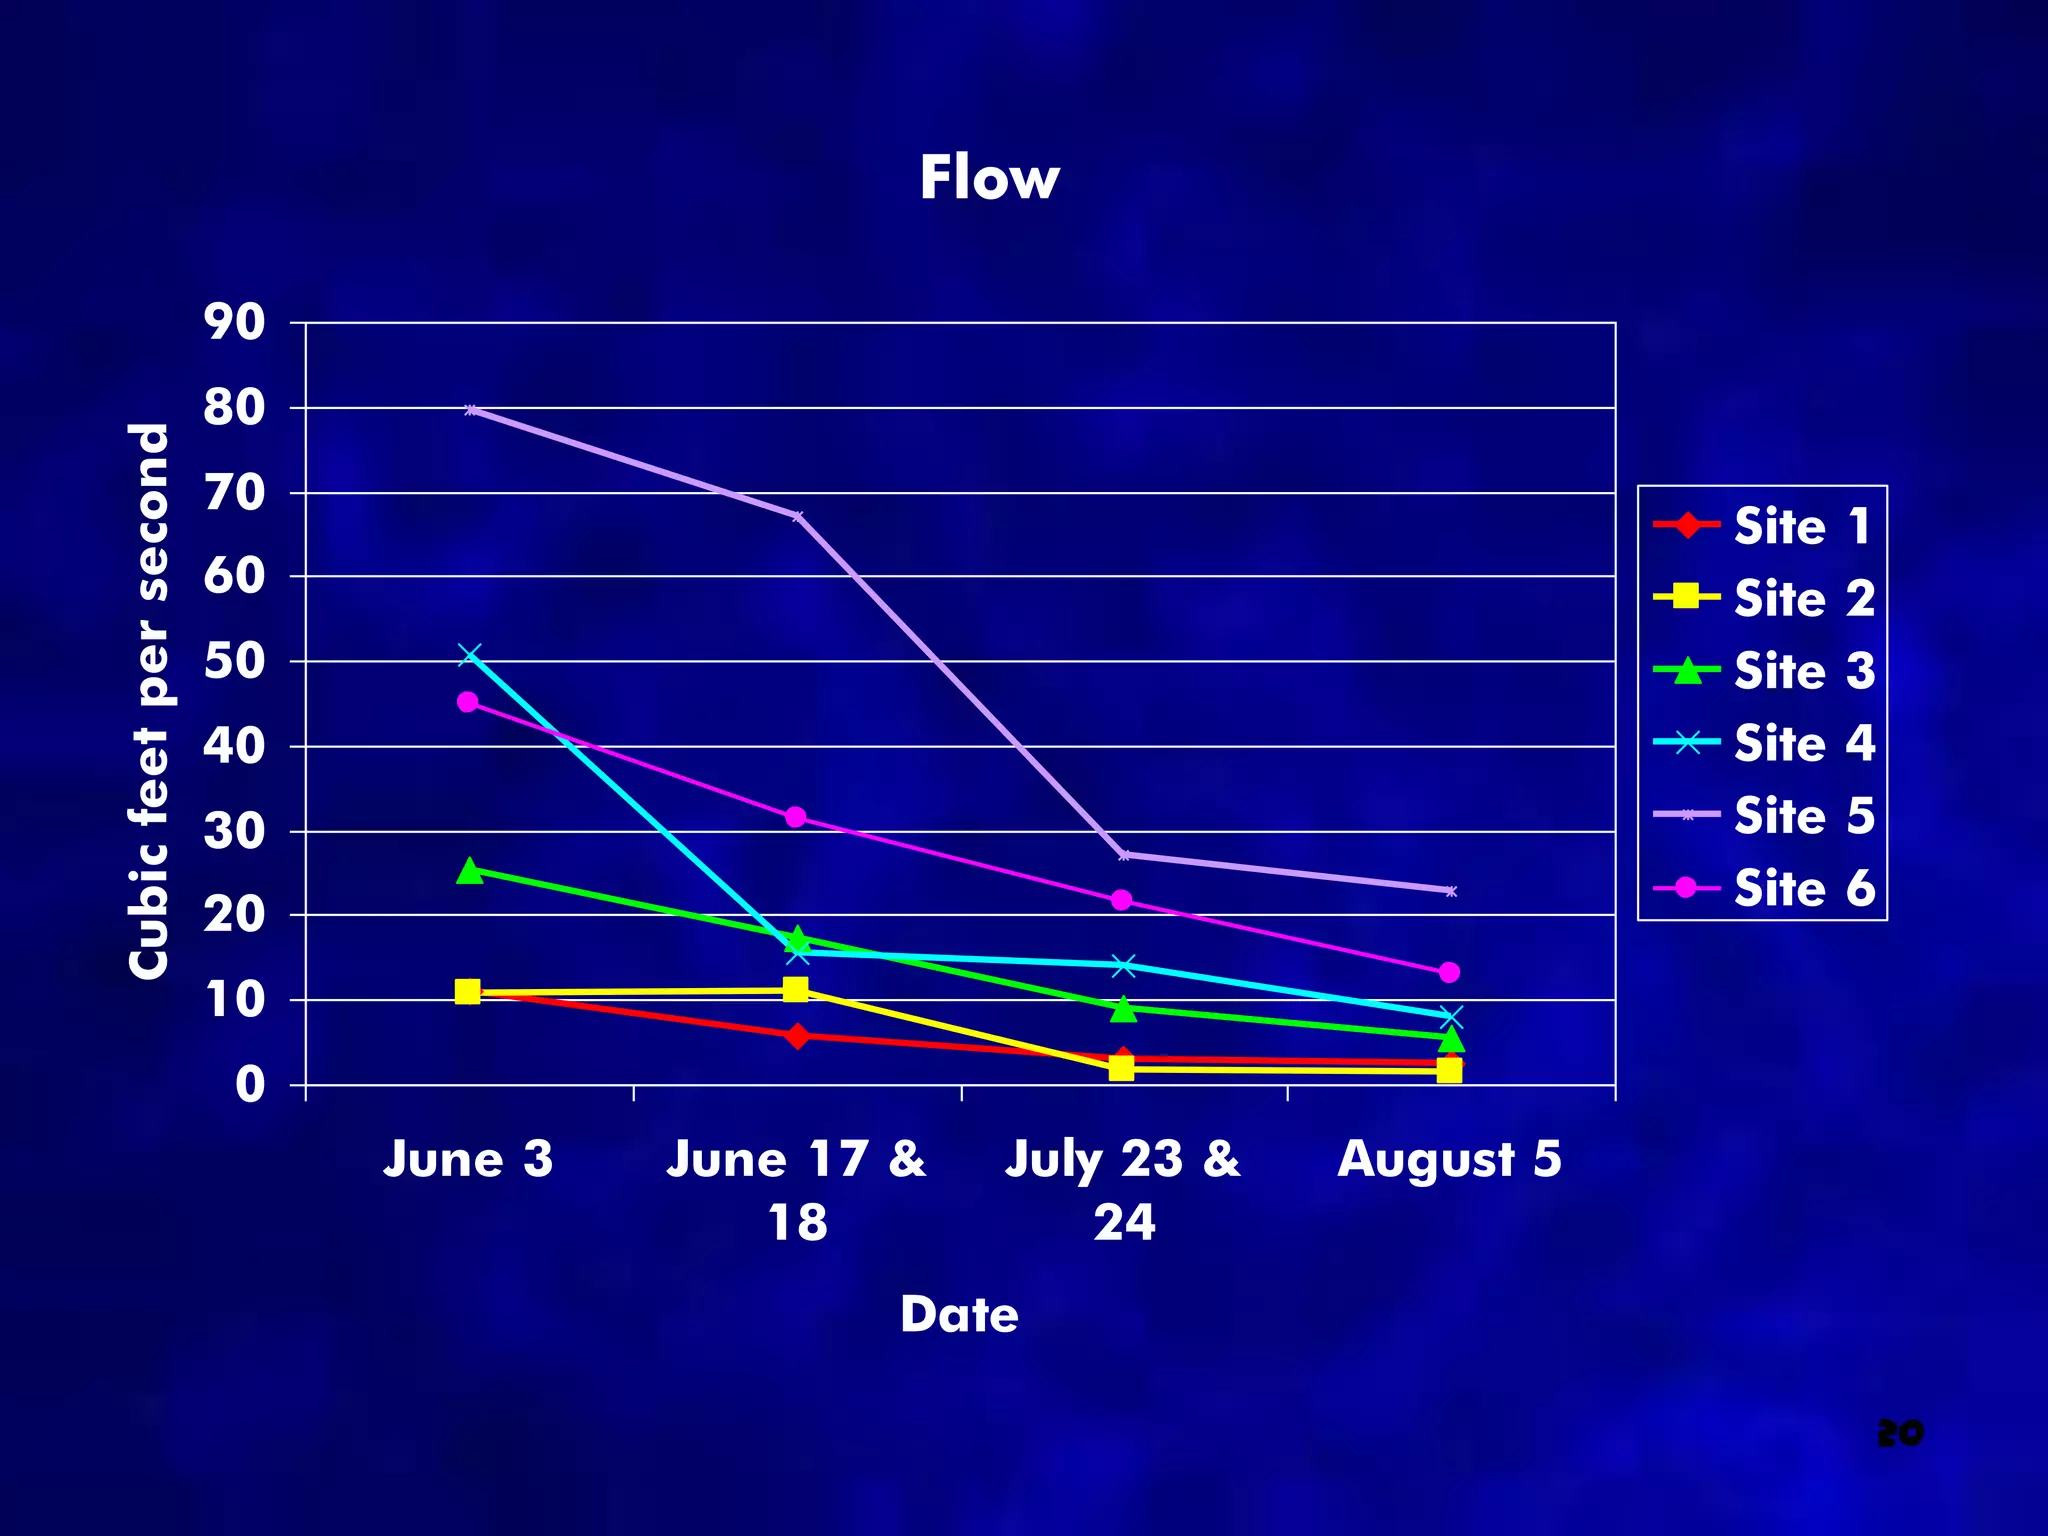
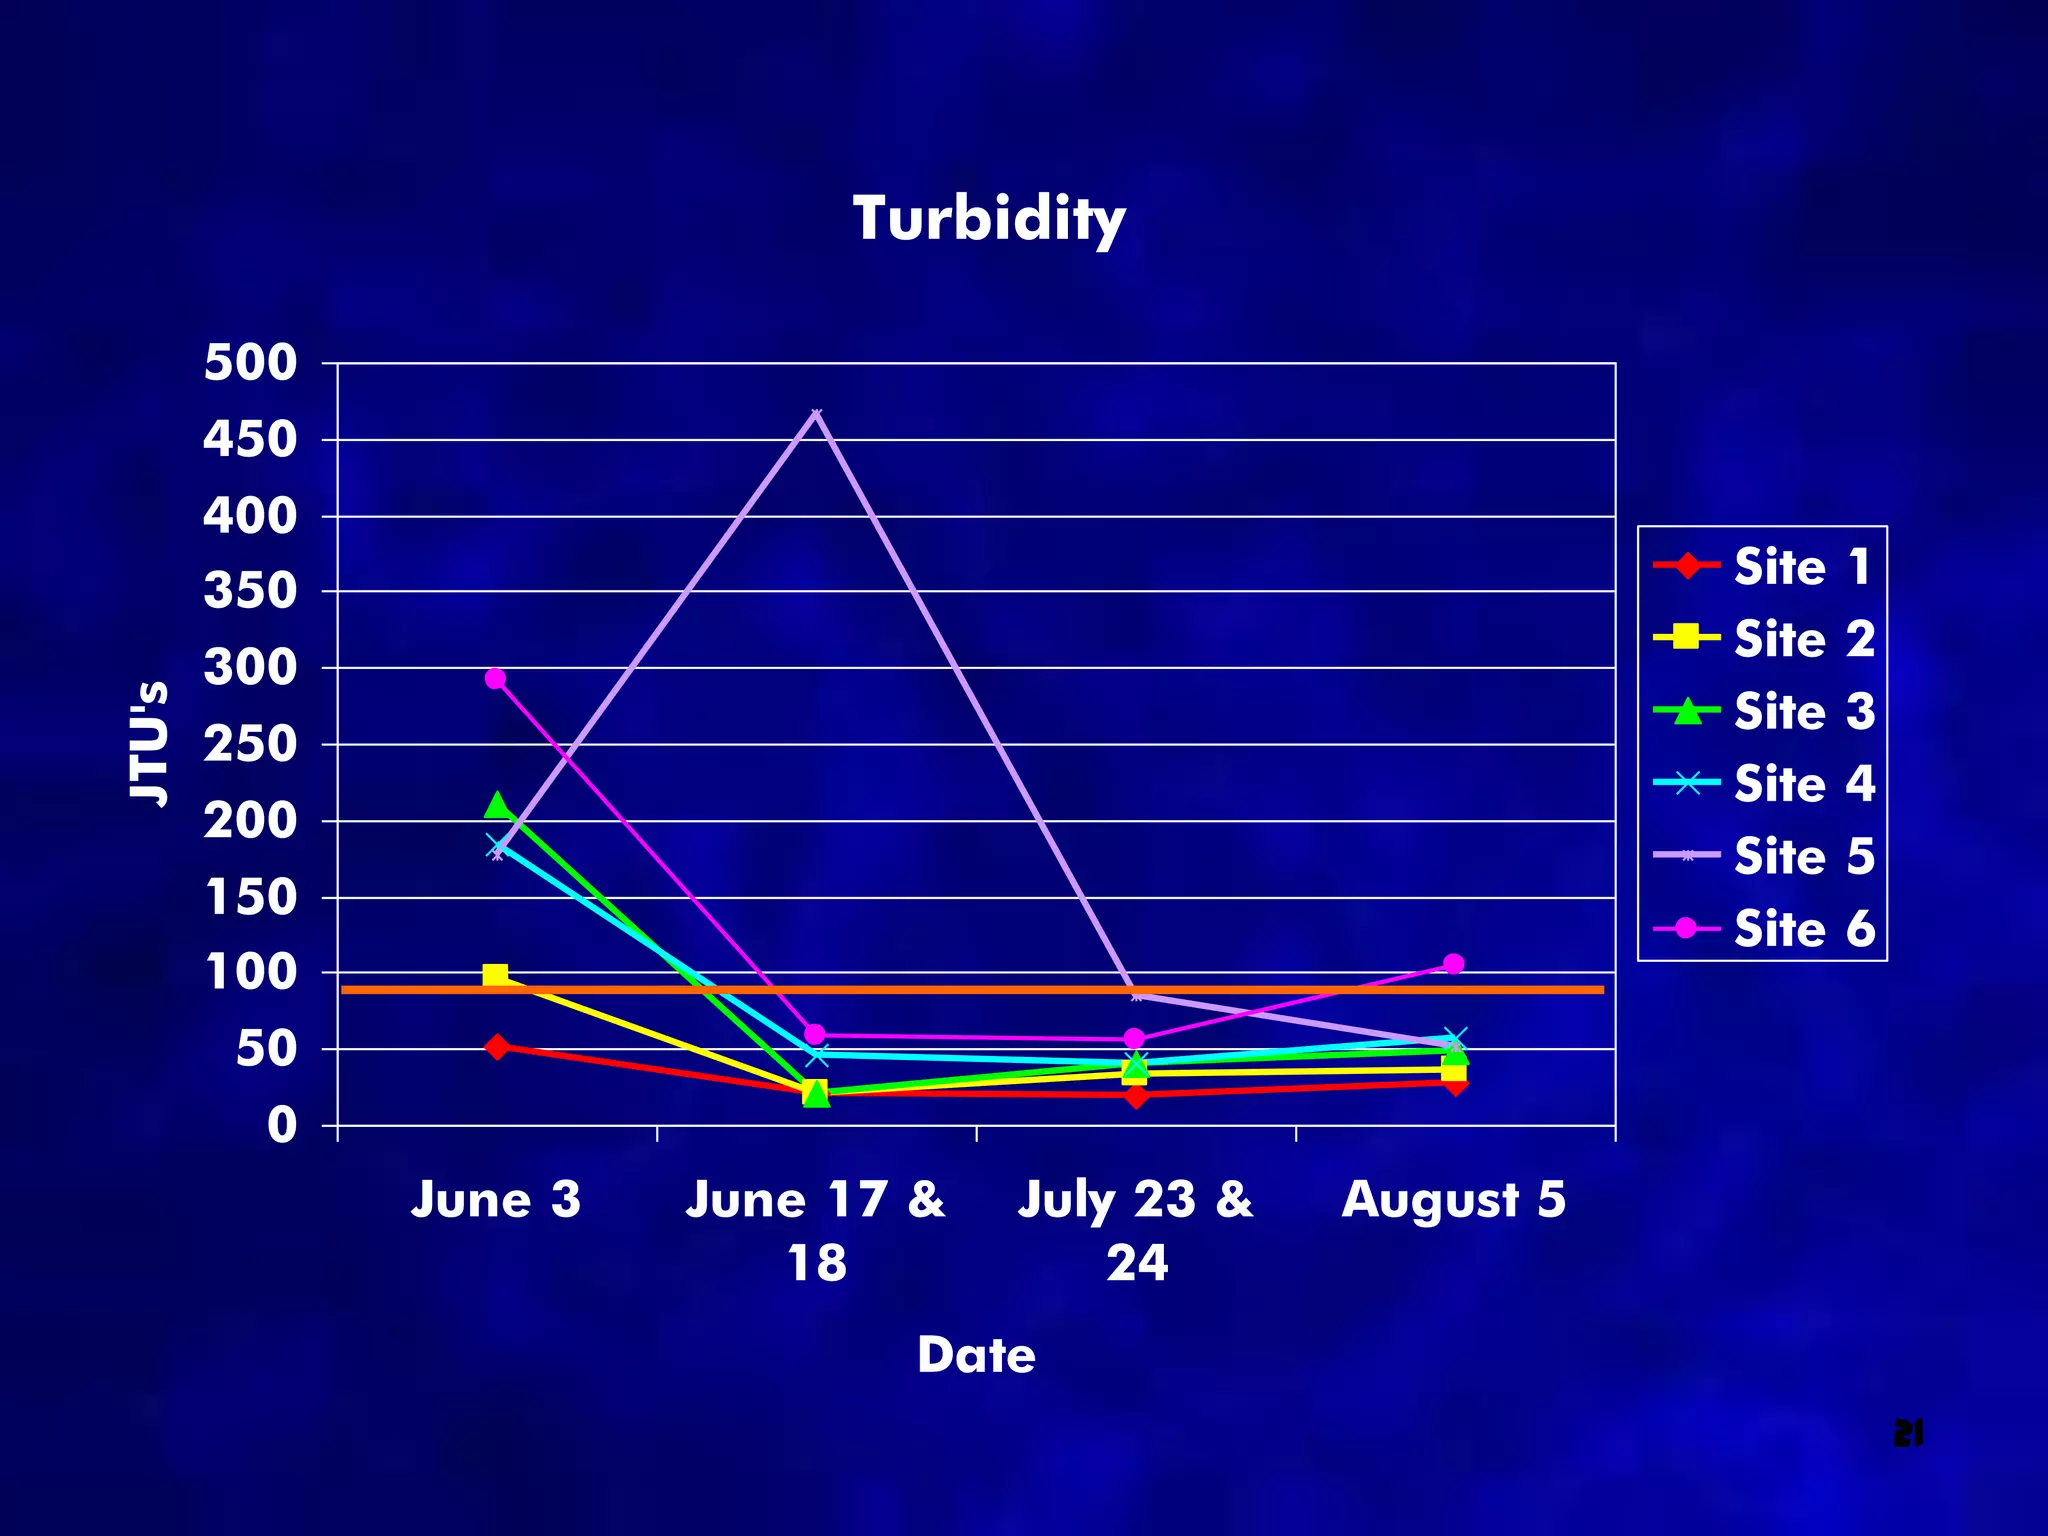
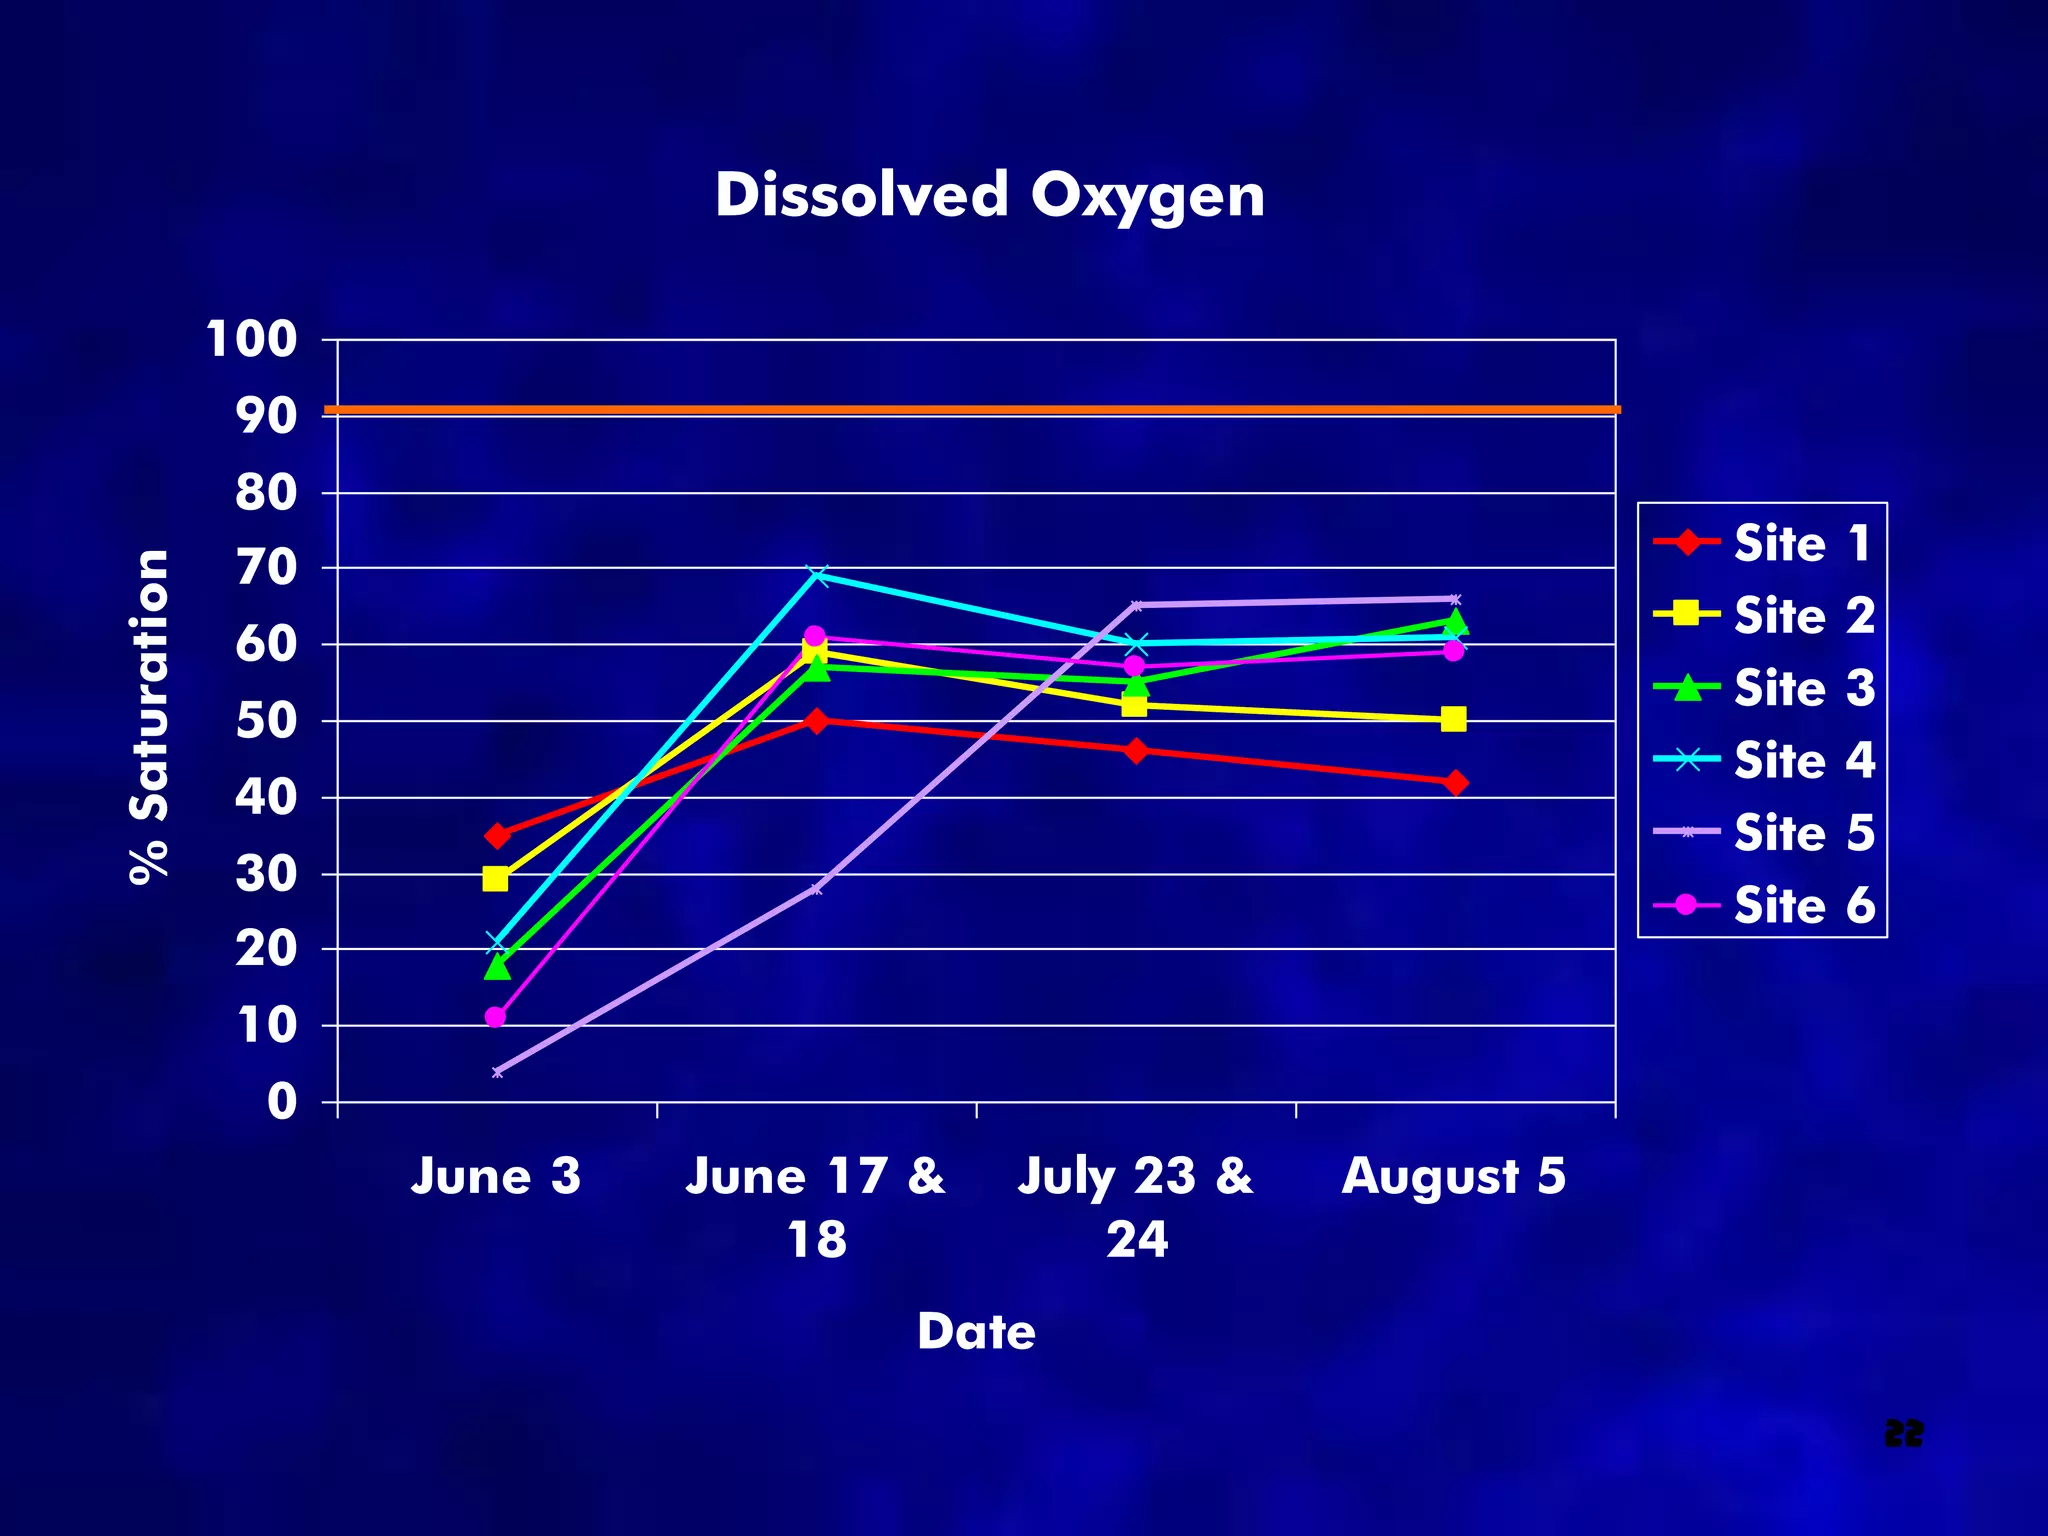
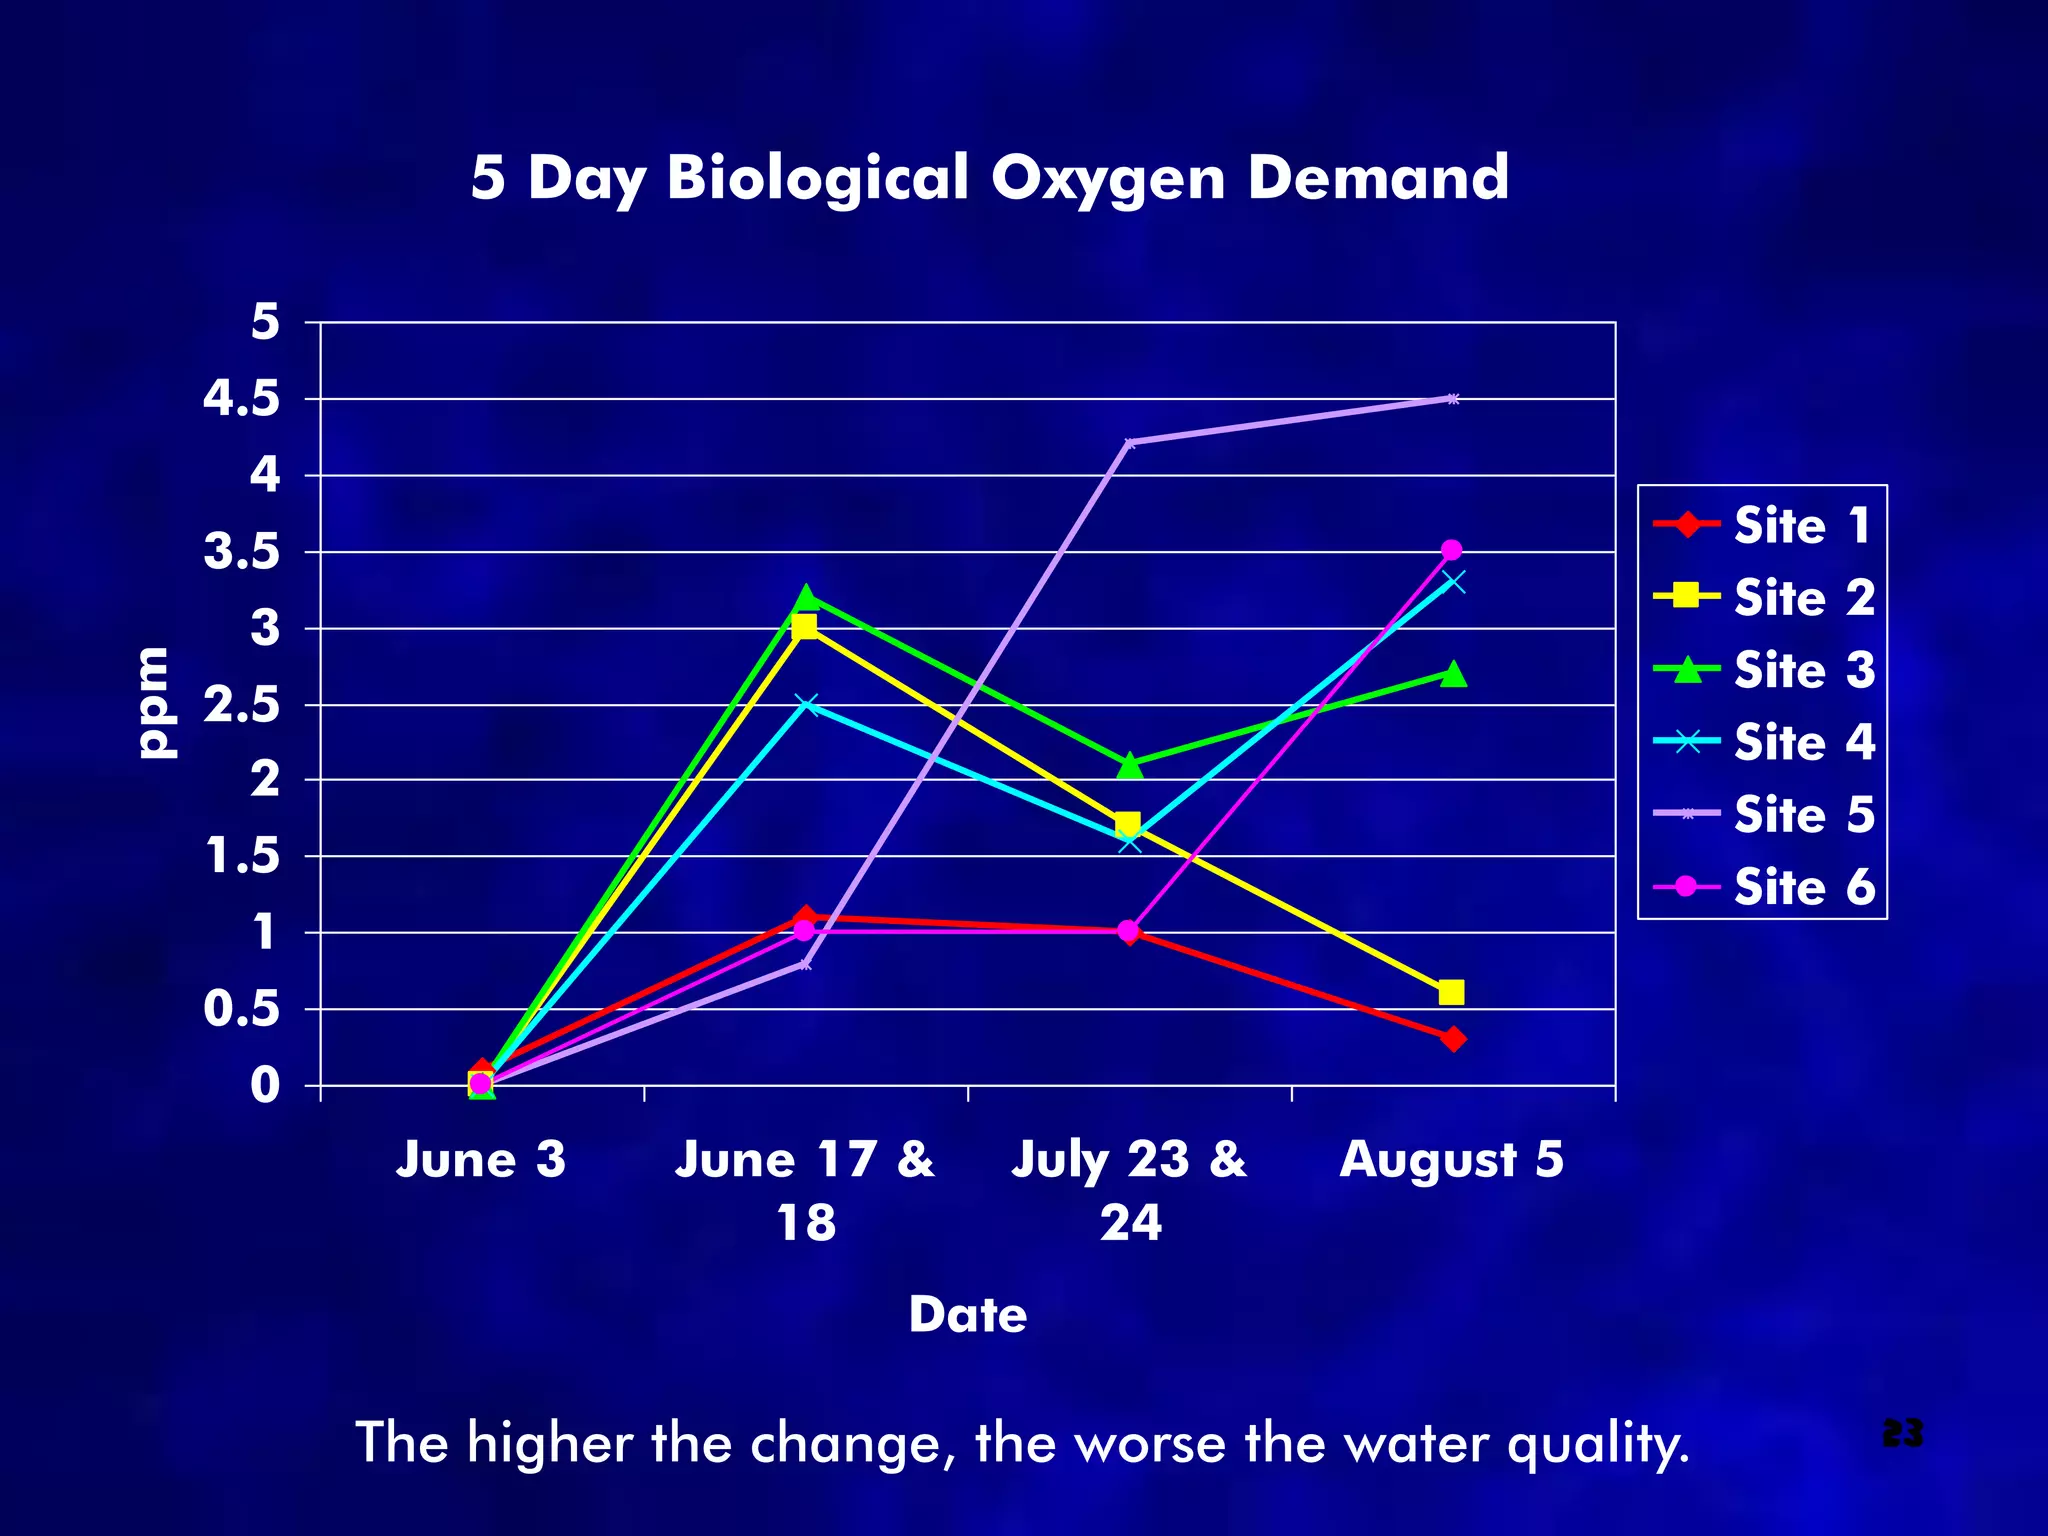
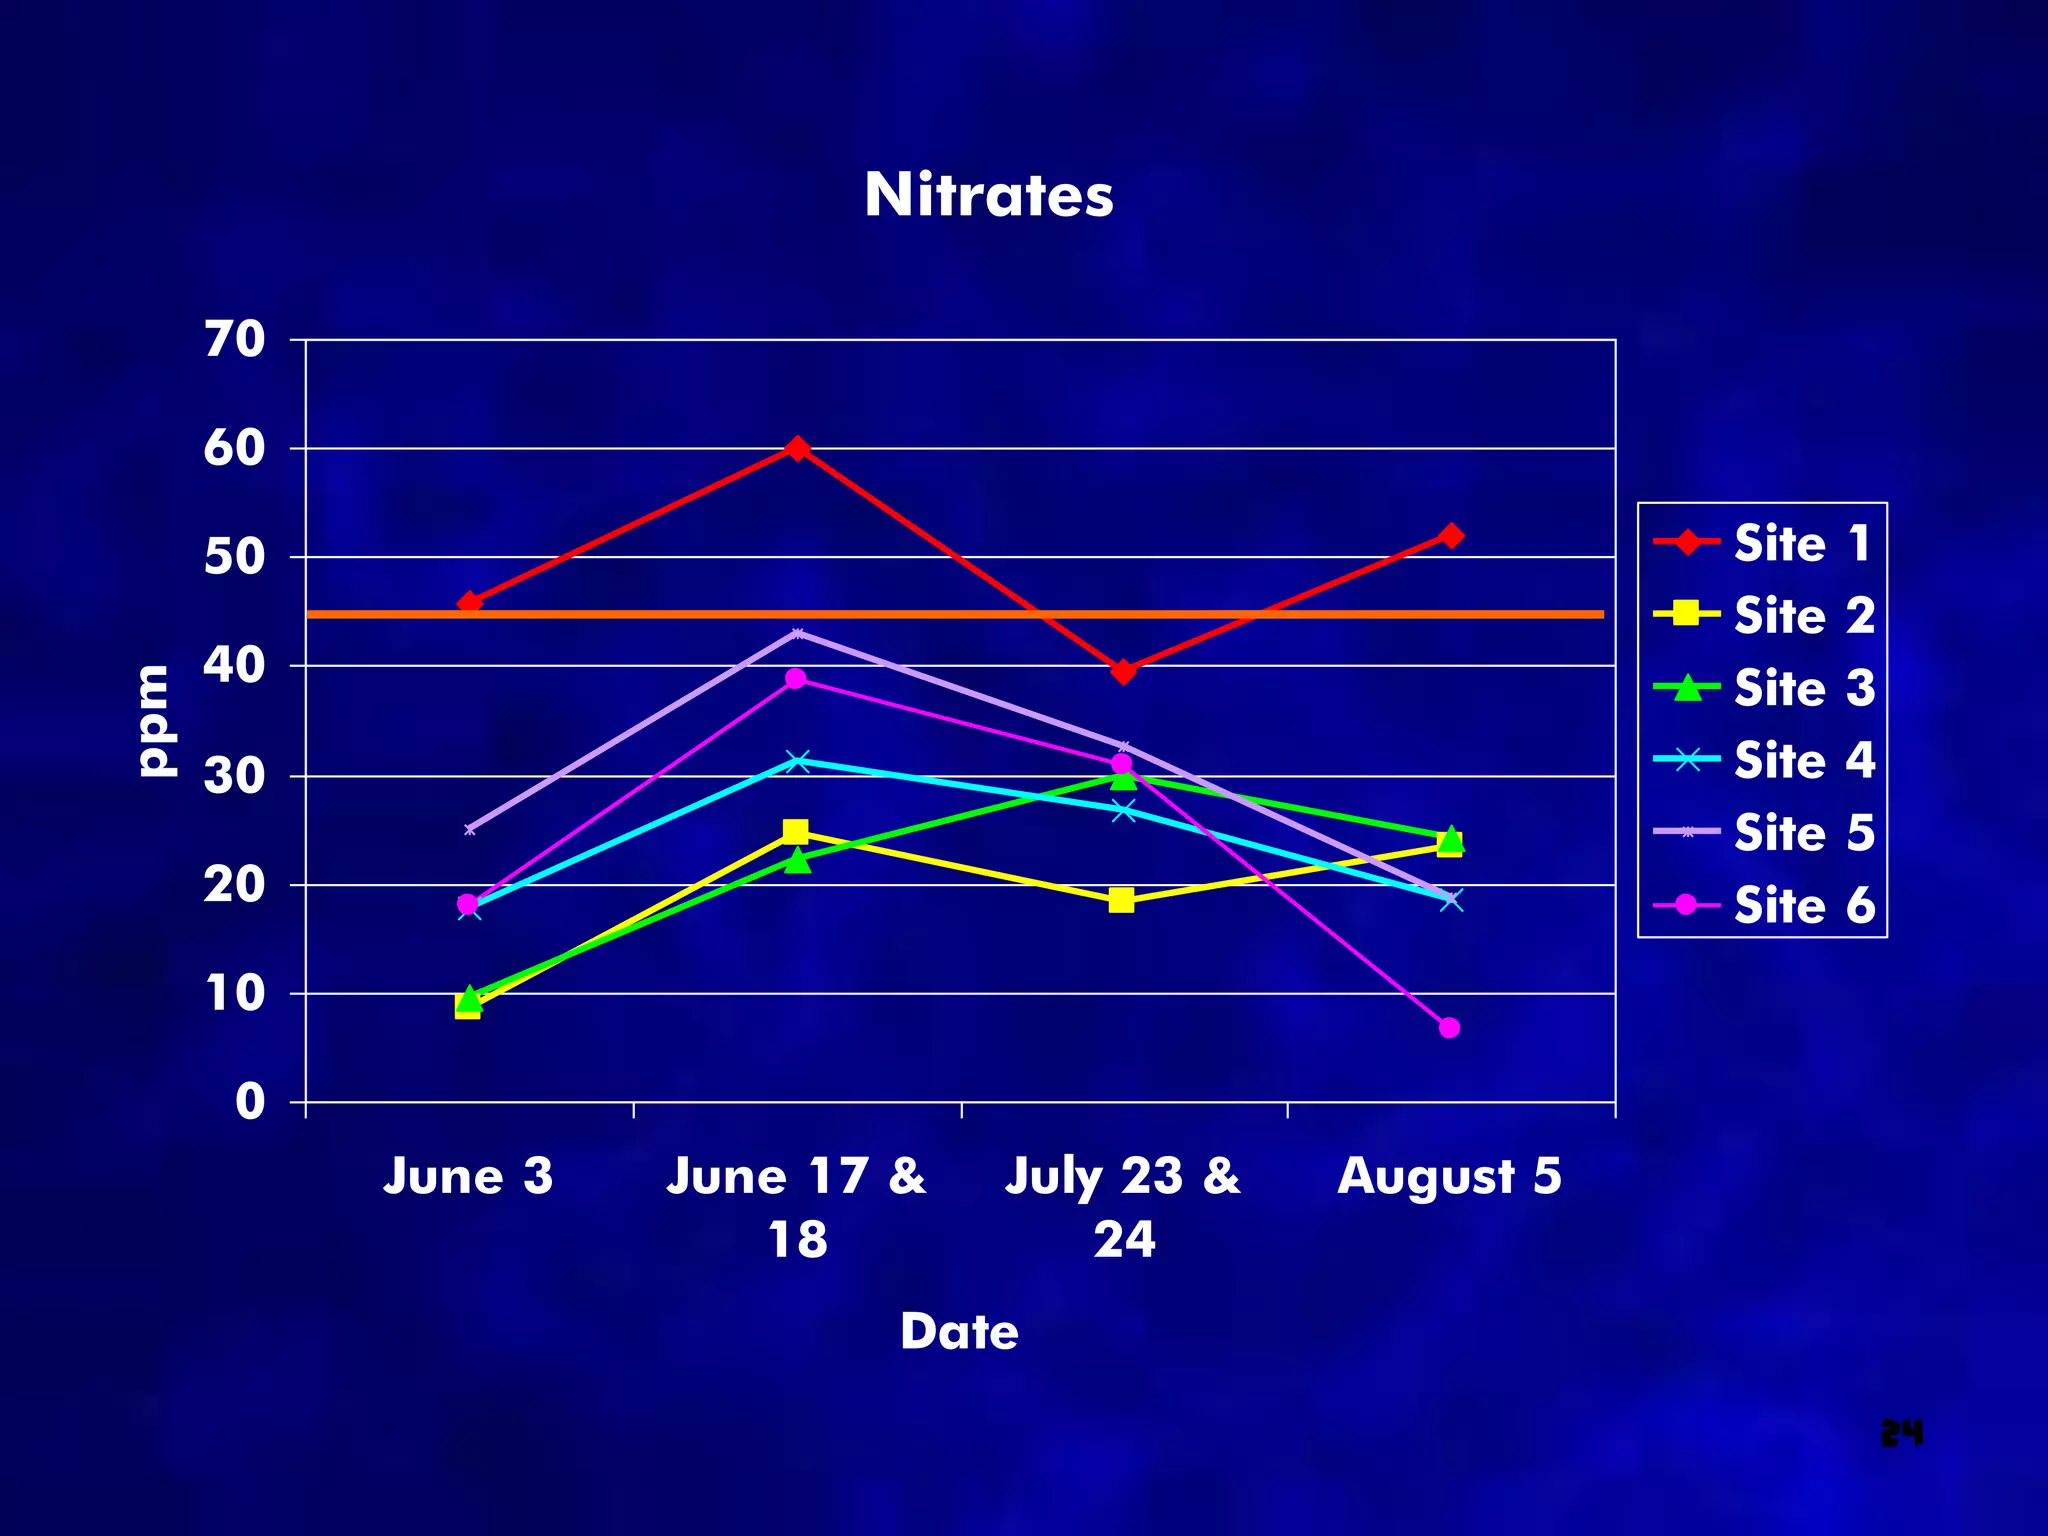
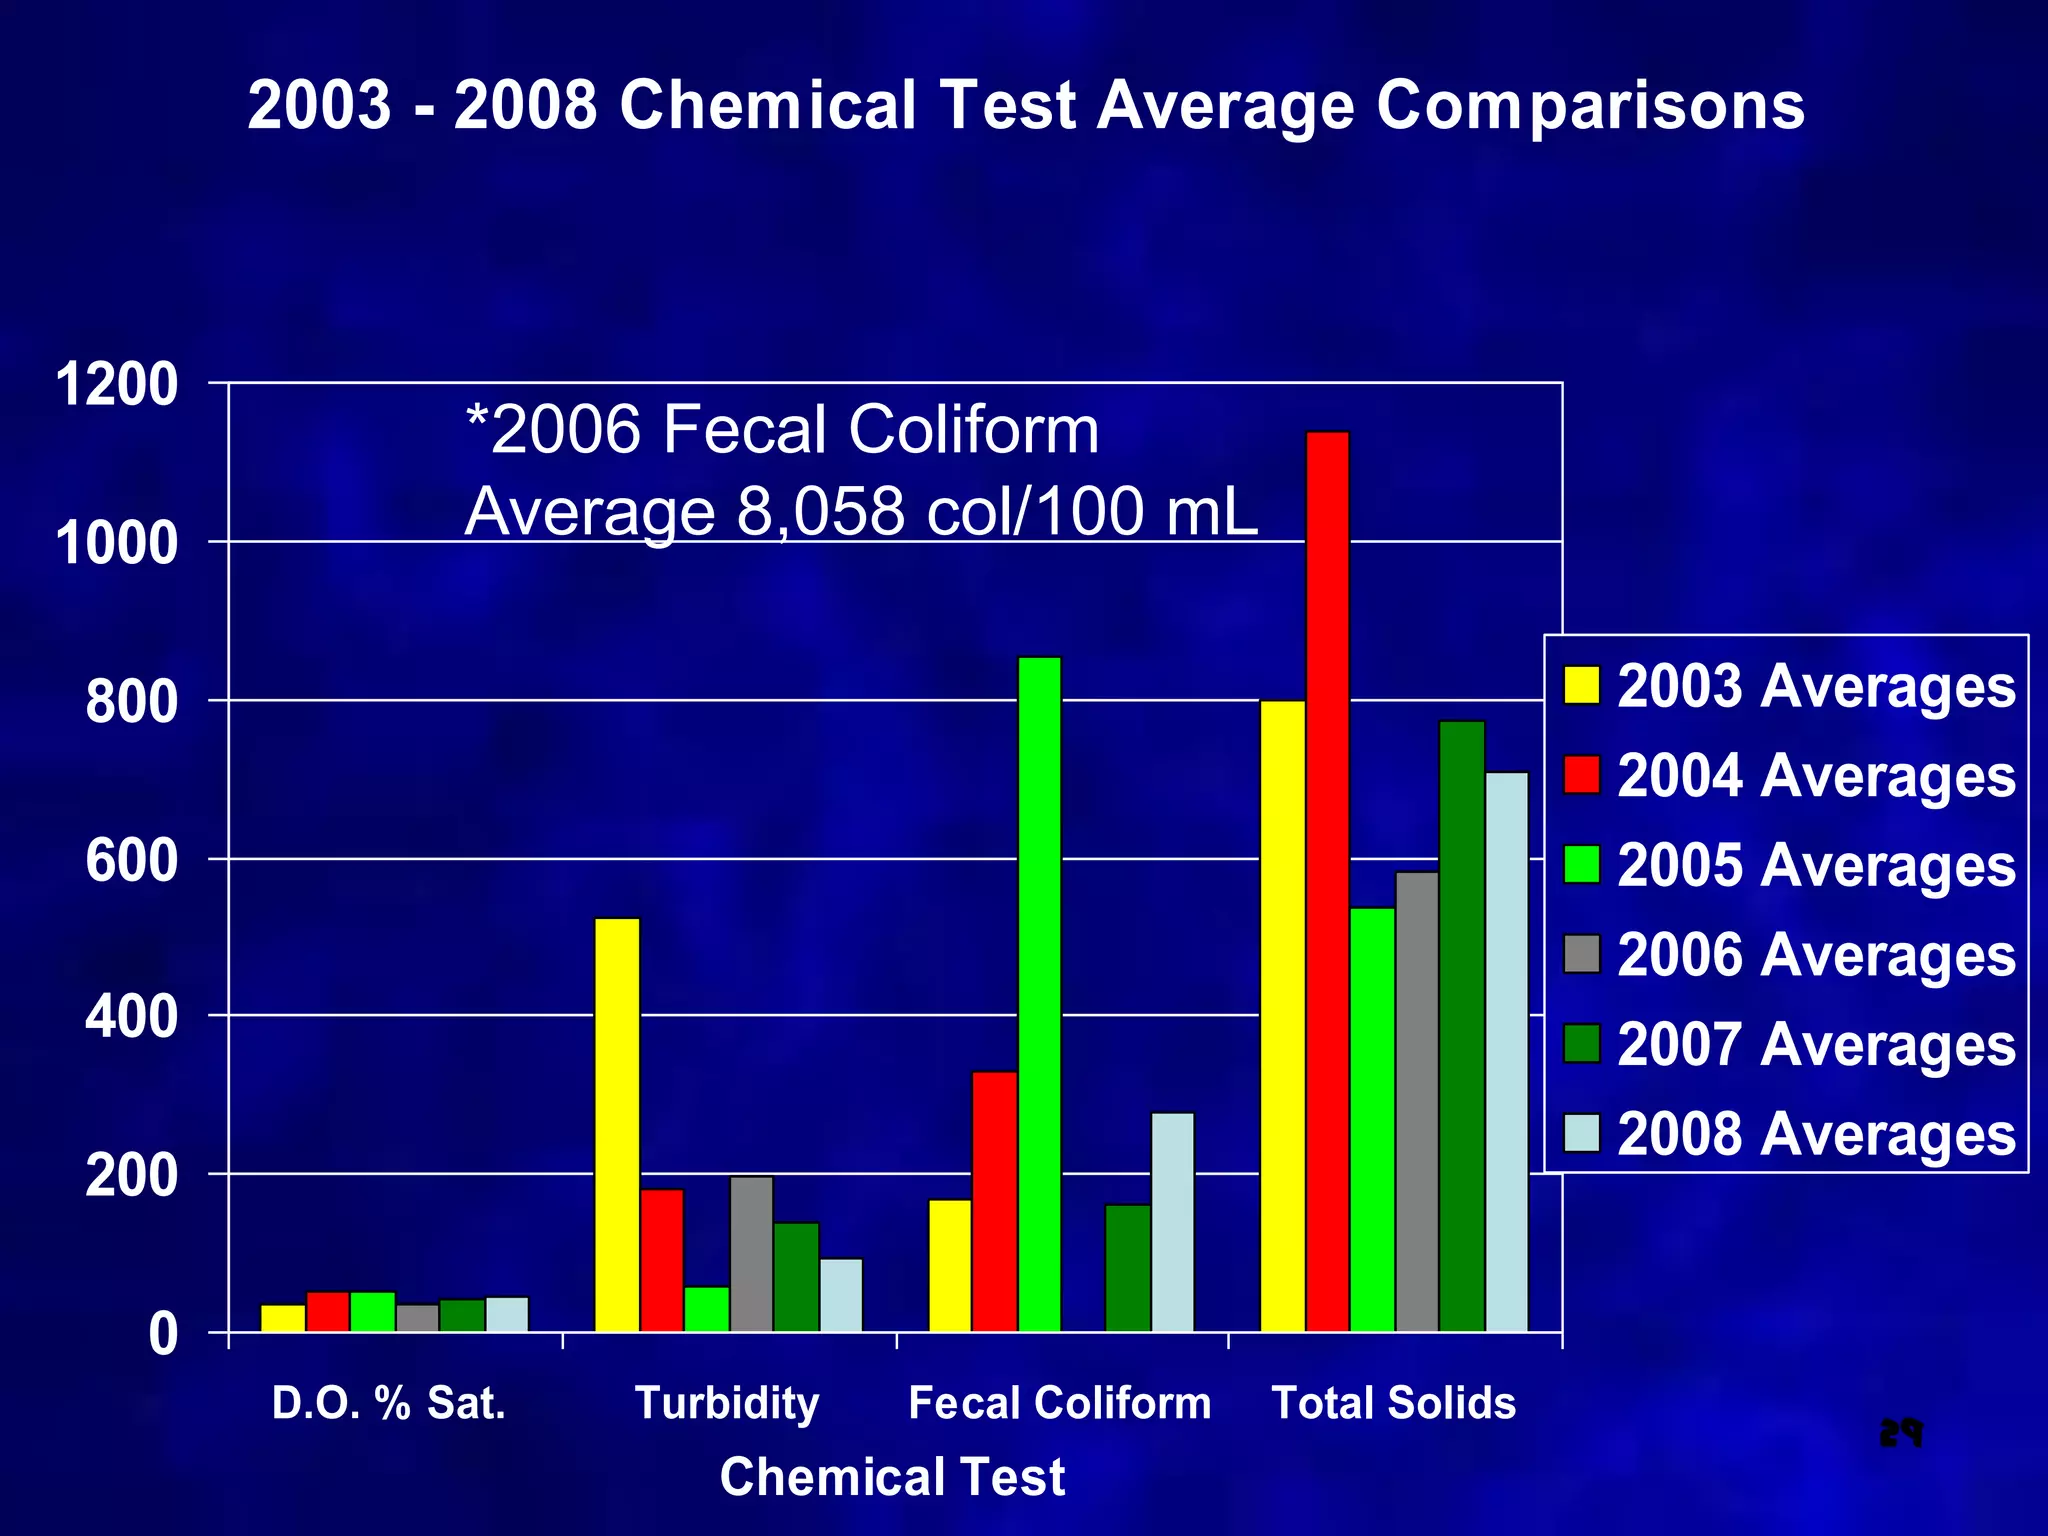
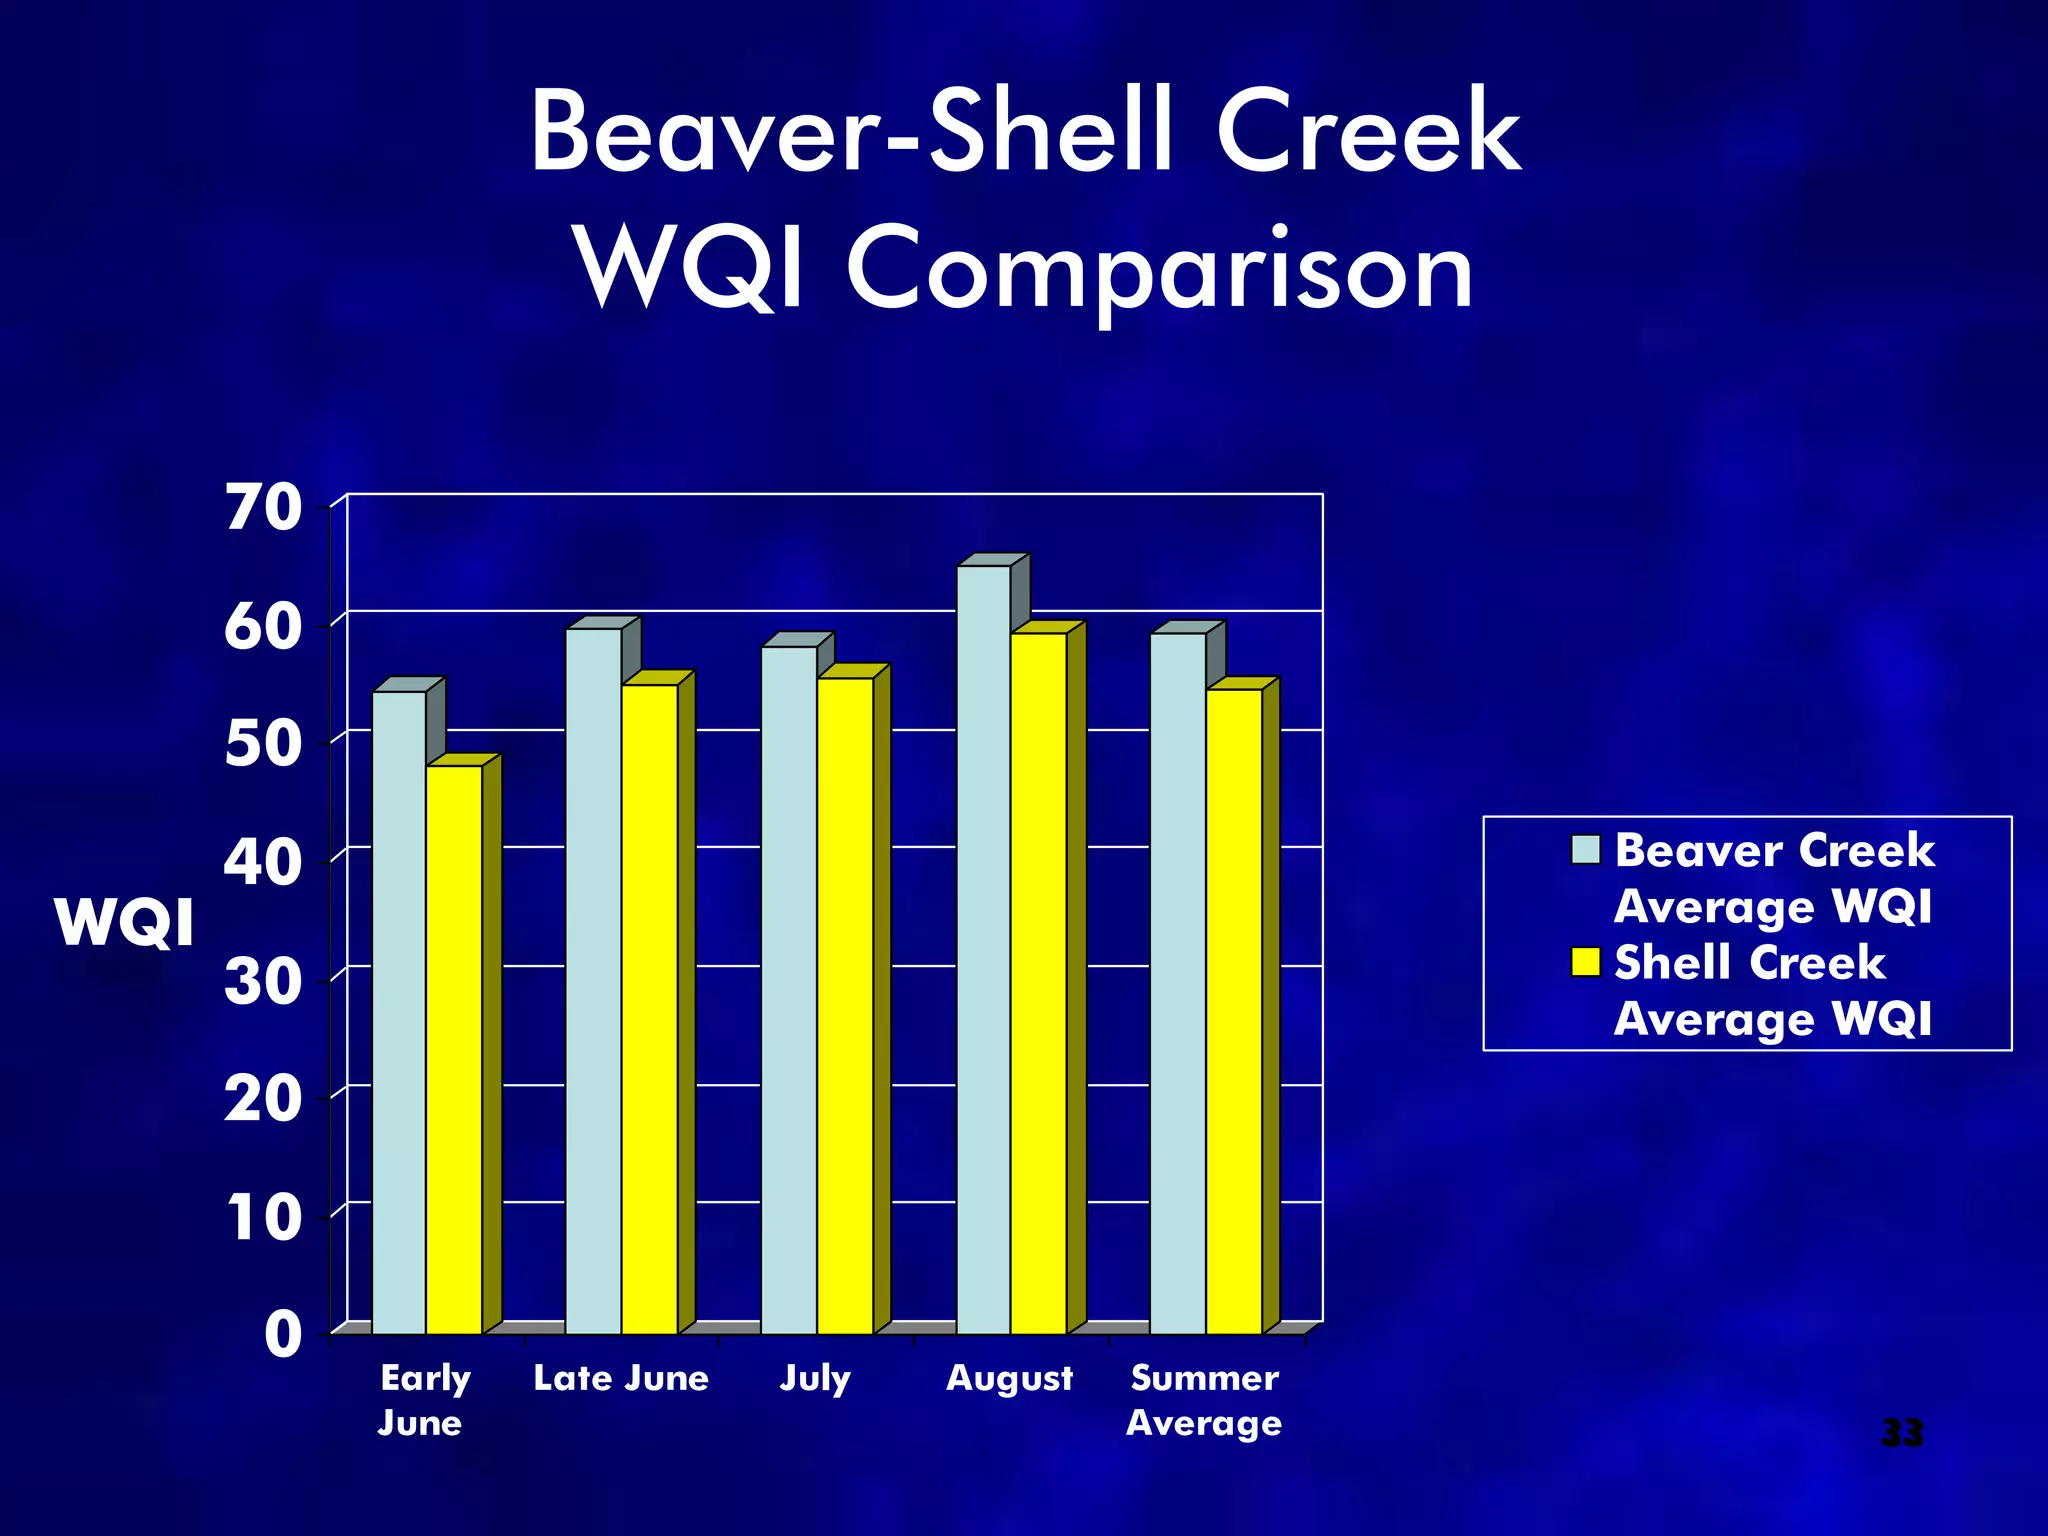
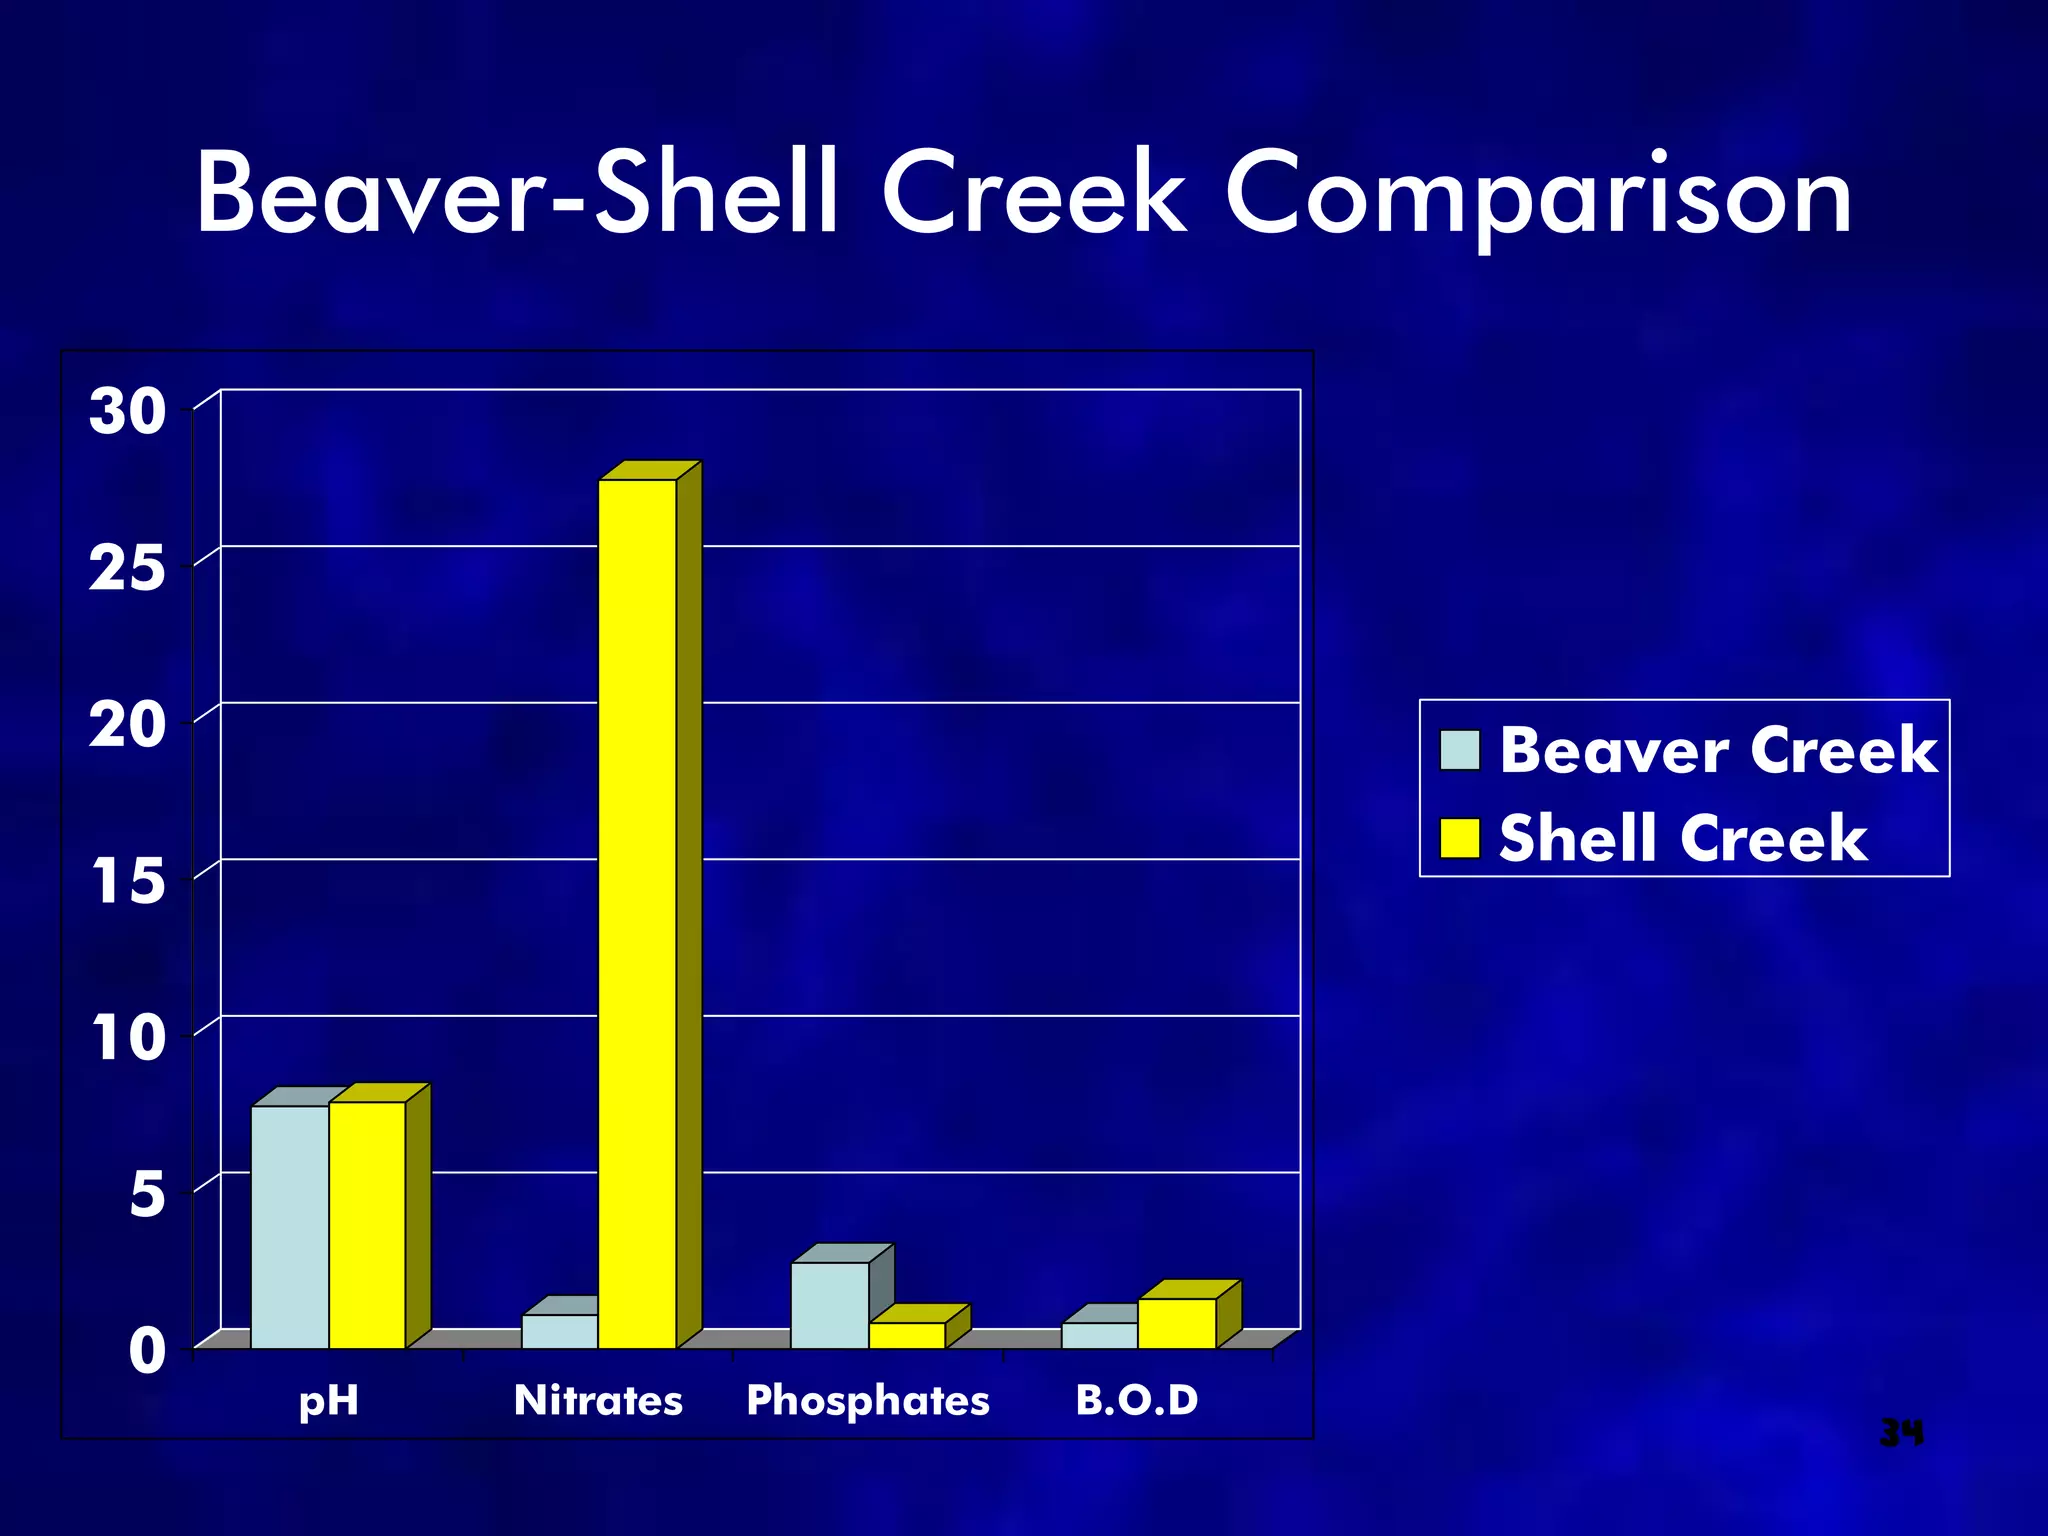
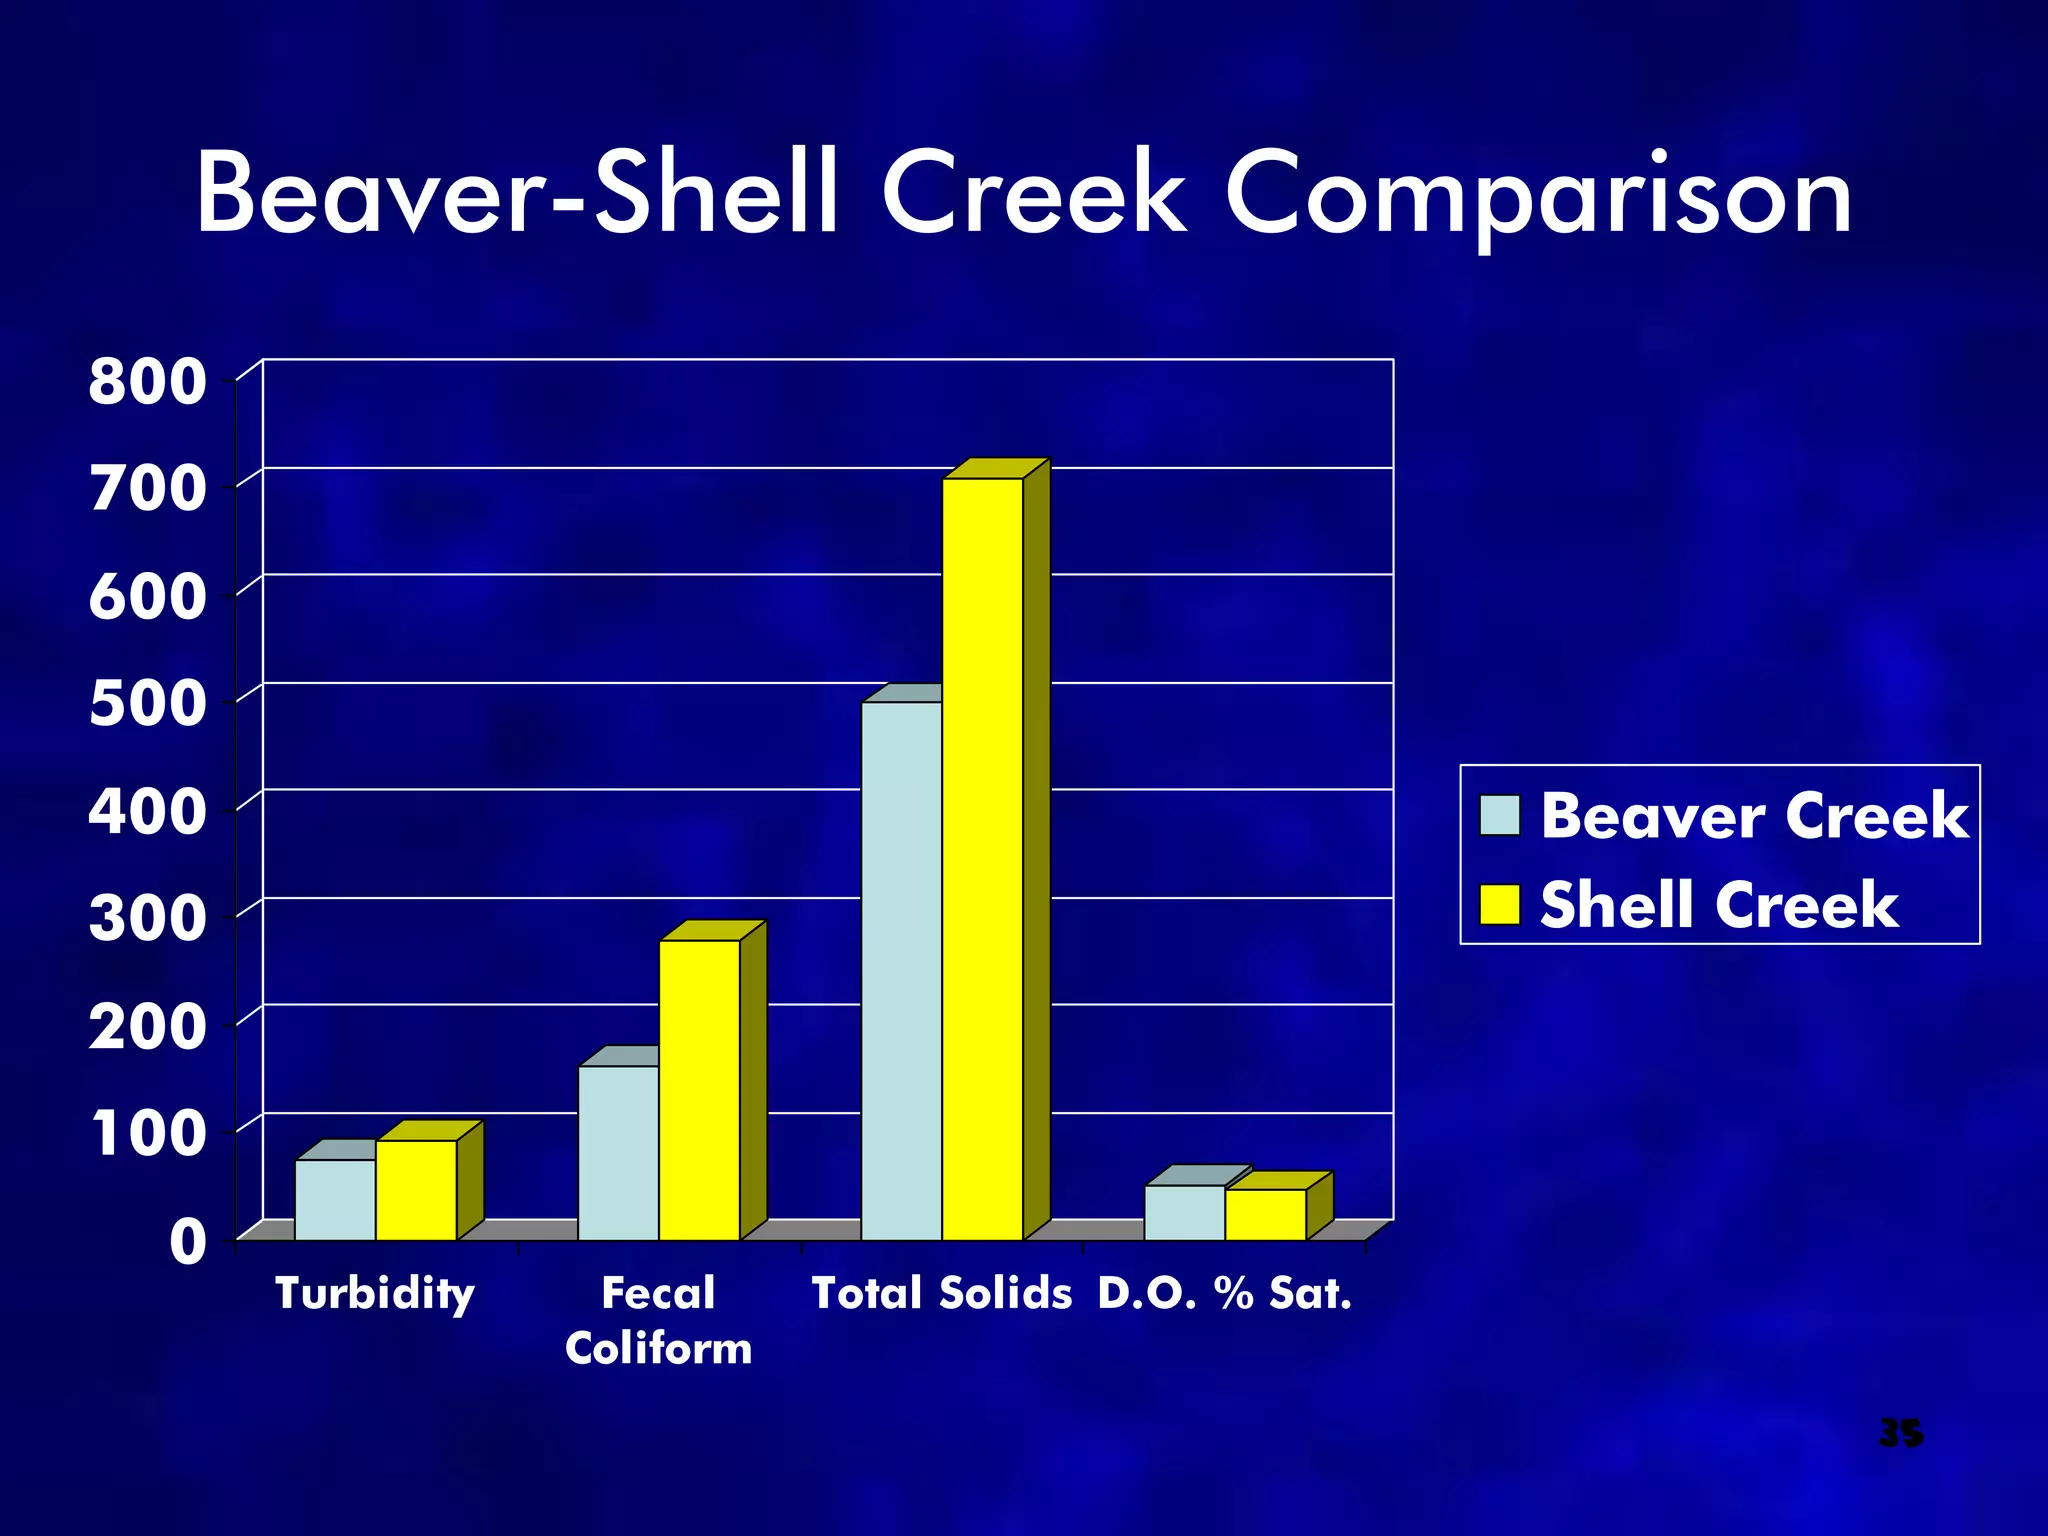
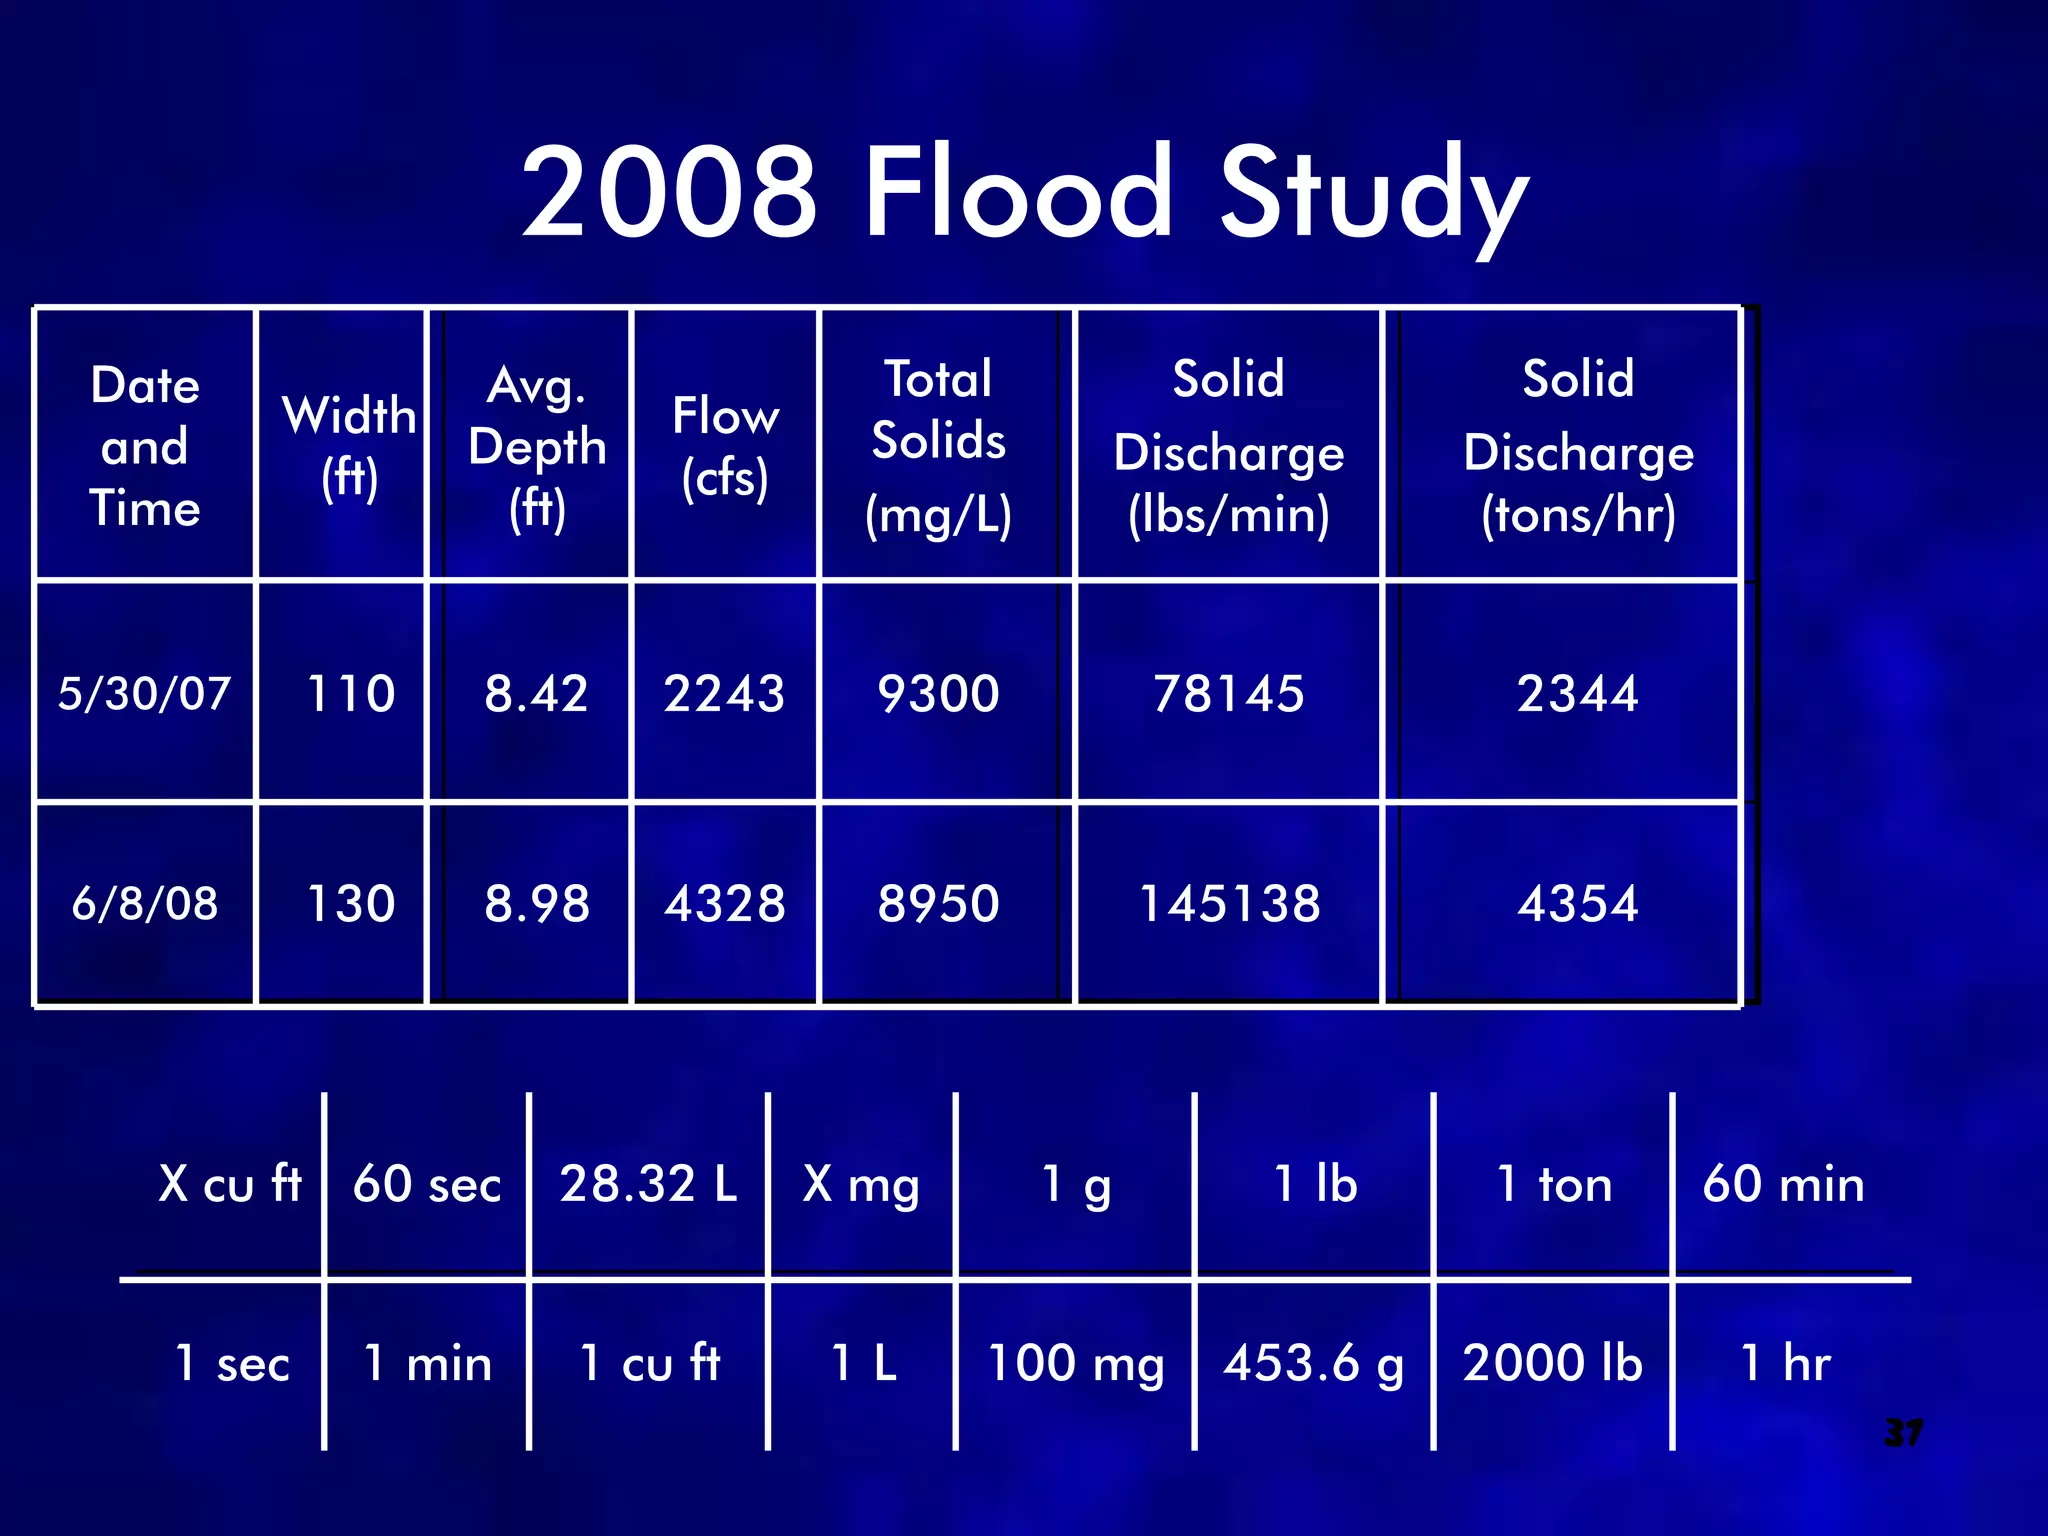
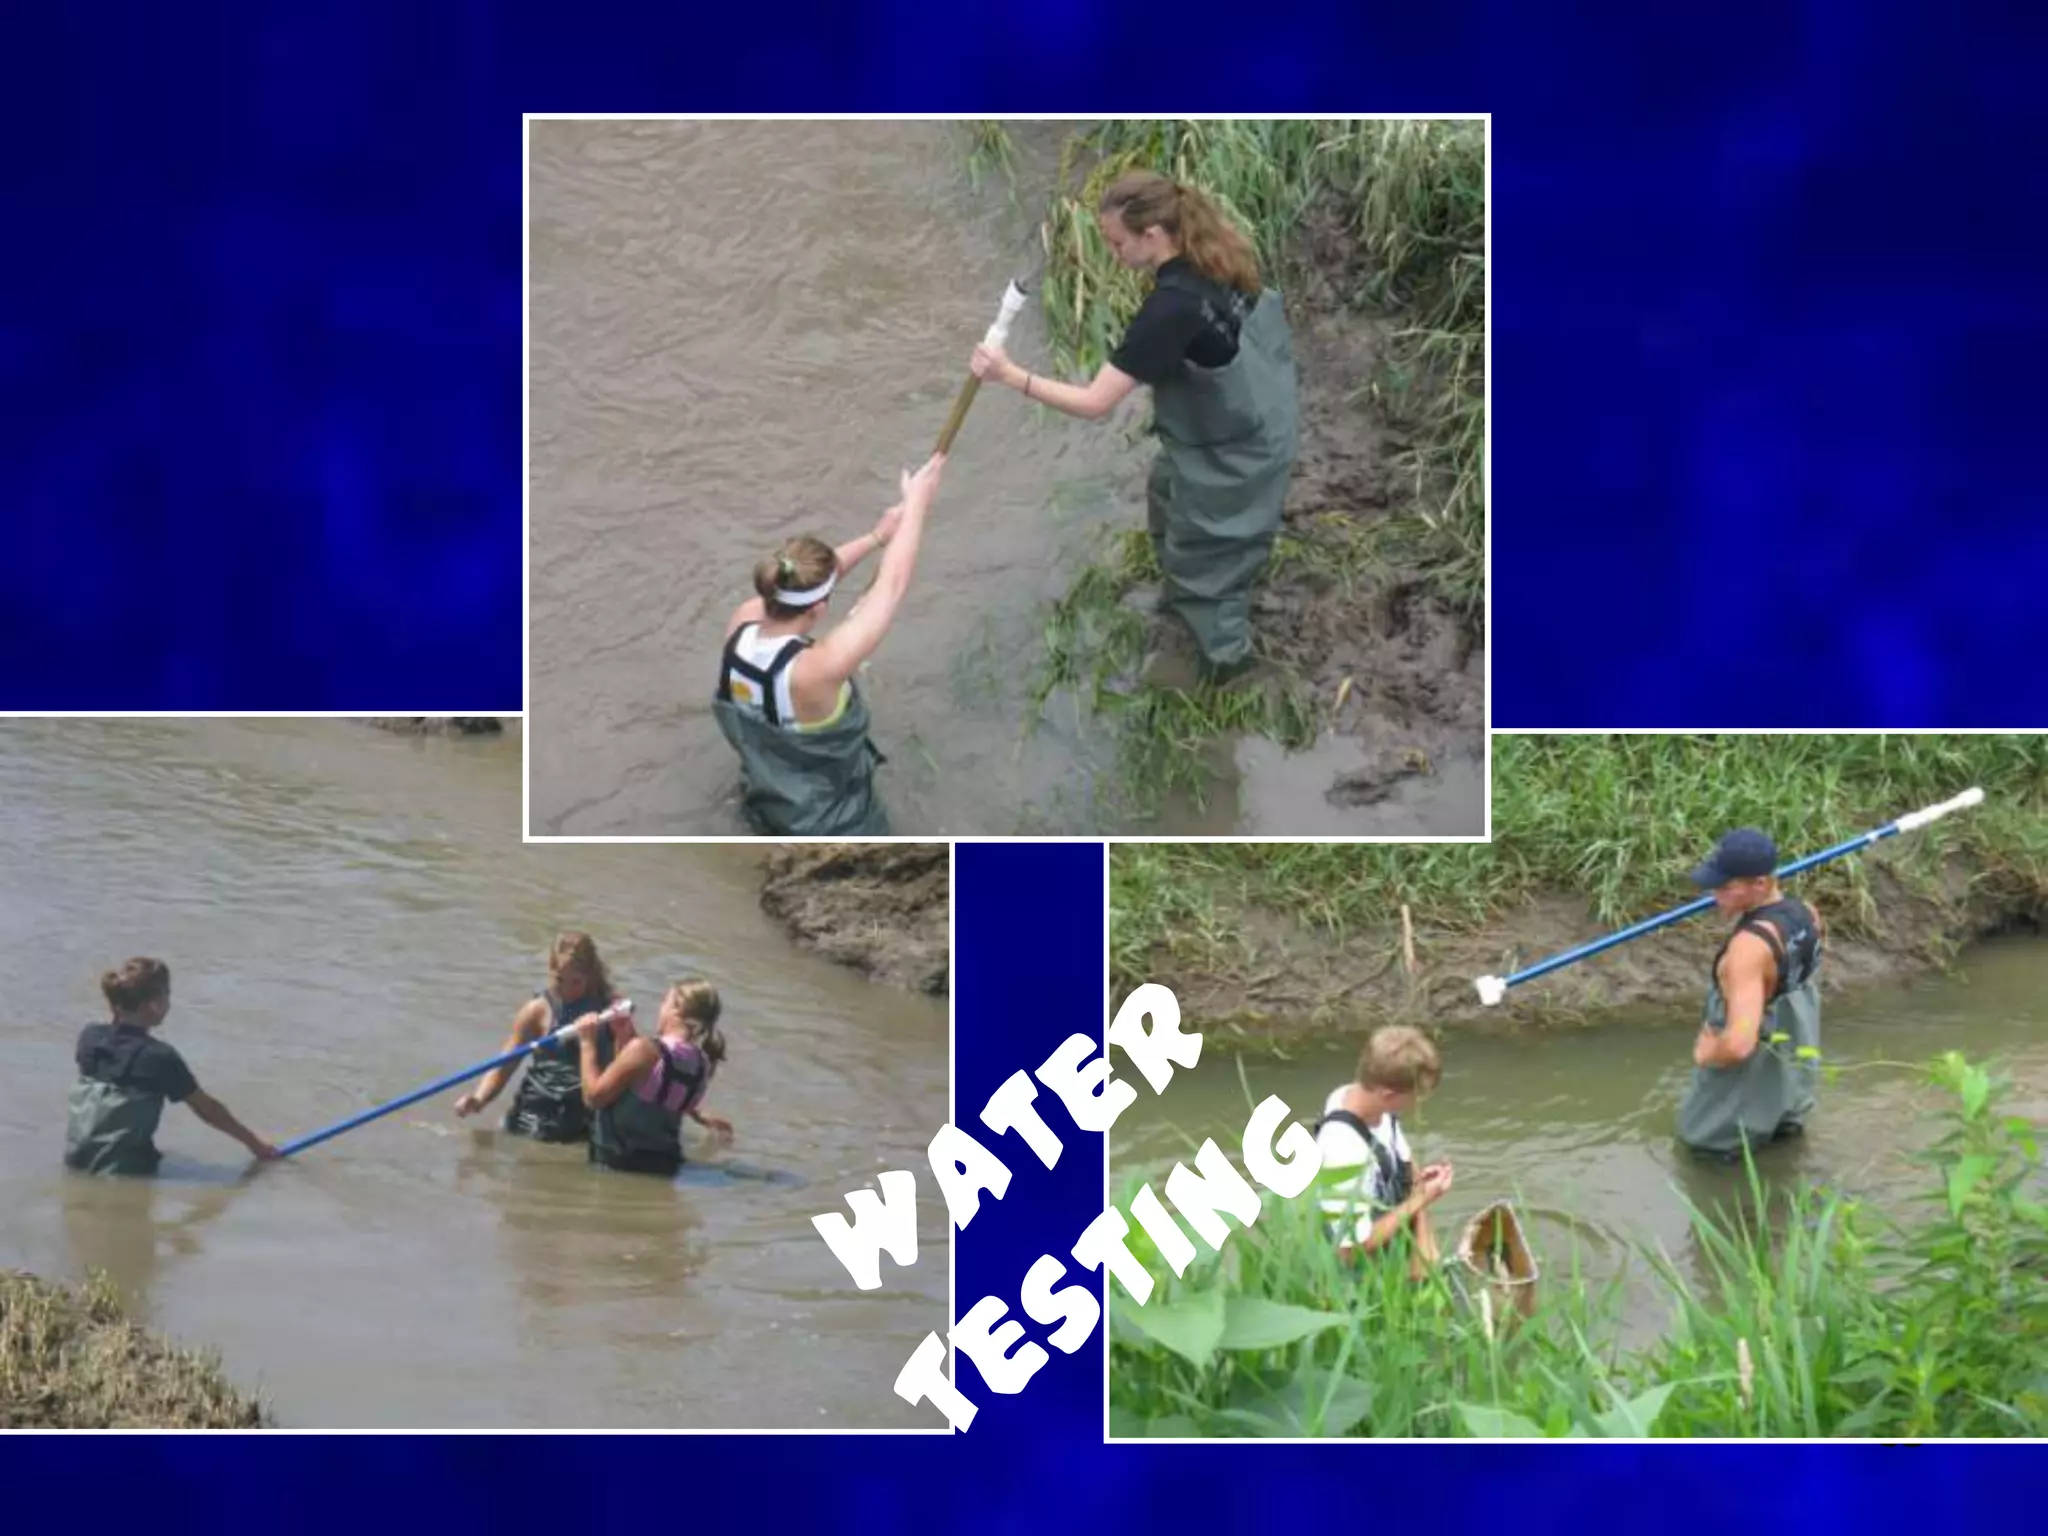
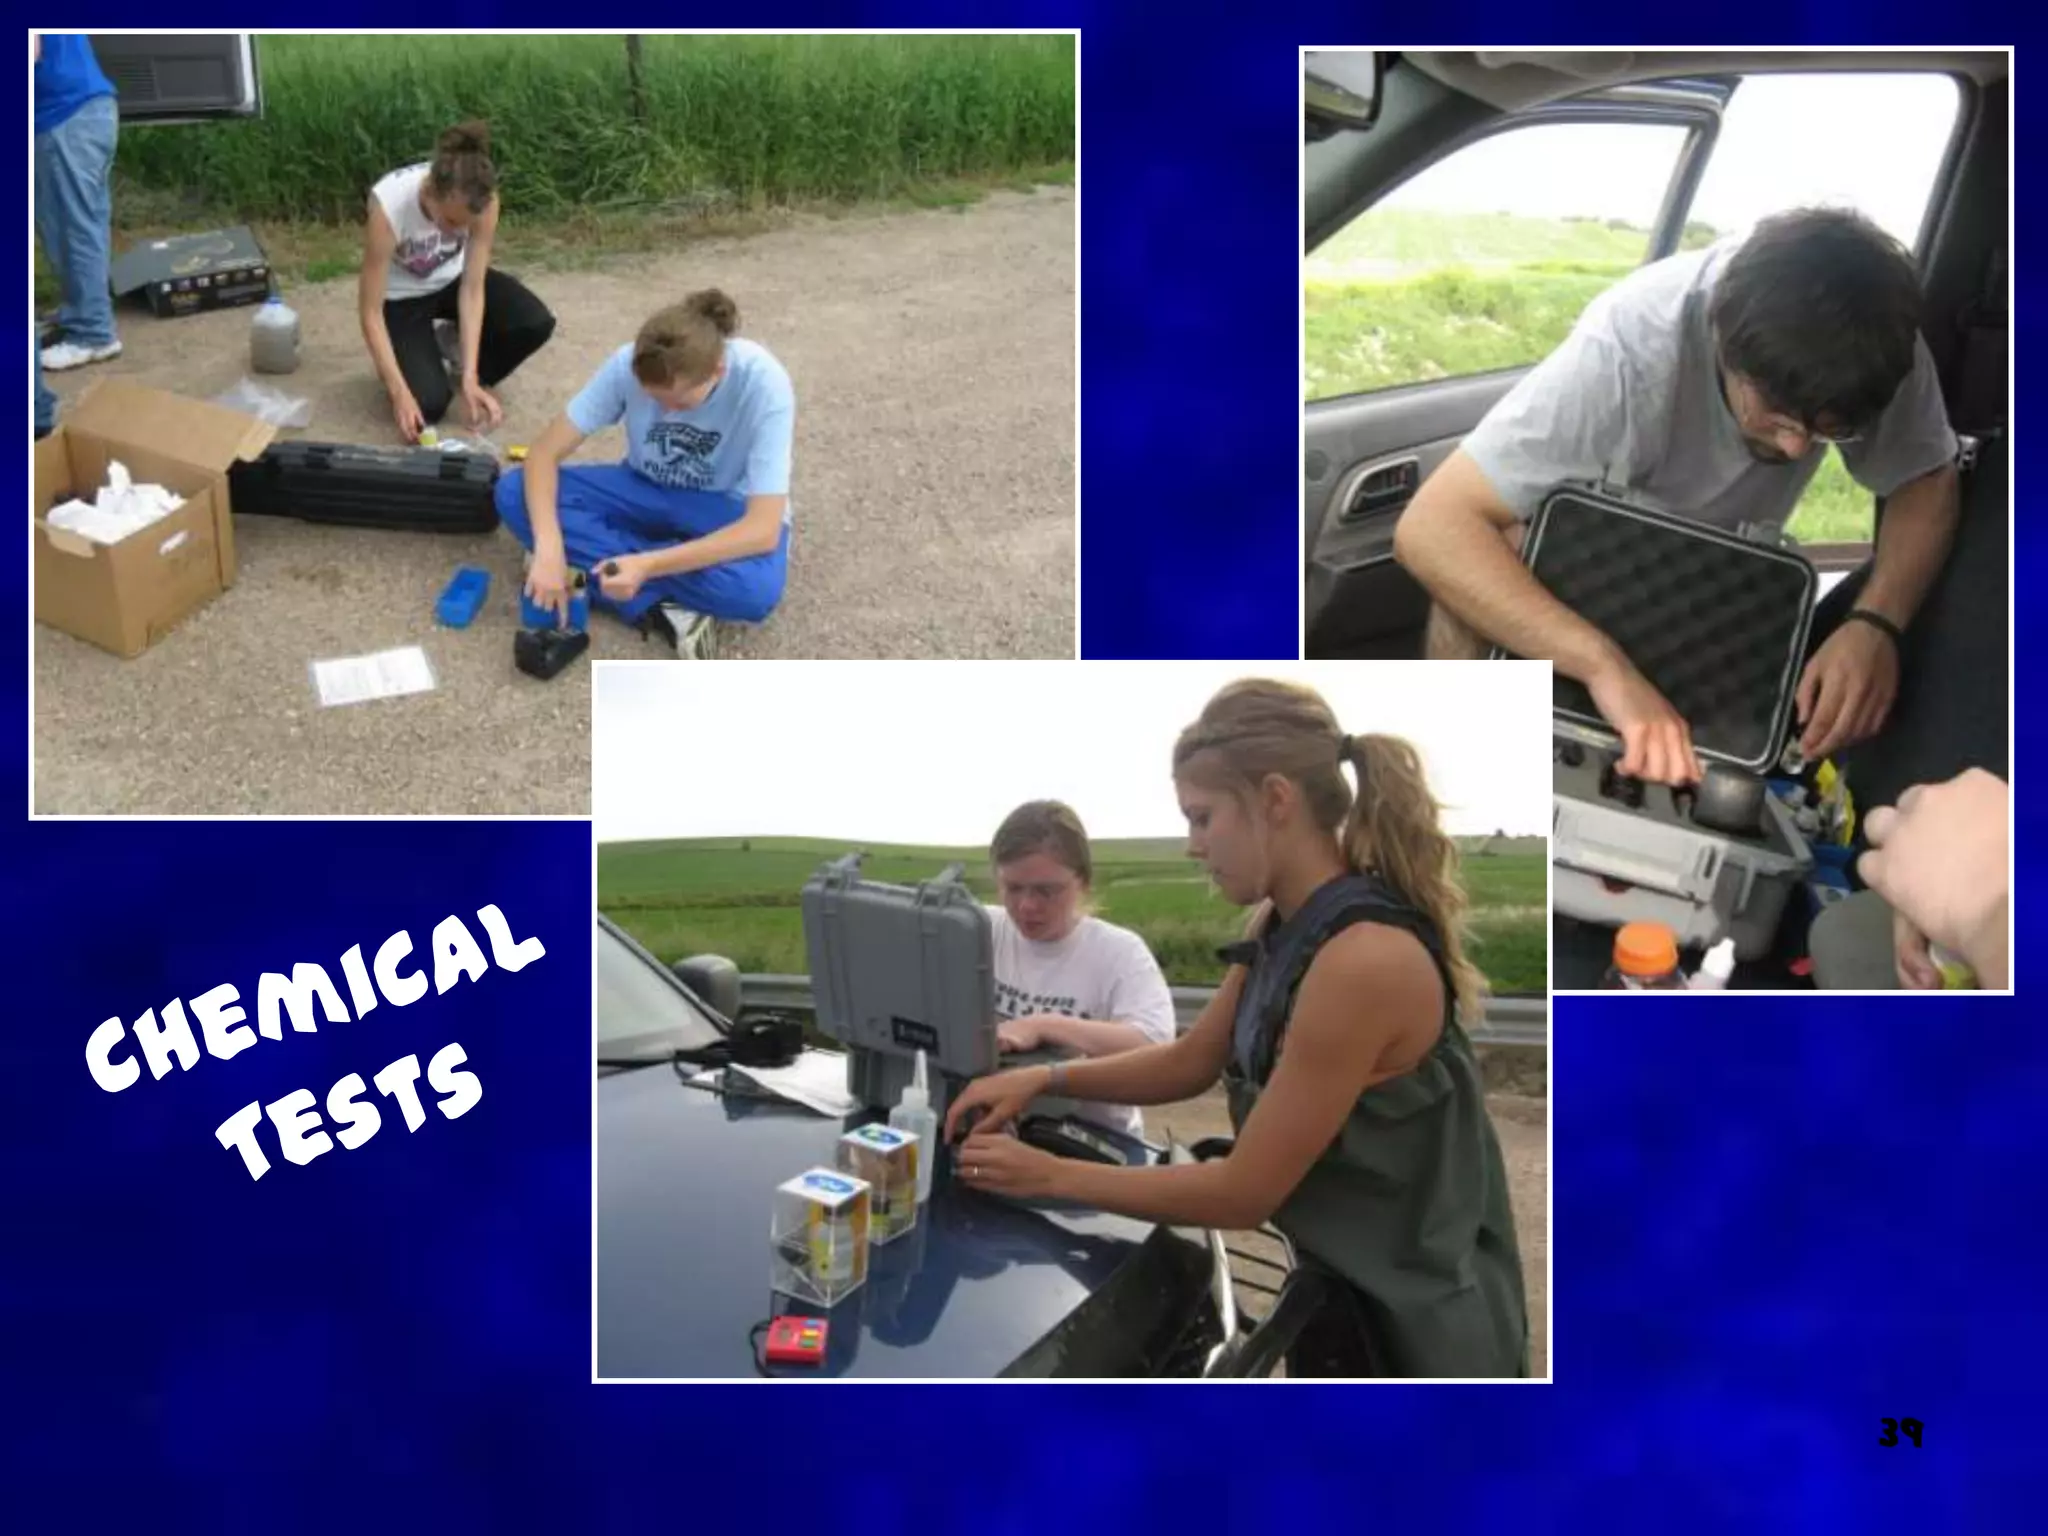
SlideShare a Scribd company logo
1
2008 Shell Creek
          Watershed Study
Advisors – Mark Seier & Suzy Goedeken

Researchers – Sheila O’Brien, Brett Roberg, Jessica
Boschen, Sean Farrier, Ann O’Brien, Lynzee Pieke, Mandy
Anderson, Alyshia Nelson, Jordan Nelson, Jesse Knust,
Luke Gasper, Darrek Schmidt, Jonathon Dohmen, Tim
Wiese, Olivia Wiese, Jake Kaufman, Katie O’Brien, Mark
O’Brien, April Ramaekers, Aubrey Strong, Audrey
Wondercheck, Greg Roberg
                                                     2
Shell Creek and Loseke-Taylor Creek Watersheds
             (with Township-Range Labels)
     Lower Platte North Natural Resources District


                6


                                                     3
Site 1


         4
Site 2


         5
Site 3


         6
Site 4


         7
Site 6


         8
Site 5


         9
W.Q.I.
• The Water Quality Index was developed by the
  National Sanitation Foundation as a standard
  system to compare different bodies of water.
• To determine the WQI, a series of nine tests
  were performed. These tests were: dissolved
  oxygen, fecal coliform, pH, Biological Oxygen
  Demand (BOD), temperature, total phosphate,
  nitrates, turbidity, and total solids. We also did
  a water discharge test which we use to
  measure the flow of the creek in cubic feet per
  second.                                           10
• After the tests are completed, the WQI for each
  section of the creek can be computed.
• To formulate the WQI, we first computed Q-
  values.
• We multiply this number by a weighting factor,
  which provides a measure of the relative
  importance of each test to overall water quality.
• The water quality index ranges from zero to 100.
      - 0 - 25 is very bad
      - 25 - 50 is bad
      - 50 - 70 is medium
      - 70 - 90 is good
      - 90 - 100 is excellent
• The bio-indicator tests weren’t part of W.Q.I., but
  did give us a water quality rating.
                                                        11
Sample W.Q.I. Curve Chart


                            12
Sample W.Q.I. Form
                                                 W e ig hting
                      Te s t R e s ults Q -value   Fac tor      T o ta l
       DO                % s at.                    0 .1 7
Fe c al C olifor m    c ol/1 0 0 mL                 0 .1 6
       pH                 units                     0 .1 1
      BOD                 mg /L                     0 .1 1
 Te mpe r atur e      c hang e in C                 0 .1
Total P hos phate         mg /L                     0 .1
    N itr ate s           mg /L                     0 .1
   Tur bidity             J TU                      0 .0 8
  Total S olids           mg /L                     0 .0 7


                     Overall Water Quality Index ___                  13
2008 Precipitation

         12
         10
         8
Inches


         6
         4
         2
         0
              May        June        July   August

                          Rainfall
                                                     14
pH


           8.4

           8.1
                                                         Site   1
           7.8                                           Site   2
pH Level


           7.5                                           Site   3
                                                         Site   4
           7.2
                                                         Site   5
           6.9                                           Site   6

           6.6
           6.3
                 June 3   June 17   July 23   August 5
                            & 18     &24
                                                          15
                                     Date
Change in Water Temperature

                  2.5

                    2

                  1.5
Degrees Celcius


                                                                               Site   1
                                                                               Site   2
                    1
                                                                               Site   3
                                                                               Site   4
                  0.5
                                                                               Site   5
                    0                                                          Site   6
                            June 3     June 17 &    July 23 &    August 5
                  -0.5                    18            24

                   -1
                                                Date

                         The higher the change, the worse the water quality.          16
Total Solids

       1800
       1600
       1400
                                                                 Site   1
       1200                                                      Site   2
       1000
mg/L


                                                                 Site   3
        800                                                      Site   4
        600                                                      Site   5
        400                                                      Site   6

        200
         0
               June 3    June 17 &   July 23 &    August 5
                            18           24
                                  Date

         The higher the concentration, the worse the water quality.     17
Fecal Coliform


                 18
Fecal Coliform

                  1400

                  1200
colonies/100 mL


                  1000                                               Site   1
                                                                     Site   2
                   800                                               Site   3
                   600                                               Site   4
                                                                     Site   5
                   400                                               Site   6
                   200

                    0
                         June 3   June 17 &   July 23 &   August 5
                                     18           24
                                         Date
                                                                            19
Flow

                        90
                        80
Cubic feet per second


                        70
                                                                         Site   1
                        60                                               Site   2
                        50                                               Site   3
                        40                                               Site   4
                        30                                               Site   5
                        20                                               Site   6

                        10
                         0
                             June 3   June 17 &   July 23 &   August 5
                                         18           24
                                             Date

                                                                                    20
Turbidity

        500
        450
        400
        350                                               Site   1
                                                          Site   2
        300
                                                          Site   3
JTU's


        250
                                                          Site   4
        200
                                                          Site   5
        150
                                                          Site   6
        100
         50
          0
              June 3   June 17 &   July 23 &   August 5
                          18           24
                              Date
                                                                     21
Dissolved Oxygen

               100
                90
                80
                70                                               Site   1
% Saturation


                                                                 Site   2
                60
                                                                 Site   3
                50
                                                                 Site   4
                40
                                                                 Site   5
                30
                                                                 Site   6
                20
                10
                 0
                     June 3   June 17 &   July 23 &   August 5
                                 18           24
                                     Date
                                                                            22
5 Day Biological Oxygen Demand

       5
      4.5
        4
                                                                  Site   1
      3.5
                                                                  Site   2
       3
                                                                  Site   3
ppm


      2.5
                                                                  Site   4
        2
                                                                  Site   5
      1.5
                                                                  Site   6
       1
      0.5
        0
             June 3     June 17 &    July 23 &   August 5
                           18            24
                                 Date

            The higher the change, the worse the water quality.              23
Nitrates

      70

      60

      50                                               Site   1
                                                       Site   2
      40                                               Site   3
ppm


      30                                               Site   4
                                                       Site   5
      20                                               Site   6
      10

       0
           June 3   June 17 &   July 23 &   August 5
                       18           24
                           Date
                                                                  24
Phosphates

      2.5


       2
                                                       Site   1
                                                       Site   2
      1.5
                                                       Site   3
ppm


                                                       Site   4
       1
                                                       Site   5
                                                       Site   6
      0.5


       0
            June 3   June 17&   July 23 &   August 5
                        18          24
                            Date

                                                                  25
WQI Averages by Site

                                                                       Good
      70


      65

      60                                                               Medium
WQI


      55

      50
                                                                       Bad
      45
           Site 1    Site 2     Site 3   Site 4     Site 6    Site 5

                2003 Averages   2004 Averages     2005 Averages
                2006 Averages   2007 Averages     2008 Averages
                                                                         26
WQI Averages by Date
                                                              Good
      70

      65

      60                                                      Medium
WQI


      55

      50
                                                              Bad
      45
           May          June           July         August
                               Month

            2003 Averages   2004 Averages     2005 Averages
            2006 Averages   2007 Averages     2008 Averages

                                                                27
2003 - 2008 Chemical Test Average Comparisons

30

25

20

15                                                         2003 Averages
                                                           2004 Averages
10                                                         2005 Averages
                                                           2006 Averages
5
                                                           2007 Averages
0                                                          2008 Averages
            pH


                                            .
                       s
       ge


                                  es


                                                      p.
                                          .D
                        e


                                                     m
                     at


                                  at
     ar


                                        .O


                                                   Te
                 itr


                                ph
   ch


                                       B
                 N


                              os
 is


                                                in
D


                            Ph


                                               e
                                             ng
                                           ha


                       Chemical Test
                                          C


                                                                     28
2003 - 2008 Chemical Test Average Comparisons


1200
                *2006 Fecal Coliform
1000            Average 8,058 col/100 mL

800                                                              2003 Averages
                                                                 2004 Averages
600                                                              2005 Averages
                                                                 2006 Averages
400                                                              2007 Averages
                                                                 2008 Averages
200

  0
       D.O. % Sat.   Turbidity   Fecal Coliform   Total Solids
                                                                         29
                         Chemical Test
Chemical Test Conclusions
• Fecal coliform readings still very
  sporadic
• Dissolved Oxygen still very low
• Nitrates very high this year
• Overall water quality lower this year
  probably due to increased nitrates
• Discharge up this year but turbidity is
  down
                                            30
Macro Invertebrates

Sensitive         Somewhat Sensitive   Tolerant


                                            31
Sample Bio-Indicator Data Form


                            32
Beaver-Shell Creek
                    WQI Comparison
      70
      60
      50
      40                                                 Beaver Creek
WQI                                                      Average WQI
                                                         Shell Creek
      30                                                 Average WQI
      20
      10
      0
           Early   Late June   July   August   Summer
           June                                Average            33
Beaver-Shell Creek Comparison
30

25

20                                         Beaver Creek
                                           Shell Creek
15

10

5

0
      pH   Nitrates   Phosphates   B.O.D
                                                     34
Beaver-Shell Creek Comparison
800
700
600
500
400                                                     Beaver Creek
300                                                     Shell Creek
200
100
  0
      Turbidity    Fecal     Total Solids D.O. % Sat.
                  Coliform
                                                                 35
2008 Flood Study


                   36
2008 Flood Study
 Date            Avg.               Total        Solid          Solid
          Width          Flow       Solids
 and            Depth                         Discharge       Discharge
           (ft)          (cfs)
 Time             (ft)             (mg/L)     (lbs/min)       (tons/hr)


5/30/07     110   8.42   2243      9300           78145         2344


6/8/08      130   8.98   4328      8950           145138        4354


    X cu ft 60 sec   28.32 L     X mg        1g       1 lb     1 ton      60 min


    1 sec    1 min   1 cu ft     1L     100 mg      453.6 g   2000 lb      1 hr
                                                                                   37
38
39
40
Website
• http://newman.esu8.org/project.html
                  OR
      • http://newman.esu8.org/
         • Click “Our Students”
        • Click “Student Projects”
      • Click “Watershed Project”
  • You can see our data and further
   information concerning this project,
             including pictures.          41
42
Thank You To:
 • Lower Platte North Natural
       Resource District

      • PrairieLand RC&D

• Natural Resource Conservation
             Service

  • Nebraska Department of
     Environmental Quality

   • Shell Creek Watershed        43
      Improvement Group

More Related Content

Similar to NG Shell Creek Data Powerpoint 2008

NG Shell Creek Data Powerpoint 2003
NG Shell Creek Data Powerpoint 2003NG Shell Creek Data Powerpoint 2003
NG Shell Creek Data Powerpoint 2003
ShellCreekWatershed
 
NG Shell Creek Data Powerpoint 2006
NG Shell Creek Data Powerpoint 2006NG Shell Creek Data Powerpoint 2006
NG Shell Creek Data Powerpoint 2006
ShellCreekWatershed
 
NG Shell Creek Data Powerpoint 2005
NG Shell Creek Data Powerpoint 2005NG Shell Creek Data Powerpoint 2005
NG Shell Creek Data Powerpoint 2005
ShellCreekWatershed
 
NG Shell Creek Data Powerpoint 2002
NG Shell Creek Data Powerpoint 2002NG Shell Creek Data Powerpoint 2002
NG Shell Creek Data Powerpoint 2002
ShellCreekWatershed
 
Plants water&soil
Plants water&soilPlants water&soil
Plants water&soilewaszolek
 
Powerpoint 2017 shell creek
Powerpoint 2017 shell creekPowerpoint 2017 shell creek
Powerpoint 2017 shell creek
ShellCreekWatershed
 
Monitoring of Toxin-Producing Cyanobacteria
Monitoring of Toxin-Producing Cyanobacteria Monitoring of Toxin-Producing Cyanobacteria
Monitoring of Toxin-Producing Cyanobacteria
Ohio Environmental Council
 
Basics of Soil Fertility for Urban (and Non-Urban) Growers
Basics of Soil Fertility for Urban (and Non-Urban) GrowersBasics of Soil Fertility for Urban (and Non-Urban) Growers
Basics of Soil Fertility for Urban (and Non-Urban) Growers
Community and Regional Food Systems
 

Similar to NG Shell Creek Data Powerpoint 2008 (8)

NG Shell Creek Data Powerpoint 2003
NG Shell Creek Data Powerpoint 2003NG Shell Creek Data Powerpoint 2003
NG Shell Creek Data Powerpoint 2003
 
NG Shell Creek Data Powerpoint 2006
NG Shell Creek Data Powerpoint 2006NG Shell Creek Data Powerpoint 2006
NG Shell Creek Data Powerpoint 2006
 
NG Shell Creek Data Powerpoint 2005
NG Shell Creek Data Powerpoint 2005NG Shell Creek Data Powerpoint 2005
NG Shell Creek Data Powerpoint 2005
 
NG Shell Creek Data Powerpoint 2002
NG Shell Creek Data Powerpoint 2002NG Shell Creek Data Powerpoint 2002
NG Shell Creek Data Powerpoint 2002
 
Plants water&soil
Plants water&soilPlants water&soil
Plants water&soil
 
Powerpoint 2017 shell creek
Powerpoint 2017 shell creekPowerpoint 2017 shell creek
Powerpoint 2017 shell creek
 
Monitoring of Toxin-Producing Cyanobacteria
Monitoring of Toxin-Producing Cyanobacteria Monitoring of Toxin-Producing Cyanobacteria
Monitoring of Toxin-Producing Cyanobacteria
 
Basics of Soil Fertility for Urban (and Non-Urban) Growers
Basics of Soil Fertility for Urban (and Non-Urban) GrowersBasics of Soil Fertility for Urban (and Non-Urban) Growers
Basics of Soil Fertility for Urban (and Non-Urban) Growers
 

Recently uploaded

Biological Screening of Herbal Drugs in detailed.
Biological Screening of Herbal Drugs in detailed.Biological Screening of Herbal Drugs in detailed.
Biological Screening of Herbal Drugs in detailed.
Ashokrao Mane college of Pharmacy Peth-Vadgaon
 
Introduction to AI for Nonprofits with Tapp Network
Introduction to AI for Nonprofits with Tapp NetworkIntroduction to AI for Nonprofits with Tapp Network
Introduction to AI for Nonprofits with Tapp Network
TechSoup
 
Unit 2- Research Aptitude (UGC NET Paper I).pdf
Unit 2- Research Aptitude (UGC NET Paper I).pdfUnit 2- Research Aptitude (UGC NET Paper I).pdf
Unit 2- Research Aptitude (UGC NET Paper I).pdf
Thiyagu K
 
Operation Blue Star - Saka Neela Tara
Operation Blue Star   -  Saka Neela TaraOperation Blue Star   -  Saka Neela Tara
Operation Blue Star - Saka Neela Tara
Balvir Singh
 
Thesis Statement for students diagnonsed withADHD.ppt
Thesis Statement for students diagnonsed withADHD.pptThesis Statement for students diagnonsed withADHD.ppt
Thesis Statement for students diagnonsed withADHD.ppt
EverAndrsGuerraGuerr
 
"Protectable subject matters, Protection in biotechnology, Protection of othe...
"Protectable subject matters, Protection in biotechnology, Protection of othe..."Protectable subject matters, Protection in biotechnology, Protection of othe...
"Protectable subject matters, Protection in biotechnology, Protection of othe...
SACHIN R KONDAGURI
 
Acetabularia Information For Class 9 .docx
Acetabularia Information For Class 9  .docxAcetabularia Information For Class 9  .docx
Acetabularia Information For Class 9 .docx
vaibhavrinwa19
 
Executive Directors Chat Leveraging AI for Diversity, Equity, and Inclusion
Executive Directors Chat  Leveraging AI for Diversity, Equity, and InclusionExecutive Directors Chat  Leveraging AI for Diversity, Equity, and Inclusion
Executive Directors Chat Leveraging AI for Diversity, Equity, and Inclusion
TechSoup
 
Chapter 3 - Islamic Banking Products and Services.pptx
Chapter 3 - Islamic Banking Products and Services.pptxChapter 3 - Islamic Banking Products and Services.pptx
Chapter 3 - Islamic Banking Products and Services.pptx
Mohd Adib Abd Muin, Senior Lecturer at Universiti Utara Malaysia
 
Synthetic Fiber Construction in lab .pptx
Synthetic Fiber Construction in lab .pptxSynthetic Fiber Construction in lab .pptx
Synthetic Fiber Construction in lab .pptx
Pavel ( NSTU)
 
Digital Artifact 1 - 10VCD Environments Unit
Digital Artifact 1 - 10VCD Environments UnitDigital Artifact 1 - 10VCD Environments Unit
Digital Artifact 1 - 10VCD Environments Unit
chanes7
 
The Diamonds of 2023-2024 in the IGRA collection
The Diamonds of 2023-2024 in the IGRA collectionThe Diamonds of 2023-2024 in the IGRA collection
The Diamonds of 2023-2024 in the IGRA collection
Israel Genealogy Research Association
 
A Survey of Techniques for Maximizing LLM Performance.pptx
A Survey of Techniques for Maximizing LLM Performance.pptxA Survey of Techniques for Maximizing LLM Performance.pptx
A Survey of Techniques for Maximizing LLM Performance.pptx
thanhdowork
 
CACJapan - GROUP Presentation 1- Wk 4.pdf
CACJapan - GROUP Presentation 1- Wk 4.pdfCACJapan - GROUP Presentation 1- Wk 4.pdf
CACJapan - GROUP Presentation 1- Wk 4.pdf
camakaiclarkmusic
 
special B.ed 2nd year old paper_20240531.pdf
special B.ed 2nd year old paper_20240531.pdfspecial B.ed 2nd year old paper_20240531.pdf
special B.ed 2nd year old paper_20240531.pdf
Special education needs
 
STRAND 3 HYGIENIC PRACTICES.pptx GRADE 7 CBC
STRAND 3 HYGIENIC PRACTICES.pptx GRADE 7 CBCSTRAND 3 HYGIENIC PRACTICES.pptx GRADE 7 CBC
STRAND 3 HYGIENIC PRACTICES.pptx GRADE 7 CBC
kimdan468
 
2024.06.01 Introducing a competency framework for languag learning materials ...
2024.06.01 Introducing a competency framework for languag learning materials ...2024.06.01 Introducing a competency framework for languag learning materials ...
2024.06.01 Introducing a competency framework for languag learning materials ...
Sandy Millin
 
1.4 modern child centered education - mahatma gandhi-2.pptx
1.4 modern child centered education - mahatma gandhi-2.pptx1.4 modern child centered education - mahatma gandhi-2.pptx
1.4 modern child centered education - mahatma gandhi-2.pptx
JosvitaDsouza2
 
Best Digital Marketing Institute In NOIDA
Best Digital Marketing Institute In NOIDABest Digital Marketing Institute In NOIDA
Best Digital Marketing Institute In NOIDA
deeptiverma2406
 
Natural birth techniques - Mrs.Akanksha Trivedi Rama University
Natural birth techniques - Mrs.Akanksha Trivedi Rama UniversityNatural birth techniques - Mrs.Akanksha Trivedi Rama University
Natural birth techniques - Mrs.Akanksha Trivedi Rama University
Akanksha trivedi rama nursing college kanpur.
 

Recently uploaded (20)

Biological Screening of Herbal Drugs in detailed.
Biological Screening of Herbal Drugs in detailed.Biological Screening of Herbal Drugs in detailed.
Biological Screening of Herbal Drugs in detailed.
 
Introduction to AI for Nonprofits with Tapp Network
Introduction to AI for Nonprofits with Tapp NetworkIntroduction to AI for Nonprofits with Tapp Network
Introduction to AI for Nonprofits with Tapp Network
 
Unit 2- Research Aptitude (UGC NET Paper I).pdf
Unit 2- Research Aptitude (UGC NET Paper I).pdfUnit 2- Research Aptitude (UGC NET Paper I).pdf
Unit 2- Research Aptitude (UGC NET Paper I).pdf
 
Operation Blue Star - Saka Neela Tara
Operation Blue Star   -  Saka Neela TaraOperation Blue Star   -  Saka Neela Tara
Operation Blue Star - Saka Neela Tara
 
Thesis Statement for students diagnonsed withADHD.ppt
Thesis Statement for students diagnonsed withADHD.pptThesis Statement for students diagnonsed withADHD.ppt
Thesis Statement for students diagnonsed withADHD.ppt
 
"Protectable subject matters, Protection in biotechnology, Protection of othe...
"Protectable subject matters, Protection in biotechnology, Protection of othe..."Protectable subject matters, Protection in biotechnology, Protection of othe...
"Protectable subject matters, Protection in biotechnology, Protection of othe...
 
Acetabularia Information For Class 9 .docx
Acetabularia Information For Class 9  .docxAcetabularia Information For Class 9  .docx
Acetabularia Information For Class 9 .docx
 
Executive Directors Chat Leveraging AI for Diversity, Equity, and Inclusion
Executive Directors Chat  Leveraging AI for Diversity, Equity, and InclusionExecutive Directors Chat  Leveraging AI for Diversity, Equity, and Inclusion
Executive Directors Chat Leveraging AI for Diversity, Equity, and Inclusion
 
Chapter 3 - Islamic Banking Products and Services.pptx
Chapter 3 - Islamic Banking Products and Services.pptxChapter 3 - Islamic Banking Products and Services.pptx
Chapter 3 - Islamic Banking Products and Services.pptx
 
Synthetic Fiber Construction in lab .pptx
Synthetic Fiber Construction in lab .pptxSynthetic Fiber Construction in lab .pptx
Synthetic Fiber Construction in lab .pptx
 
Digital Artifact 1 - 10VCD Environments Unit
Digital Artifact 1 - 10VCD Environments UnitDigital Artifact 1 - 10VCD Environments Unit
Digital Artifact 1 - 10VCD Environments Unit
 
The Diamonds of 2023-2024 in the IGRA collection
The Diamonds of 2023-2024 in the IGRA collectionThe Diamonds of 2023-2024 in the IGRA collection
The Diamonds of 2023-2024 in the IGRA collection
 
A Survey of Techniques for Maximizing LLM Performance.pptx
A Survey of Techniques for Maximizing LLM Performance.pptxA Survey of Techniques for Maximizing LLM Performance.pptx
A Survey of Techniques for Maximizing LLM Performance.pptx
 
CACJapan - GROUP Presentation 1- Wk 4.pdf
CACJapan - GROUP Presentation 1- Wk 4.pdfCACJapan - GROUP Presentation 1- Wk 4.pdf
CACJapan - GROUP Presentation 1- Wk 4.pdf
 
special B.ed 2nd year old paper_20240531.pdf
special B.ed 2nd year old paper_20240531.pdfspecial B.ed 2nd year old paper_20240531.pdf
special B.ed 2nd year old paper_20240531.pdf
 
STRAND 3 HYGIENIC PRACTICES.pptx GRADE 7 CBC
STRAND 3 HYGIENIC PRACTICES.pptx GRADE 7 CBCSTRAND 3 HYGIENIC PRACTICES.pptx GRADE 7 CBC
STRAND 3 HYGIENIC PRACTICES.pptx GRADE 7 CBC
 
2024.06.01 Introducing a competency framework for languag learning materials ...
2024.06.01 Introducing a competency framework for languag learning materials ...2024.06.01 Introducing a competency framework for languag learning materials ...
2024.06.01 Introducing a competency framework for languag learning materials ...
 
1.4 modern child centered education - mahatma gandhi-2.pptx
1.4 modern child centered education - mahatma gandhi-2.pptx1.4 modern child centered education - mahatma gandhi-2.pptx
1.4 modern child centered education - mahatma gandhi-2.pptx
 
Best Digital Marketing Institute In NOIDA
Best Digital Marketing Institute In NOIDABest Digital Marketing Institute In NOIDA
Best Digital Marketing Institute In NOIDA
 
Natural birth techniques - Mrs.Akanksha Trivedi Rama University
Natural birth techniques - Mrs.Akanksha Trivedi Rama UniversityNatural birth techniques - Mrs.Akanksha Trivedi Rama University
Natural birth techniques - Mrs.Akanksha Trivedi Rama University
 

NG Shell Creek Data Powerpoint 2008

  • 1. 1
  • 2. 2008 Shell Creek Watershed Study Advisors – Mark Seier & Suzy Goedeken Researchers – Sheila O’Brien, Brett Roberg, Jessica Boschen, Sean Farrier, Ann O’Brien, Lynzee Pieke, Mandy Anderson, Alyshia Nelson, Jordan Nelson, Jesse Knust, Luke Gasper, Darrek Schmidt, Jonathon Dohmen, Tim Wiese, Olivia Wiese, Jake Kaufman, Katie O’Brien, Mark O’Brien, April Ramaekers, Aubrey Strong, Audrey Wondercheck, Greg Roberg 2
  • 3. Shell Creek and Loseke-Taylor Creek Watersheds (with Township-Range Labels) Lower Platte North Natural Resources District 6 3
  • 4. Site 1 4
  • 5. Site 2 5
  • 6. Site 3 6
  • 7. Site 4 7
  • 8. Site 6 8
  • 9. Site 5 9
  • 10. W.Q.I. • The Water Quality Index was developed by the National Sanitation Foundation as a standard system to compare different bodies of water. • To determine the WQI, a series of nine tests were performed. These tests were: dissolved oxygen, fecal coliform, pH, Biological Oxygen Demand (BOD), temperature, total phosphate, nitrates, turbidity, and total solids. We also did a water discharge test which we use to measure the flow of the creek in cubic feet per second. 10
  • 11. • After the tests are completed, the WQI for each section of the creek can be computed. • To formulate the WQI, we first computed Q- values. • We multiply this number by a weighting factor, which provides a measure of the relative importance of each test to overall water quality. • The water quality index ranges from zero to 100. - 0 - 25 is very bad - 25 - 50 is bad - 50 - 70 is medium - 70 - 90 is good - 90 - 100 is excellent • The bio-indicator tests weren’t part of W.Q.I., but did give us a water quality rating. 11
  • 13. Sample W.Q.I. Form W e ig hting Te s t R e s ults Q -value Fac tor T o ta l DO % s at. 0 .1 7 Fe c al C olifor m c ol/1 0 0 mL 0 .1 6 pH units 0 .1 1 BOD mg /L 0 .1 1 Te mpe r atur e c hang e in C 0 .1 Total P hos phate mg /L 0 .1 N itr ate s mg /L 0 .1 Tur bidity J TU 0 .0 8 Total S olids mg /L 0 .0 7 Overall Water Quality Index ___ 13
  • 14. 2008 Precipitation 12 10 8 Inches 6 4 2 0 May June July August Rainfall 14
  • 15. pH 8.4 8.1 Site 1 7.8 Site 2 pH Level 7.5 Site 3 Site 4 7.2 Site 5 6.9 Site 6 6.6 6.3 June 3 June 17 July 23 August 5 & 18 &24 15 Date
  • 16. Change in Water Temperature 2.5 2 1.5 Degrees Celcius Site 1 Site 2 1 Site 3 Site 4 0.5 Site 5 0 Site 6 June 3 June 17 & July 23 & August 5 -0.5 18 24 -1 Date The higher the change, the worse the water quality. 16
  • 17. Total Solids 1800 1600 1400 Site 1 1200 Site 2 1000 mg/L Site 3 800 Site 4 600 Site 5 400 Site 6 200 0 June 3 June 17 & July 23 & August 5 18 24 Date The higher the concentration, the worse the water quality. 17
  • 19. Fecal Coliform 1400 1200 colonies/100 mL 1000 Site 1 Site 2 800 Site 3 600 Site 4 Site 5 400 Site 6 200 0 June 3 June 17 & July 23 & August 5 18 24 Date 19
  • 20. Flow 90 80 Cubic feet per second 70 Site 1 60 Site 2 50 Site 3 40 Site 4 30 Site 5 20 Site 6 10 0 June 3 June 17 & July 23 & August 5 18 24 Date 20
  • 21. Turbidity 500 450 400 350 Site 1 Site 2 300 Site 3 JTU's 250 Site 4 200 Site 5 150 Site 6 100 50 0 June 3 June 17 & July 23 & August 5 18 24 Date 21
  • 22. Dissolved Oxygen 100 90 80 70 Site 1 % Saturation Site 2 60 Site 3 50 Site 4 40 Site 5 30 Site 6 20 10 0 June 3 June 17 & July 23 & August 5 18 24 Date 22
  • 23. 5 Day Biological Oxygen Demand 5 4.5 4 Site 1 3.5 Site 2 3 Site 3 ppm 2.5 Site 4 2 Site 5 1.5 Site 6 1 0.5 0 June 3 June 17 & July 23 & August 5 18 24 Date The higher the change, the worse the water quality. 23
  • 24. Nitrates 70 60 50 Site 1 Site 2 40 Site 3 ppm 30 Site 4 Site 5 20 Site 6 10 0 June 3 June 17 & July 23 & August 5 18 24 Date 24
  • 25. Phosphates 2.5 2 Site 1 Site 2 1.5 Site 3 ppm Site 4 1 Site 5 Site 6 0.5 0 June 3 June 17& July 23 & August 5 18 24 Date 25
  • 26. WQI Averages by Site Good 70 65 60 Medium WQI 55 50 Bad 45 Site 1 Site 2 Site 3 Site 4 Site 6 Site 5 2003 Averages 2004 Averages 2005 Averages 2006 Averages 2007 Averages 2008 Averages 26
  • 27. WQI Averages by Date Good 70 65 60 Medium WQI 55 50 Bad 45 May June July August Month 2003 Averages 2004 Averages 2005 Averages 2006 Averages 2007 Averages 2008 Averages 27
  • 28. 2003 - 2008 Chemical Test Average Comparisons 30 25 20 15 2003 Averages 2004 Averages 10 2005 Averages 2006 Averages 5 2007 Averages 0 2008 Averages pH . s ge es p. .D e m at at ar .O Te itr ph ch B N os is in D Ph e ng ha Chemical Test C 28
  • 29. 2003 - 2008 Chemical Test Average Comparisons 1200 *2006 Fecal Coliform 1000 Average 8,058 col/100 mL 800 2003 Averages 2004 Averages 600 2005 Averages 2006 Averages 400 2007 Averages 2008 Averages 200 0 D.O. % Sat. Turbidity Fecal Coliform Total Solids 29 Chemical Test
  • 30. Chemical Test Conclusions • Fecal coliform readings still very sporadic • Dissolved Oxygen still very low • Nitrates very high this year • Overall water quality lower this year probably due to increased nitrates • Discharge up this year but turbidity is down 30
  • 31. Macro Invertebrates Sensitive Somewhat Sensitive Tolerant 31
  • 33. Beaver-Shell Creek WQI Comparison 70 60 50 40 Beaver Creek WQI Average WQI Shell Creek 30 Average WQI 20 10 0 Early Late June July August Summer June Average 33
  • 34. Beaver-Shell Creek Comparison 30 25 20 Beaver Creek Shell Creek 15 10 5 0 pH Nitrates Phosphates B.O.D 34
  • 35. Beaver-Shell Creek Comparison 800 700 600 500 400 Beaver Creek 300 Shell Creek 200 100 0 Turbidity Fecal Total Solids D.O. % Sat. Coliform 35
  • 37. 2008 Flood Study Date Avg. Total Solid Solid Width Flow Solids and Depth Discharge Discharge (ft) (cfs) Time (ft) (mg/L) (lbs/min) (tons/hr) 5/30/07 110 8.42 2243 9300 78145 2344 6/8/08 130 8.98 4328 8950 145138 4354 X cu ft 60 sec 28.32 L X mg 1g 1 lb 1 ton 60 min 1 sec 1 min 1 cu ft 1L 100 mg 453.6 g 2000 lb 1 hr 37
  • 38. 38
  • 39. 39
  • 40. 40
  • 41. Website • http://newman.esu8.org/project.html OR • http://newman.esu8.org/ • Click “Our Students” • Click “Student Projects” • Click “Watershed Project” • You can see our data and further information concerning this project, including pictures. 41
  • 42. 42
  • 43. Thank You To: • Lower Platte North Natural Resource District • PrairieLand RC&D • Natural Resource Conservation Service • Nebraska Department of Environmental Quality • Shell Creek Watershed 43 Improvement Group