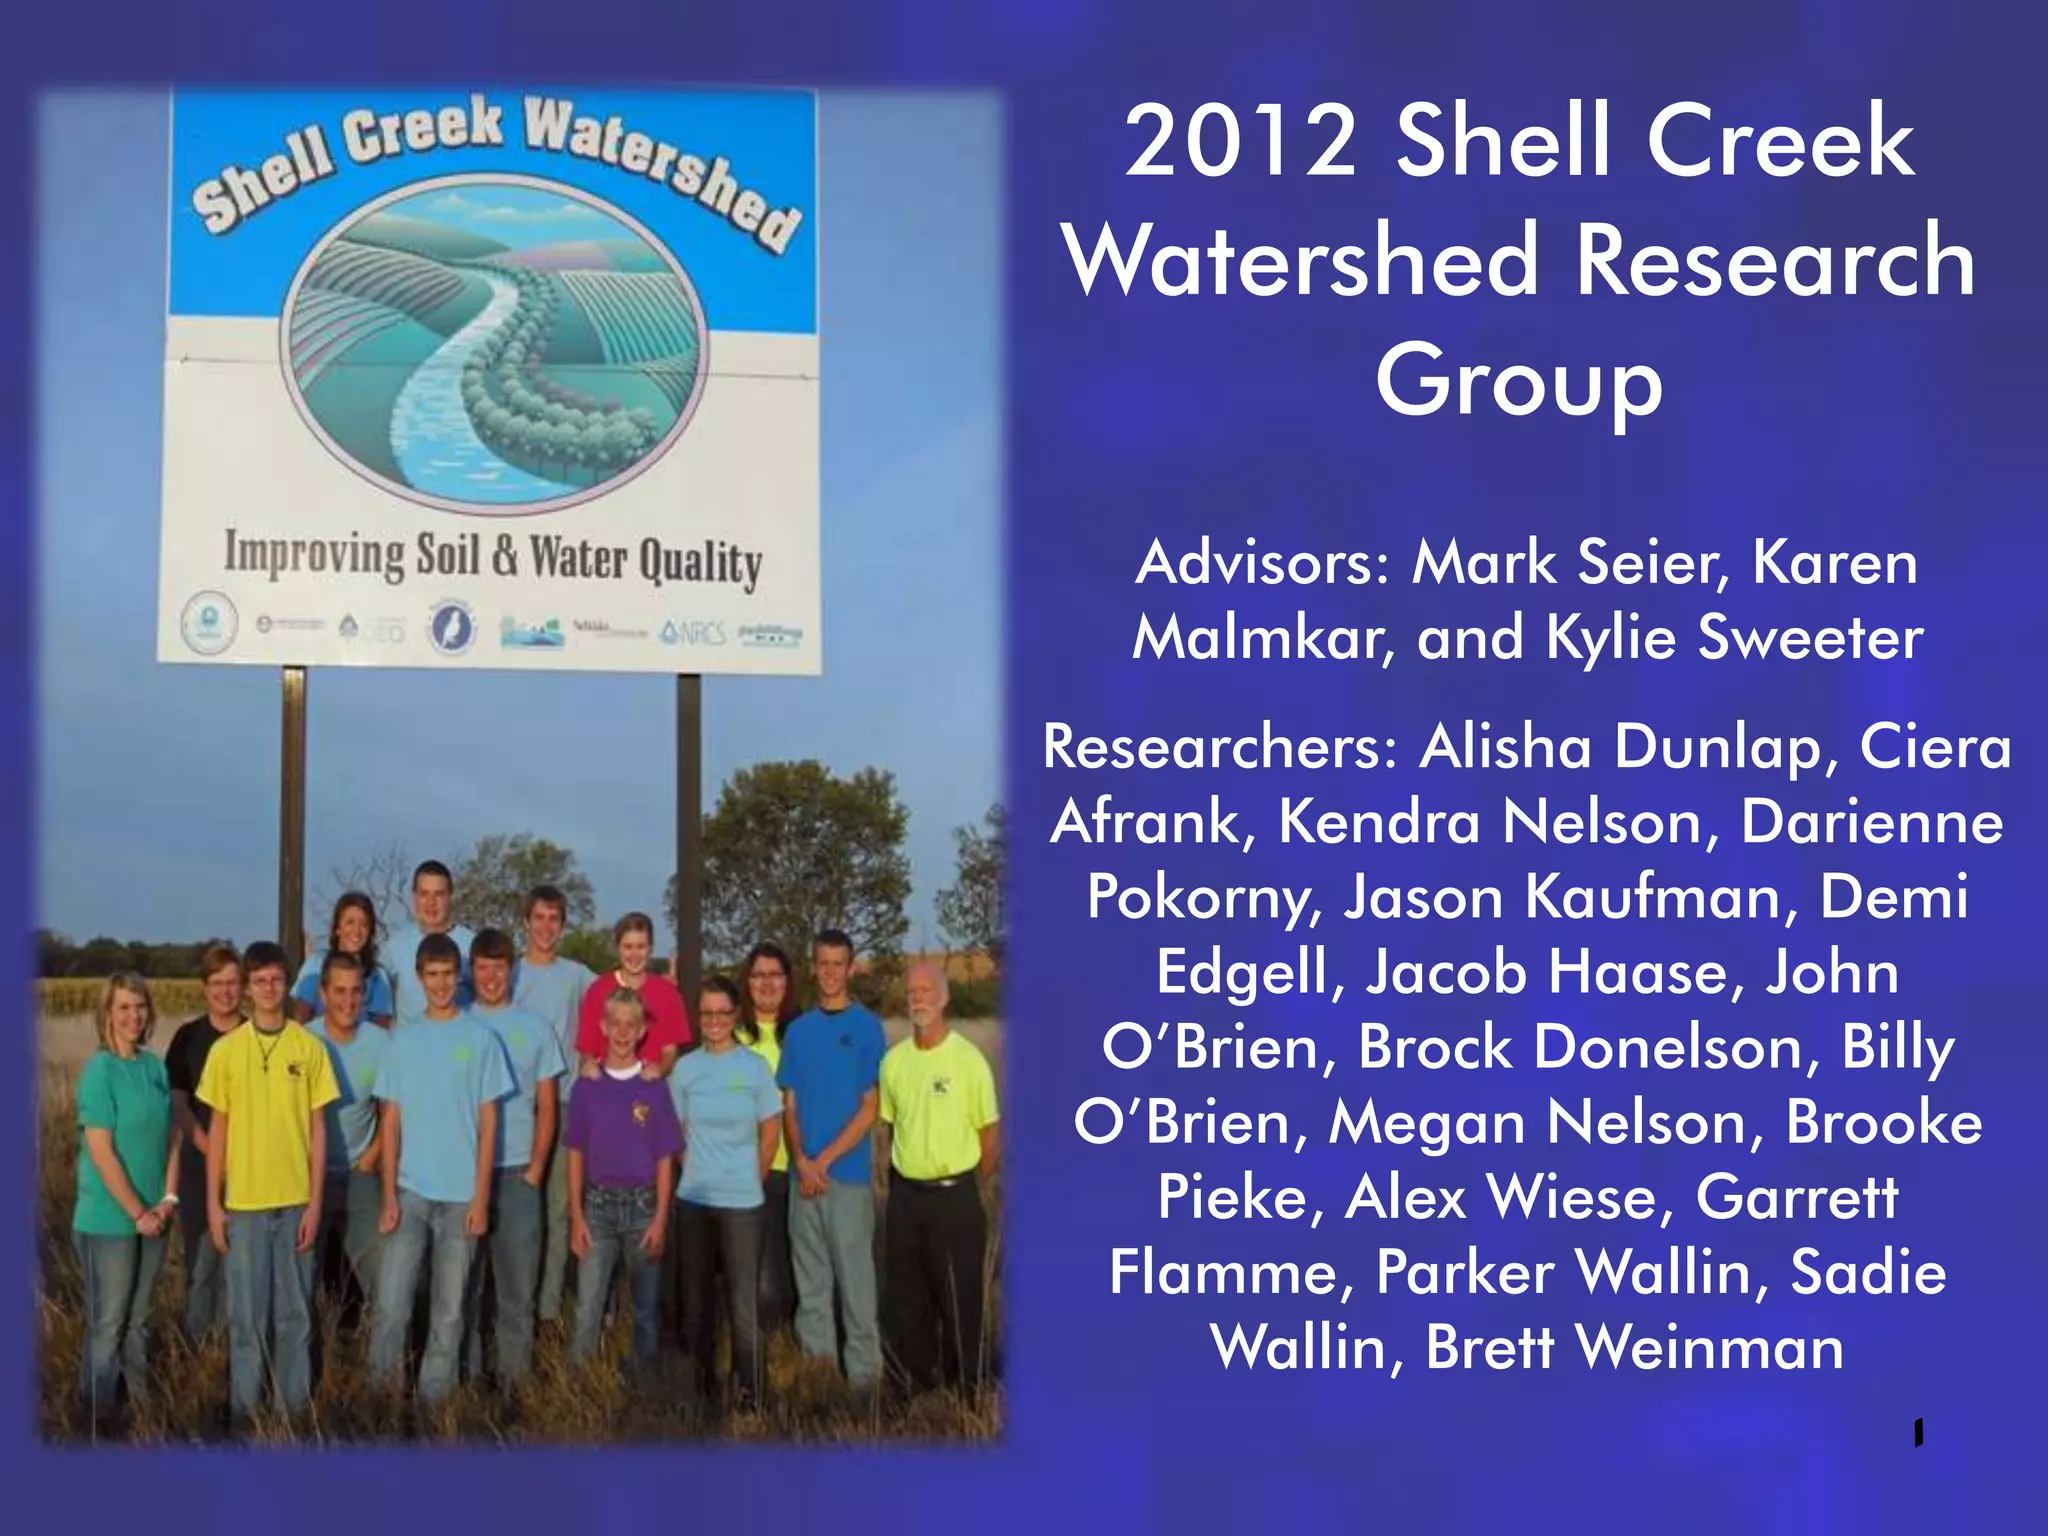
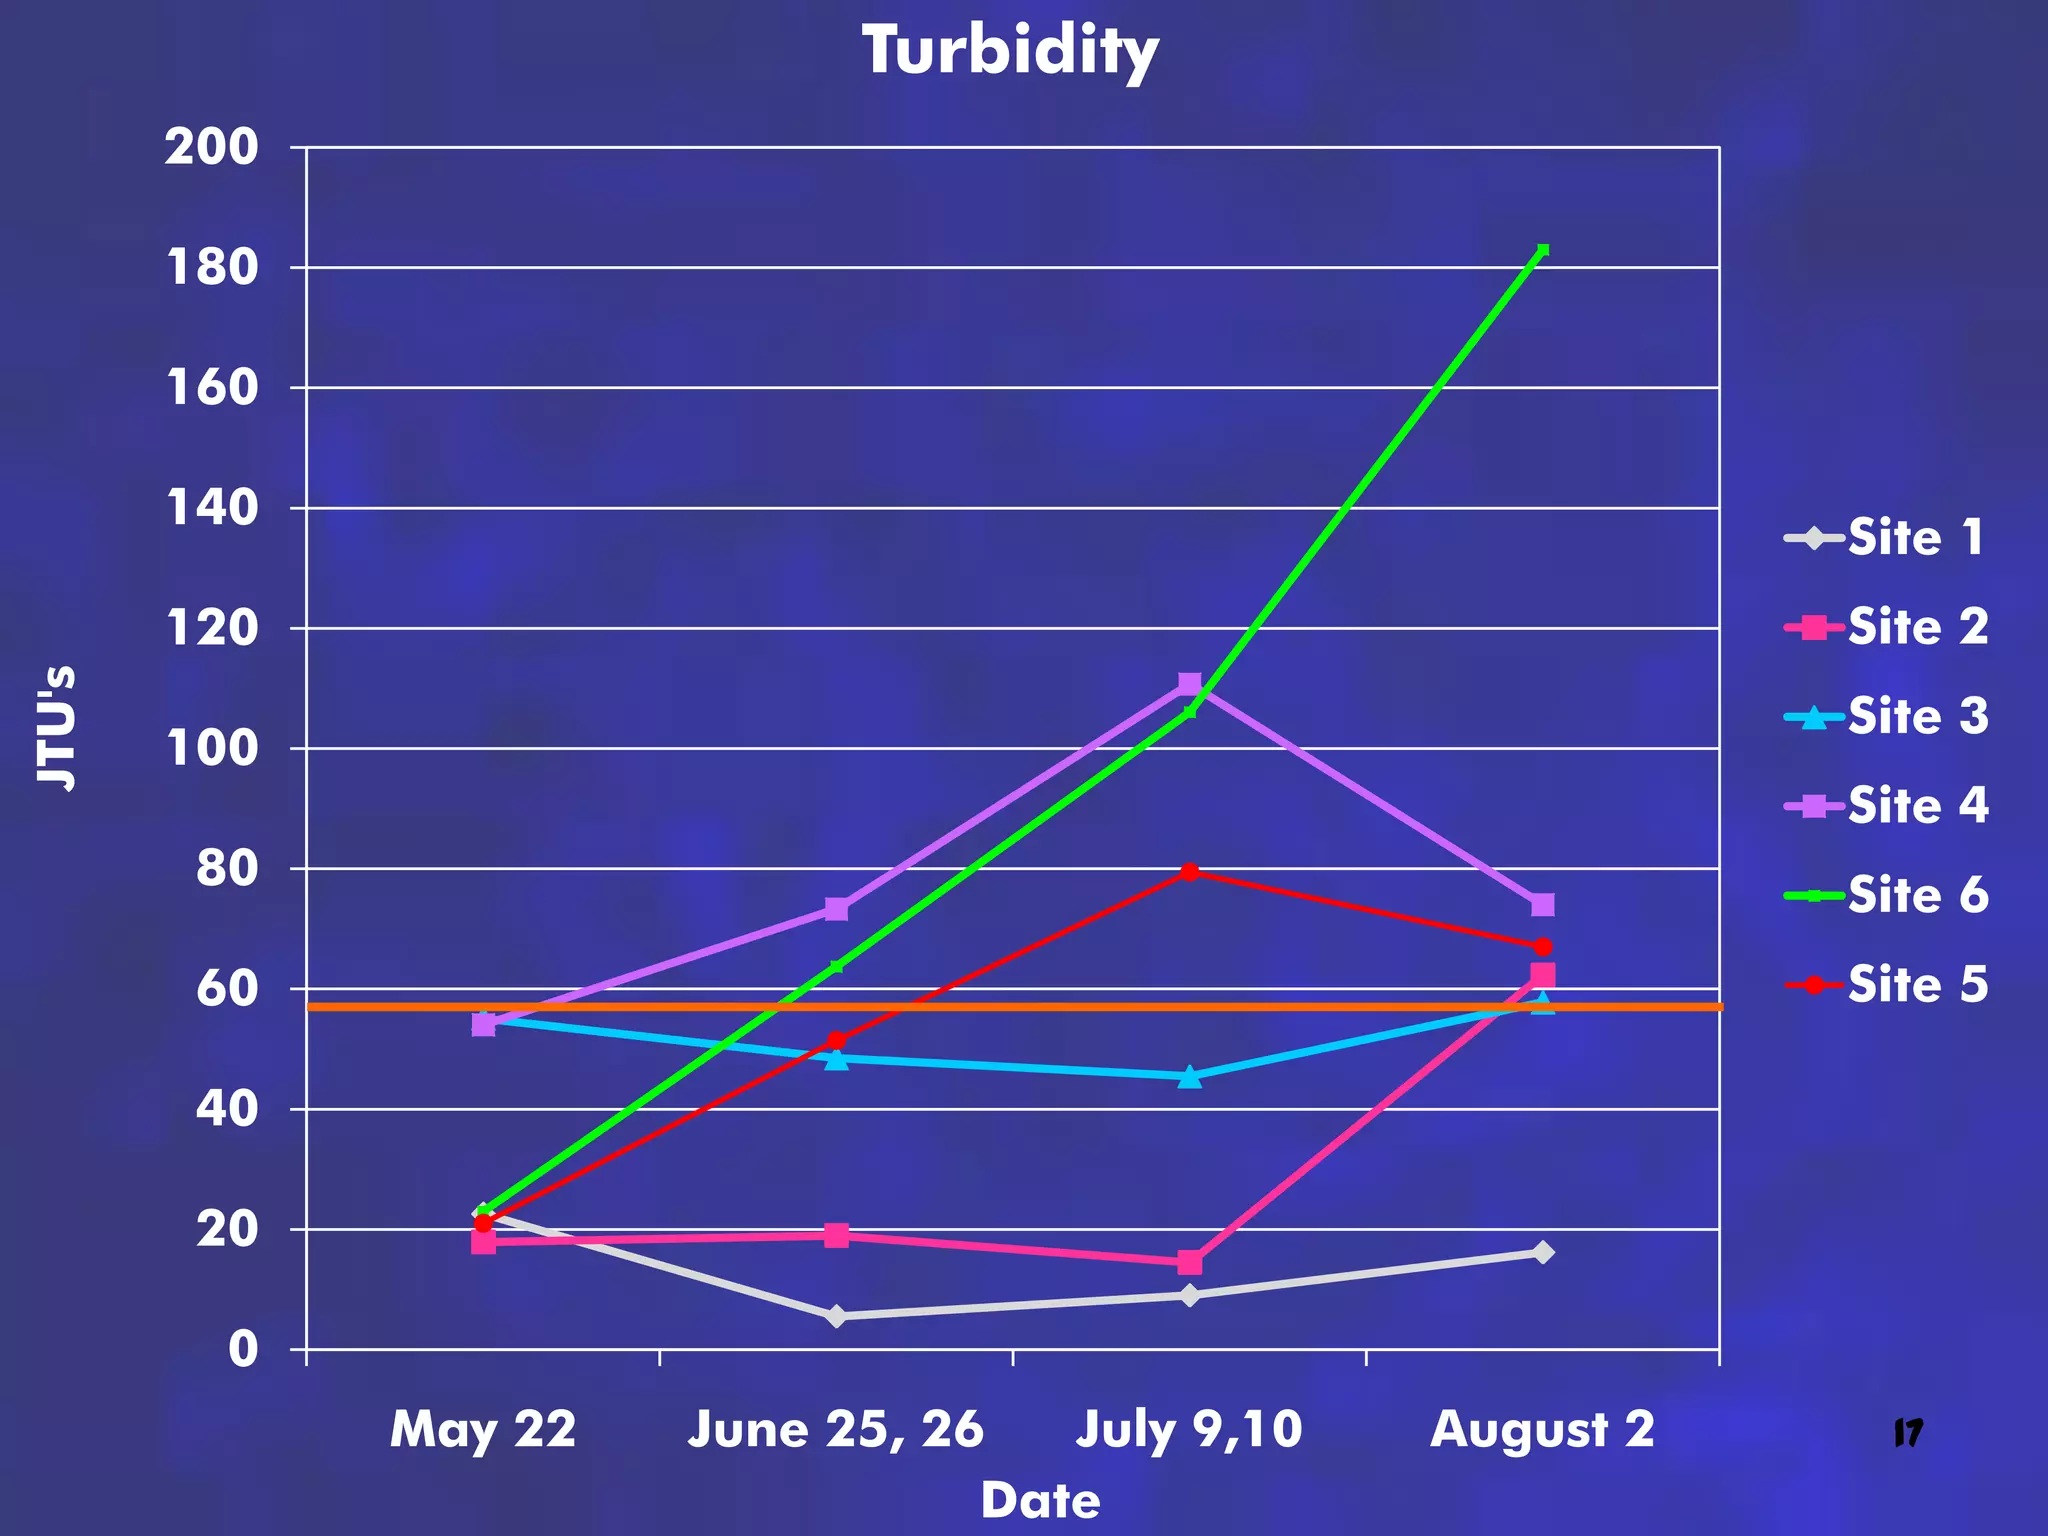
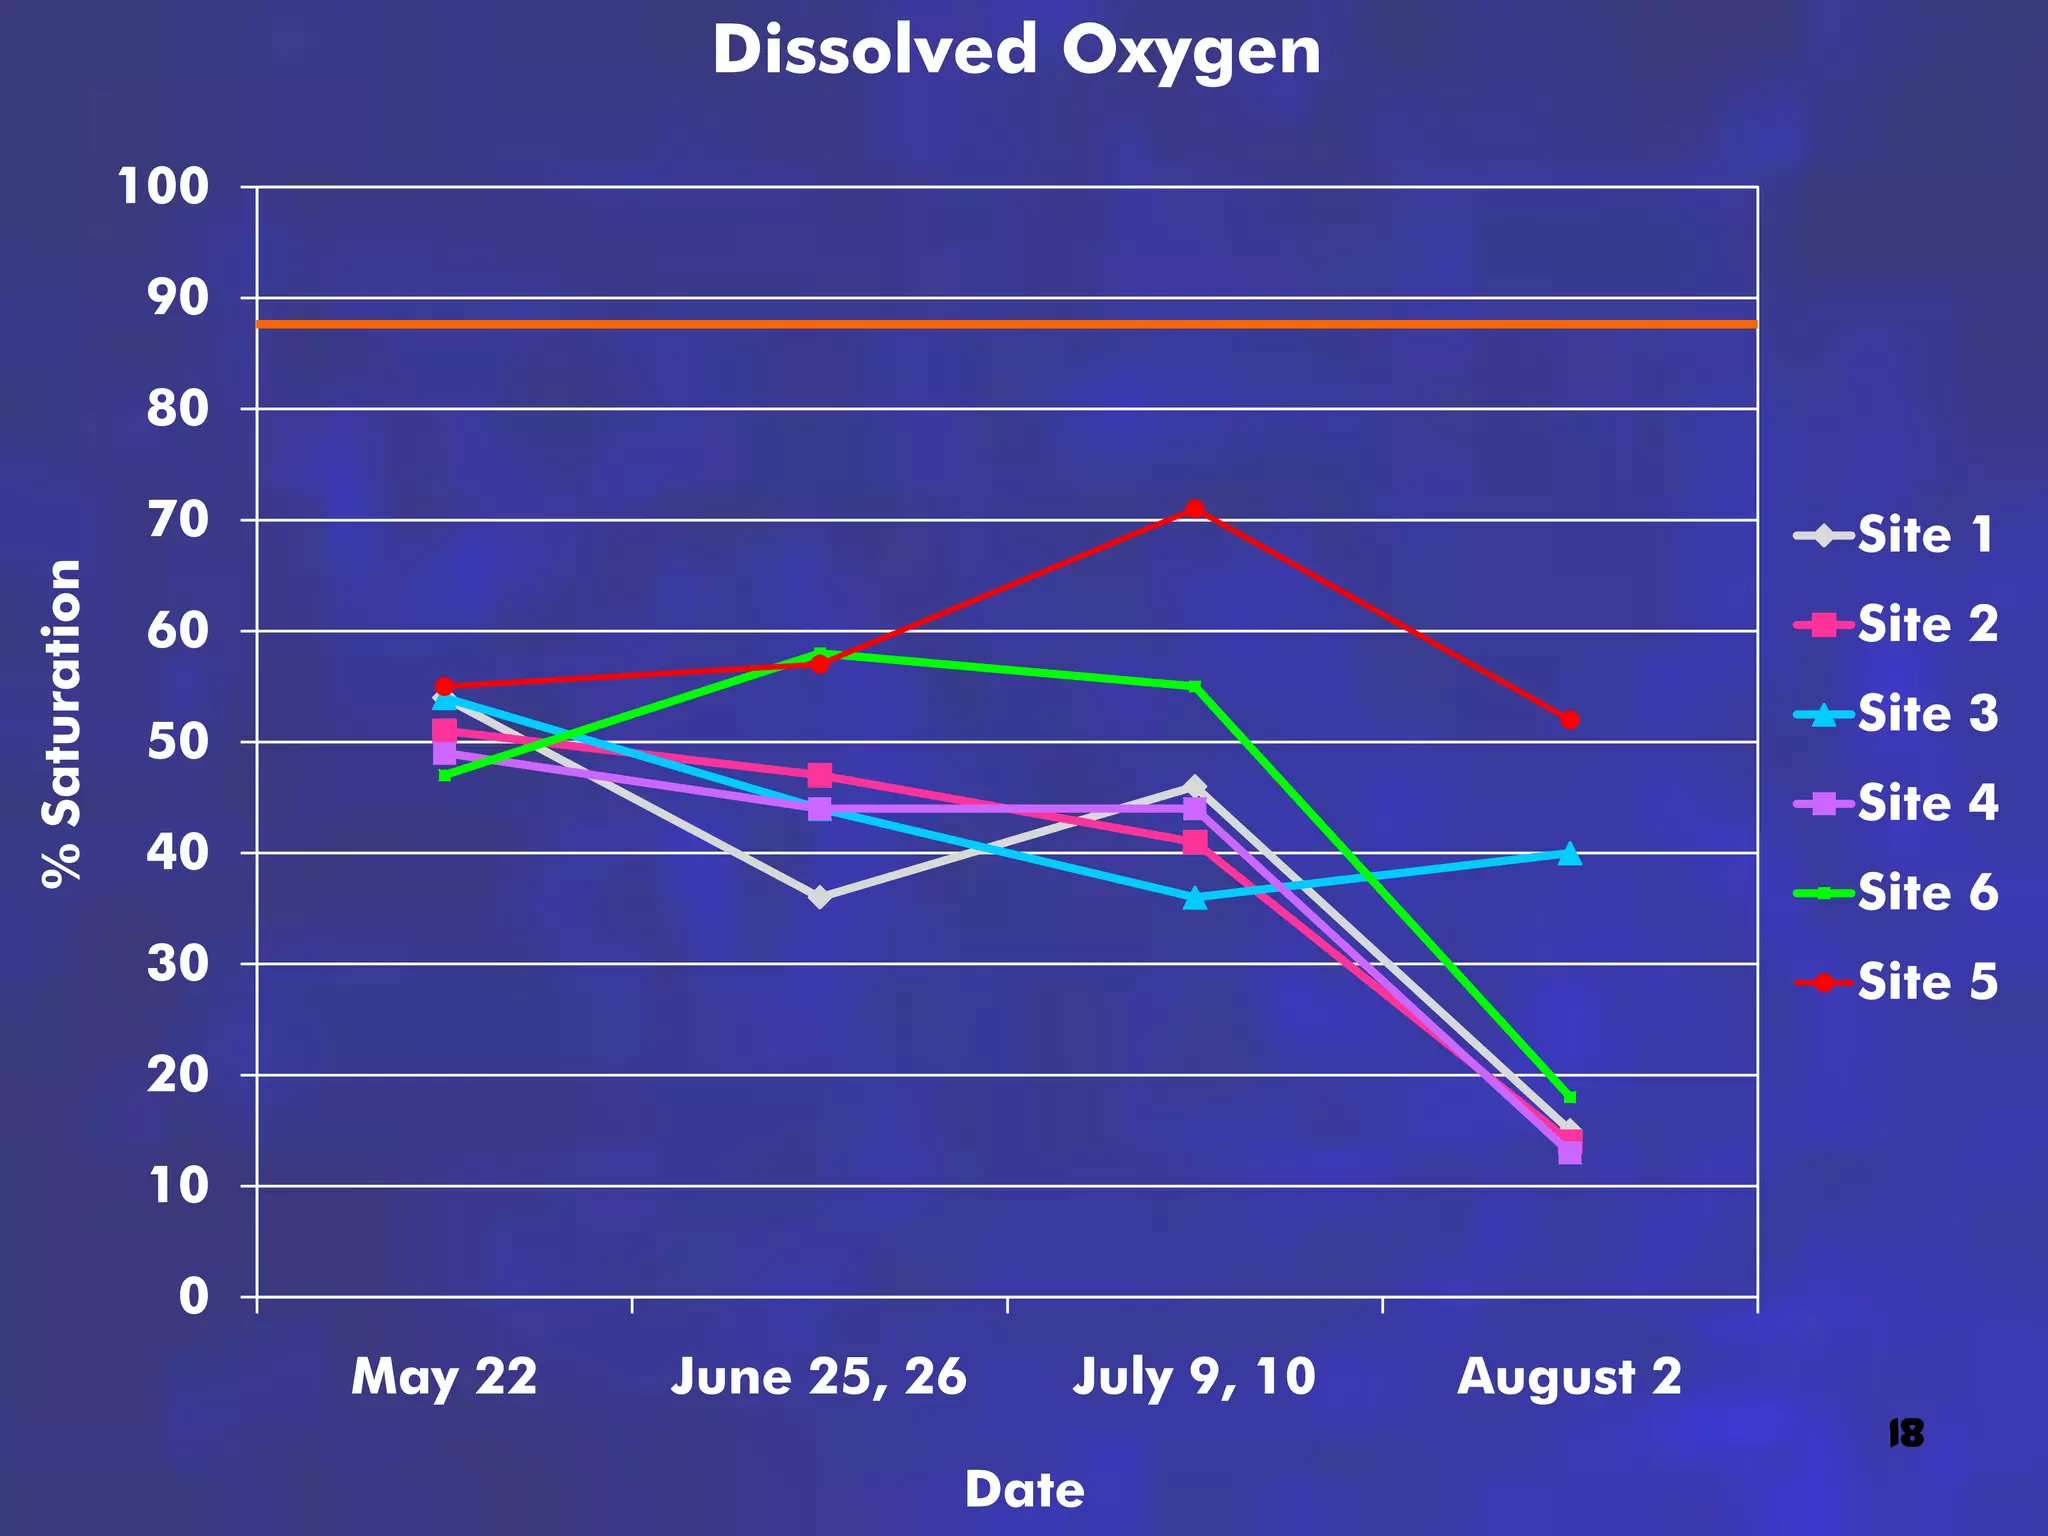
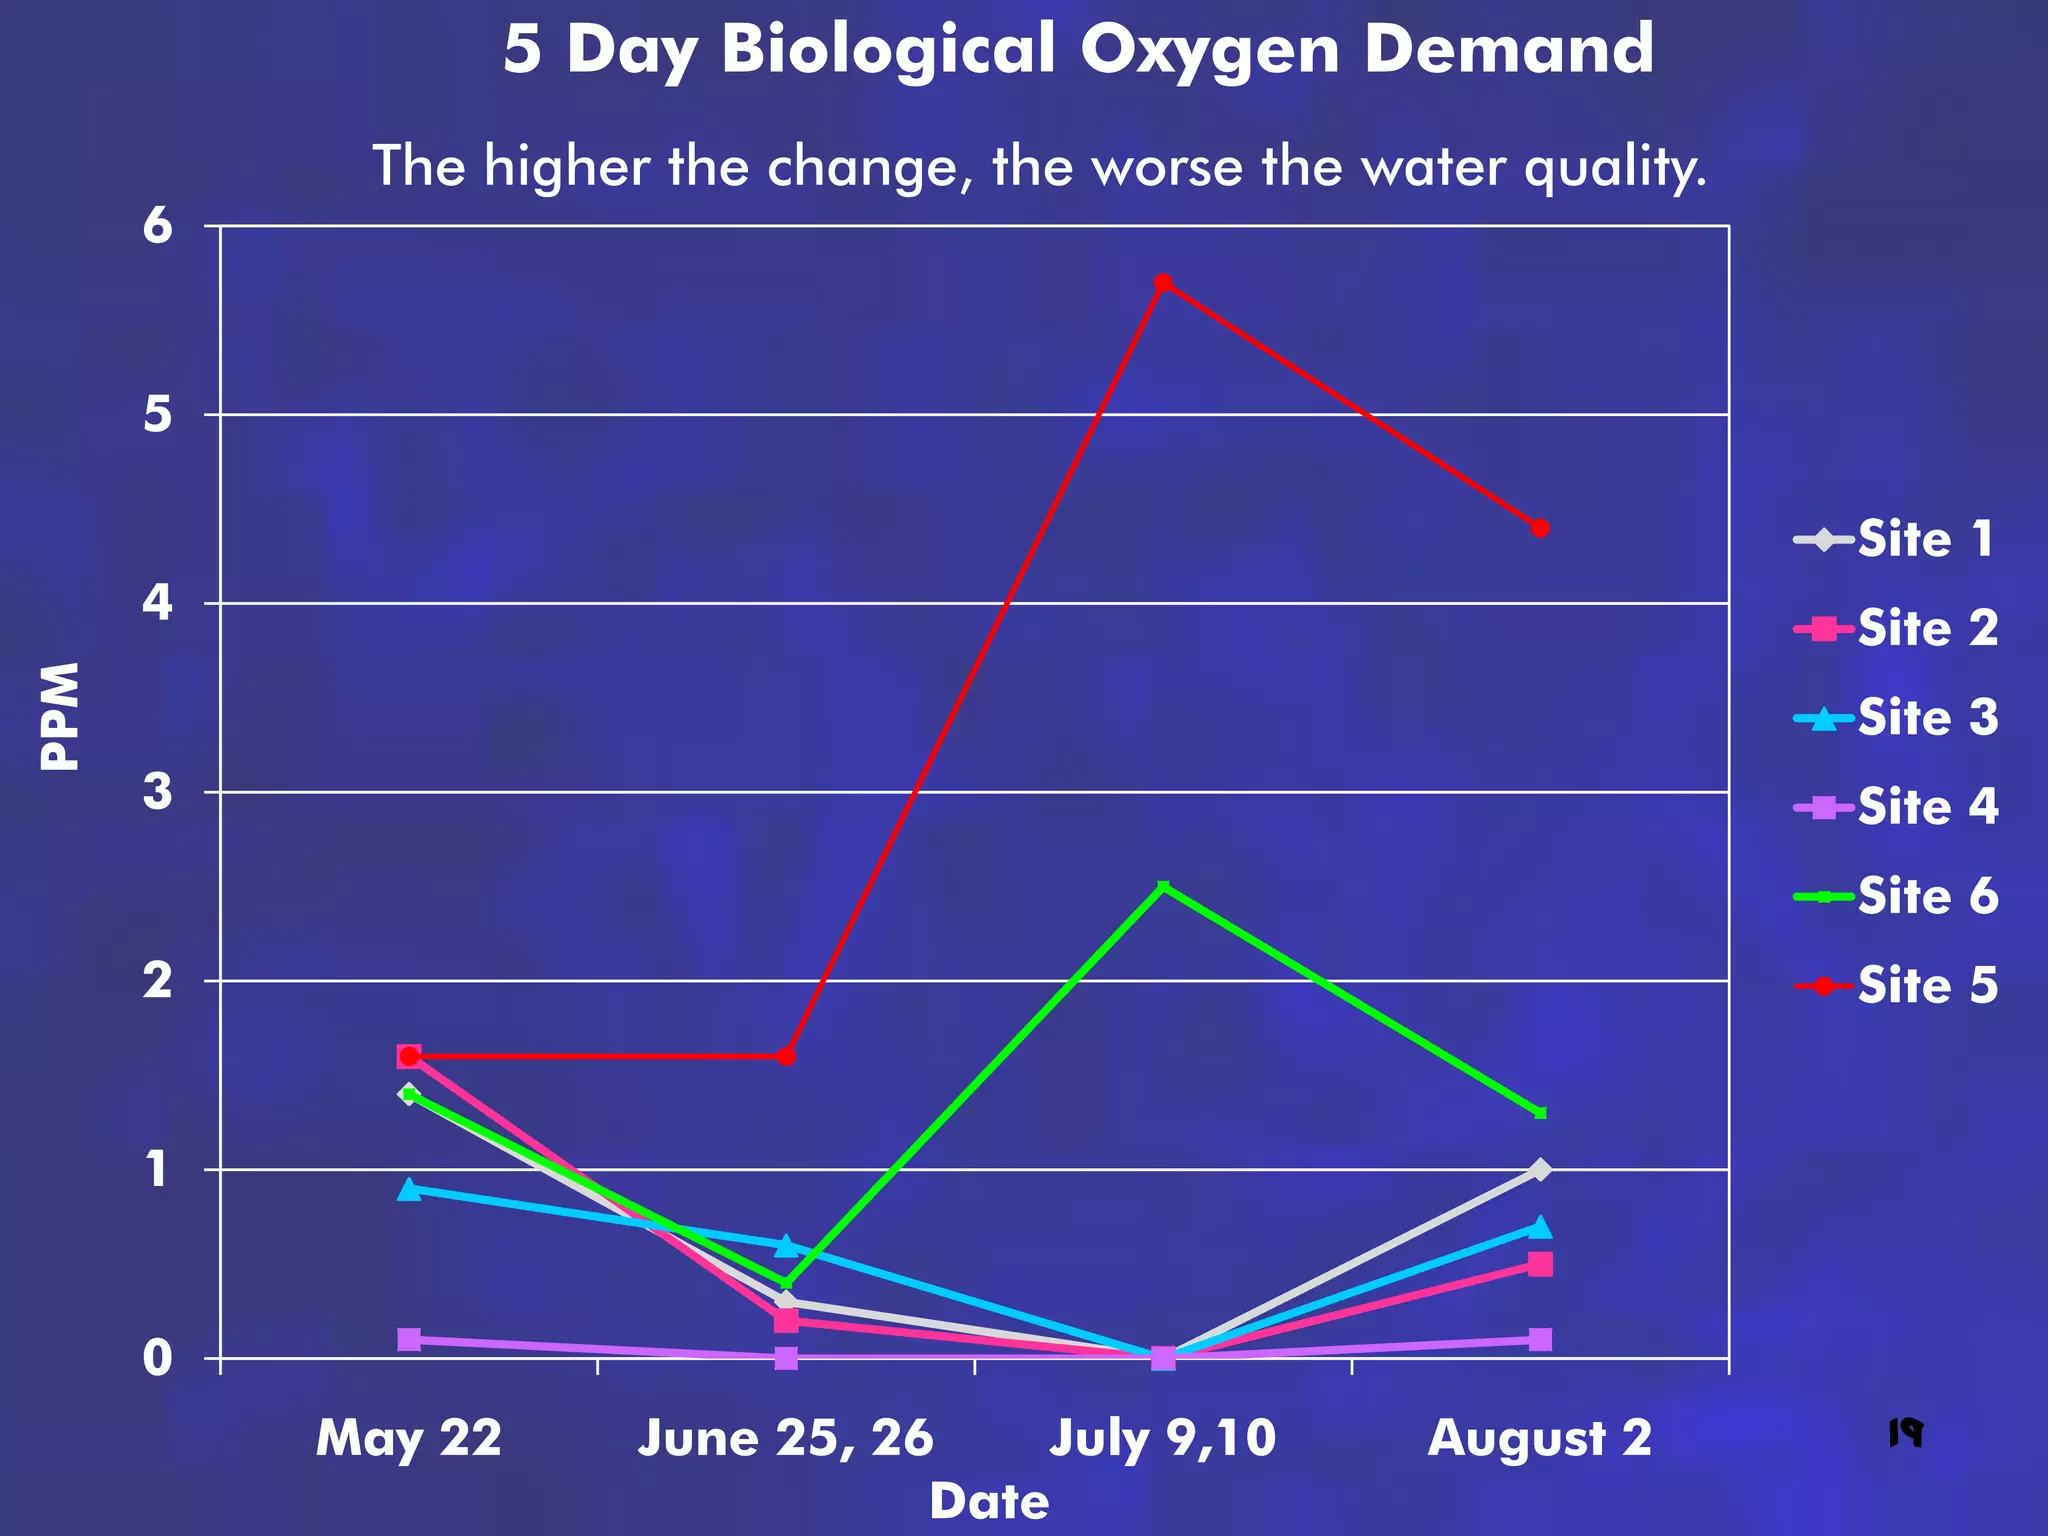
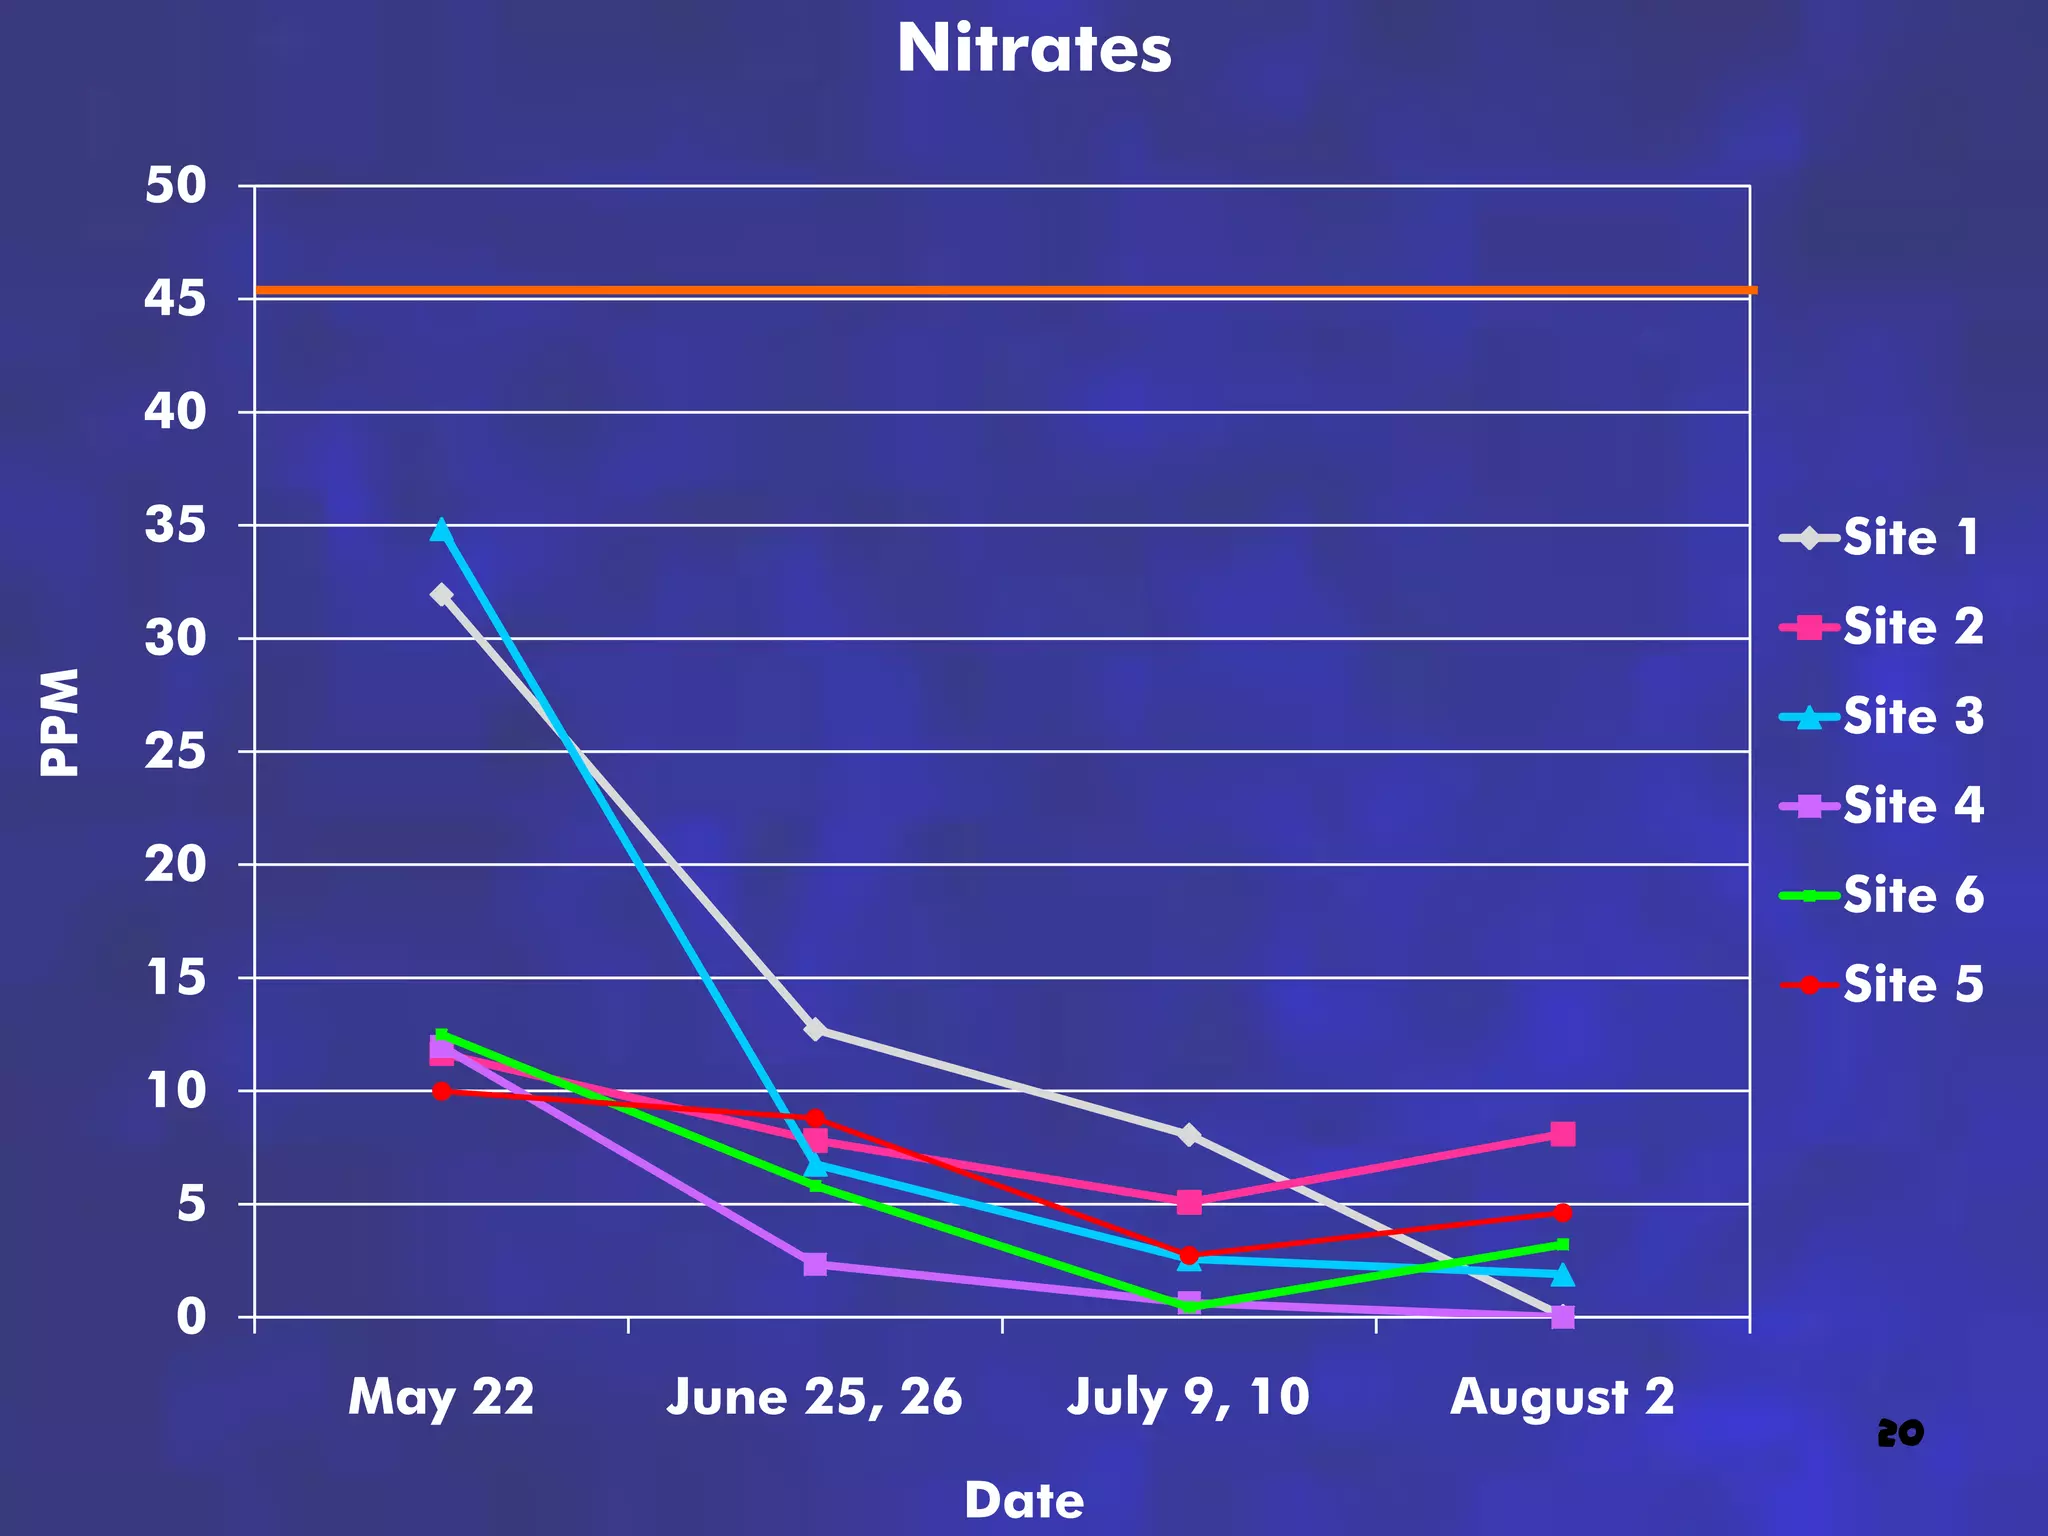
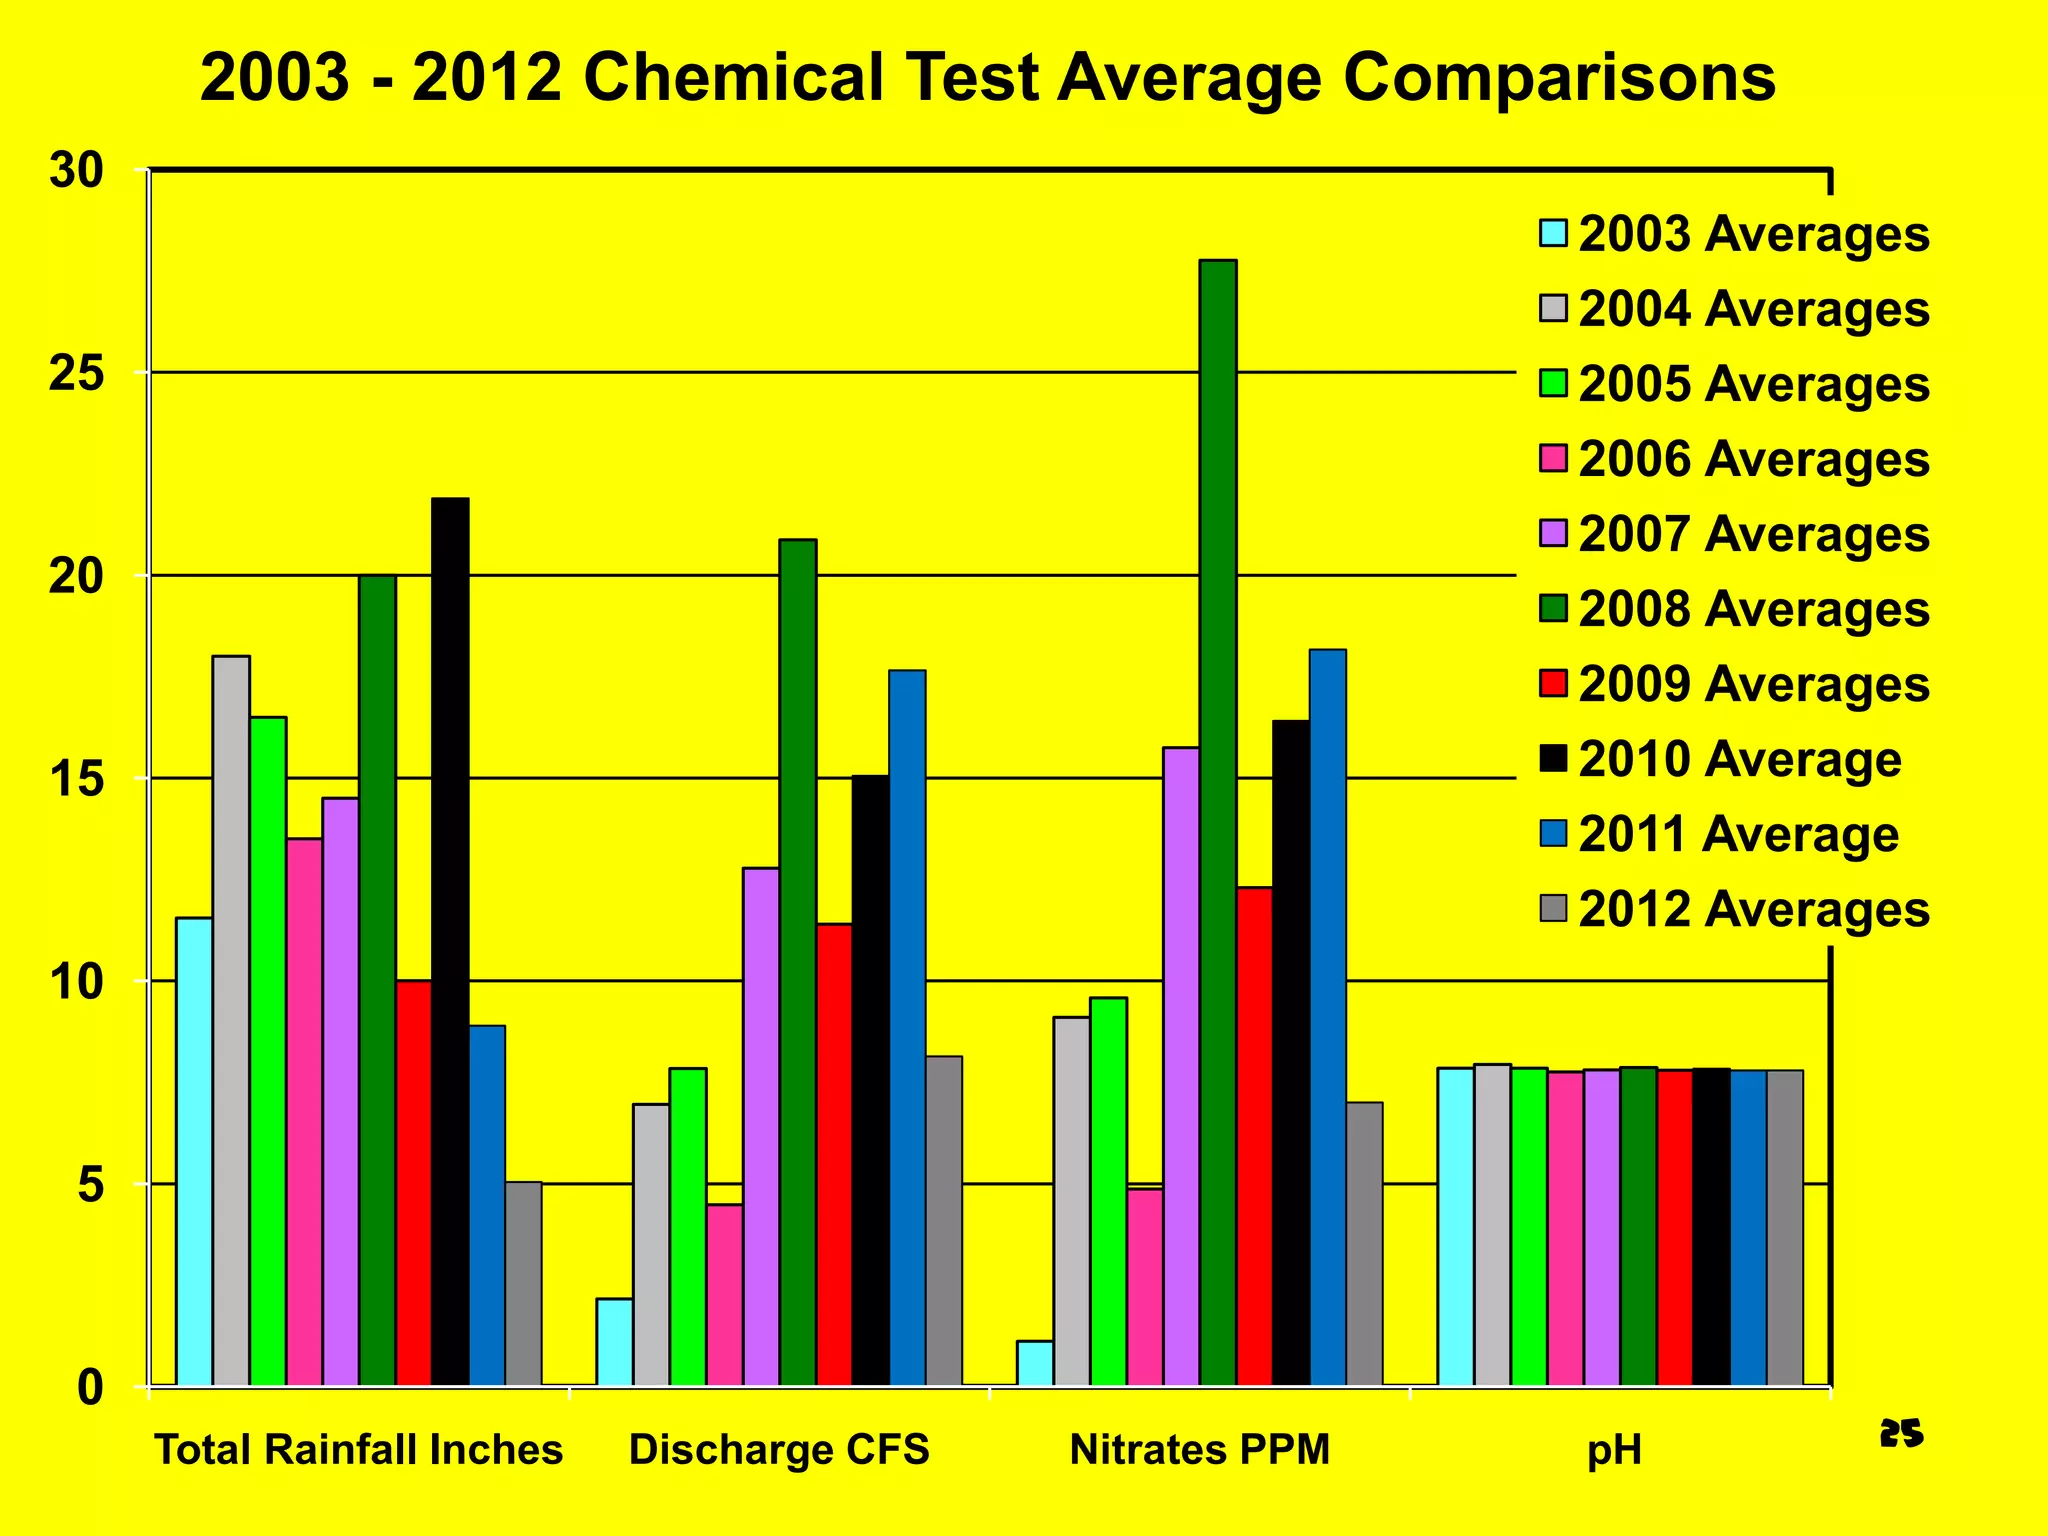
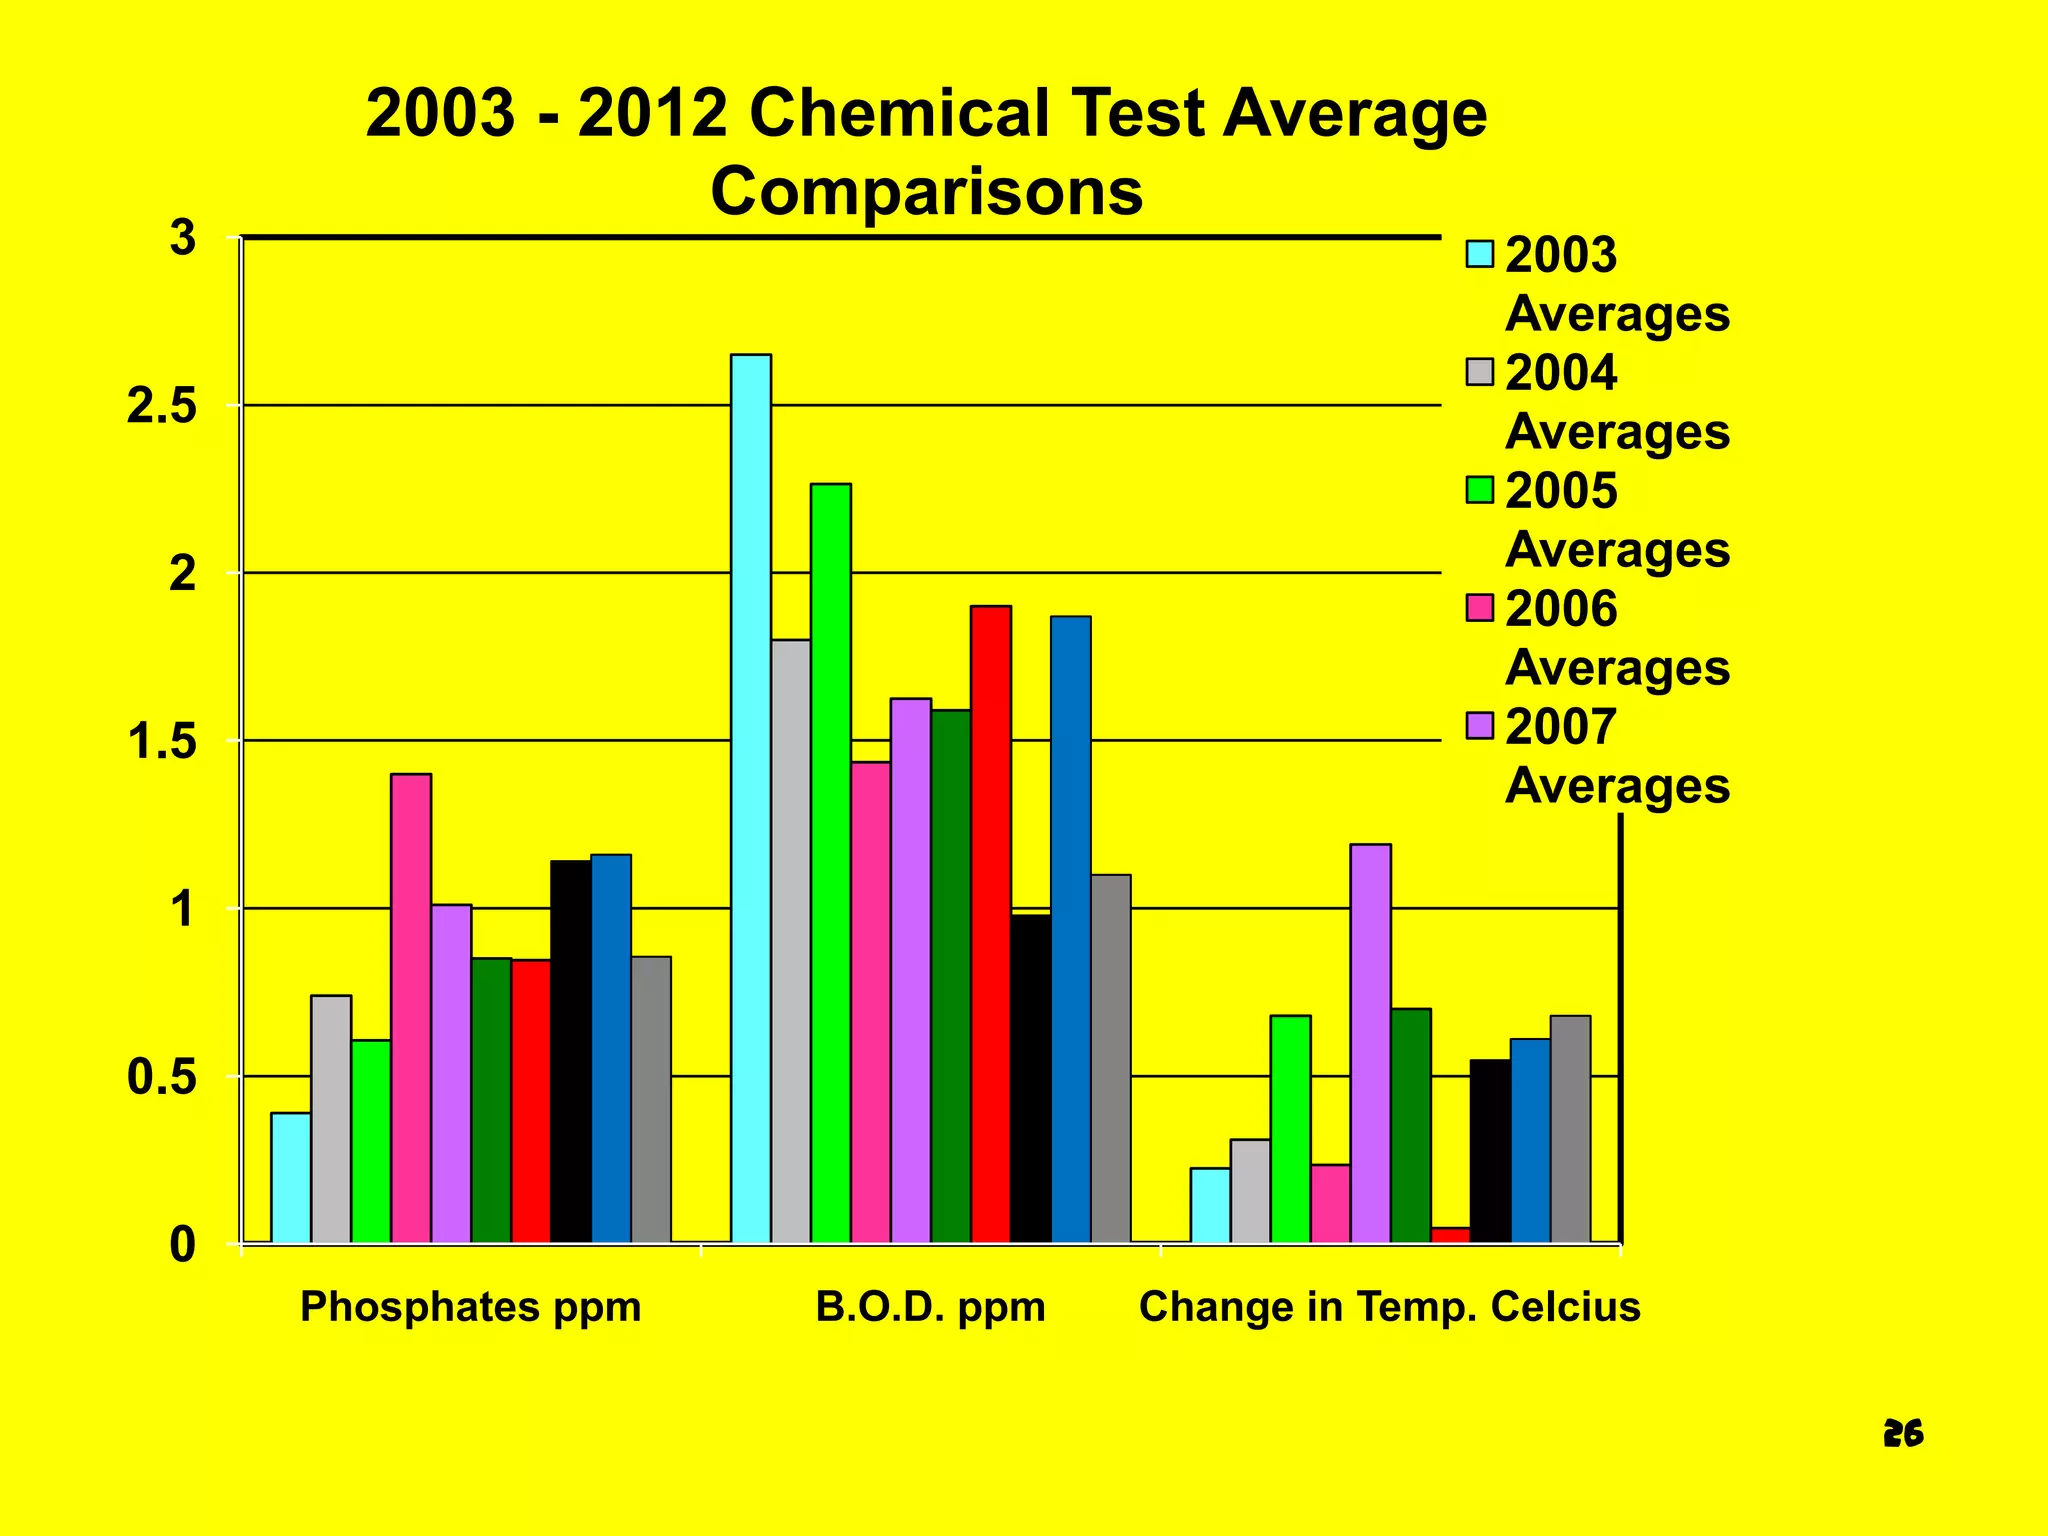
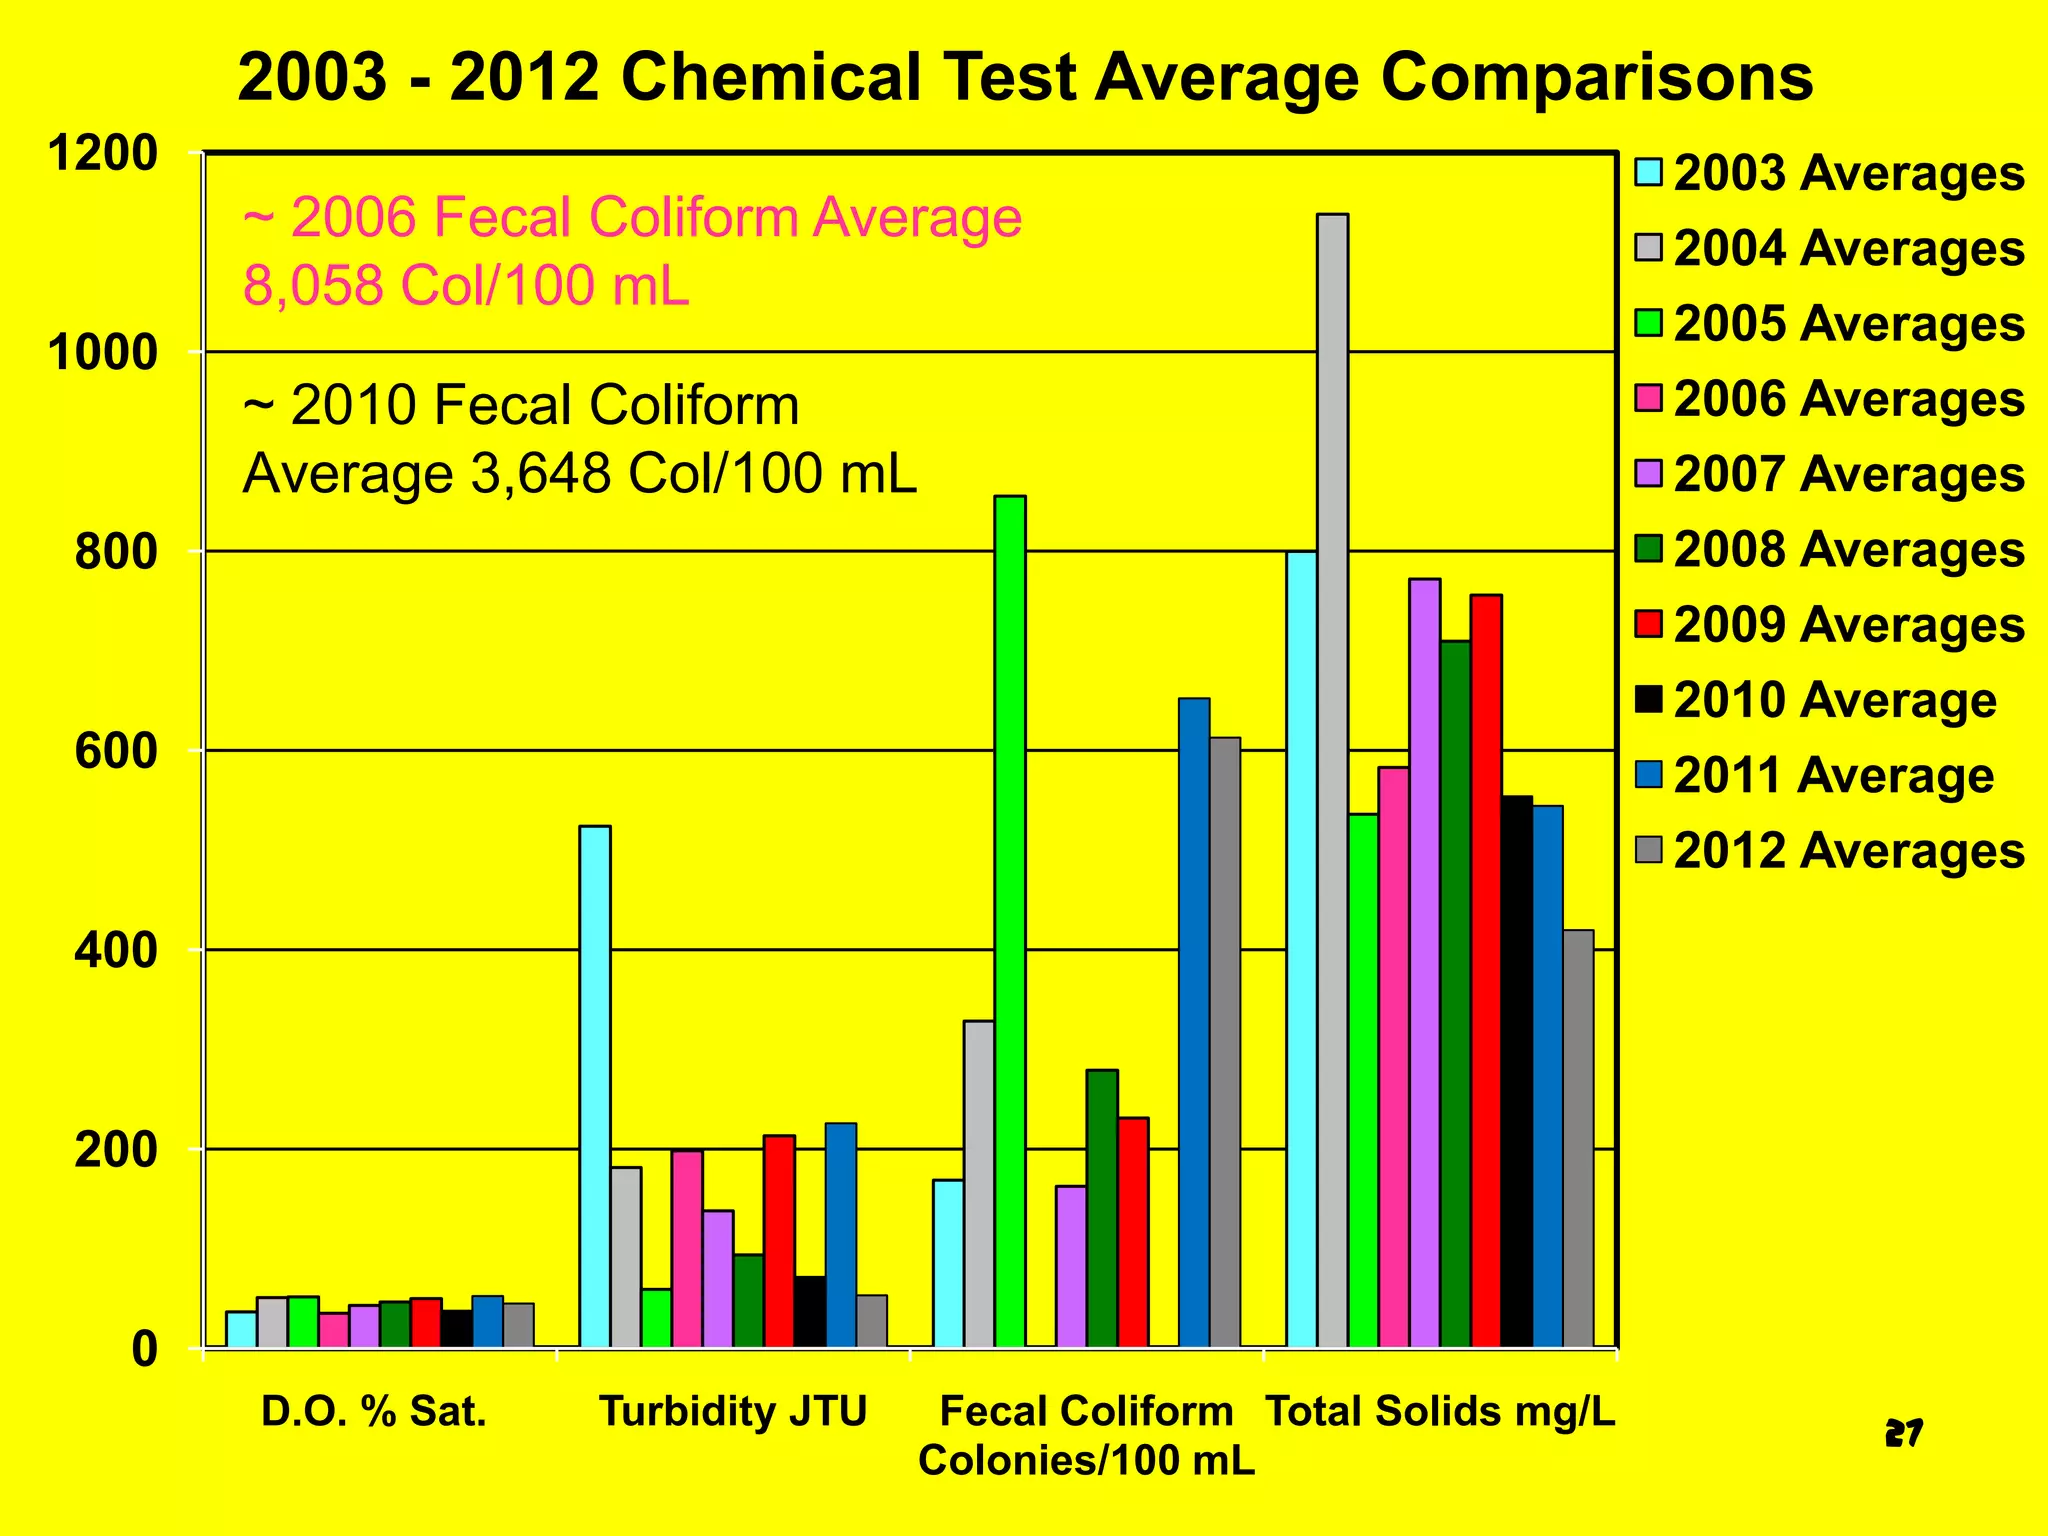
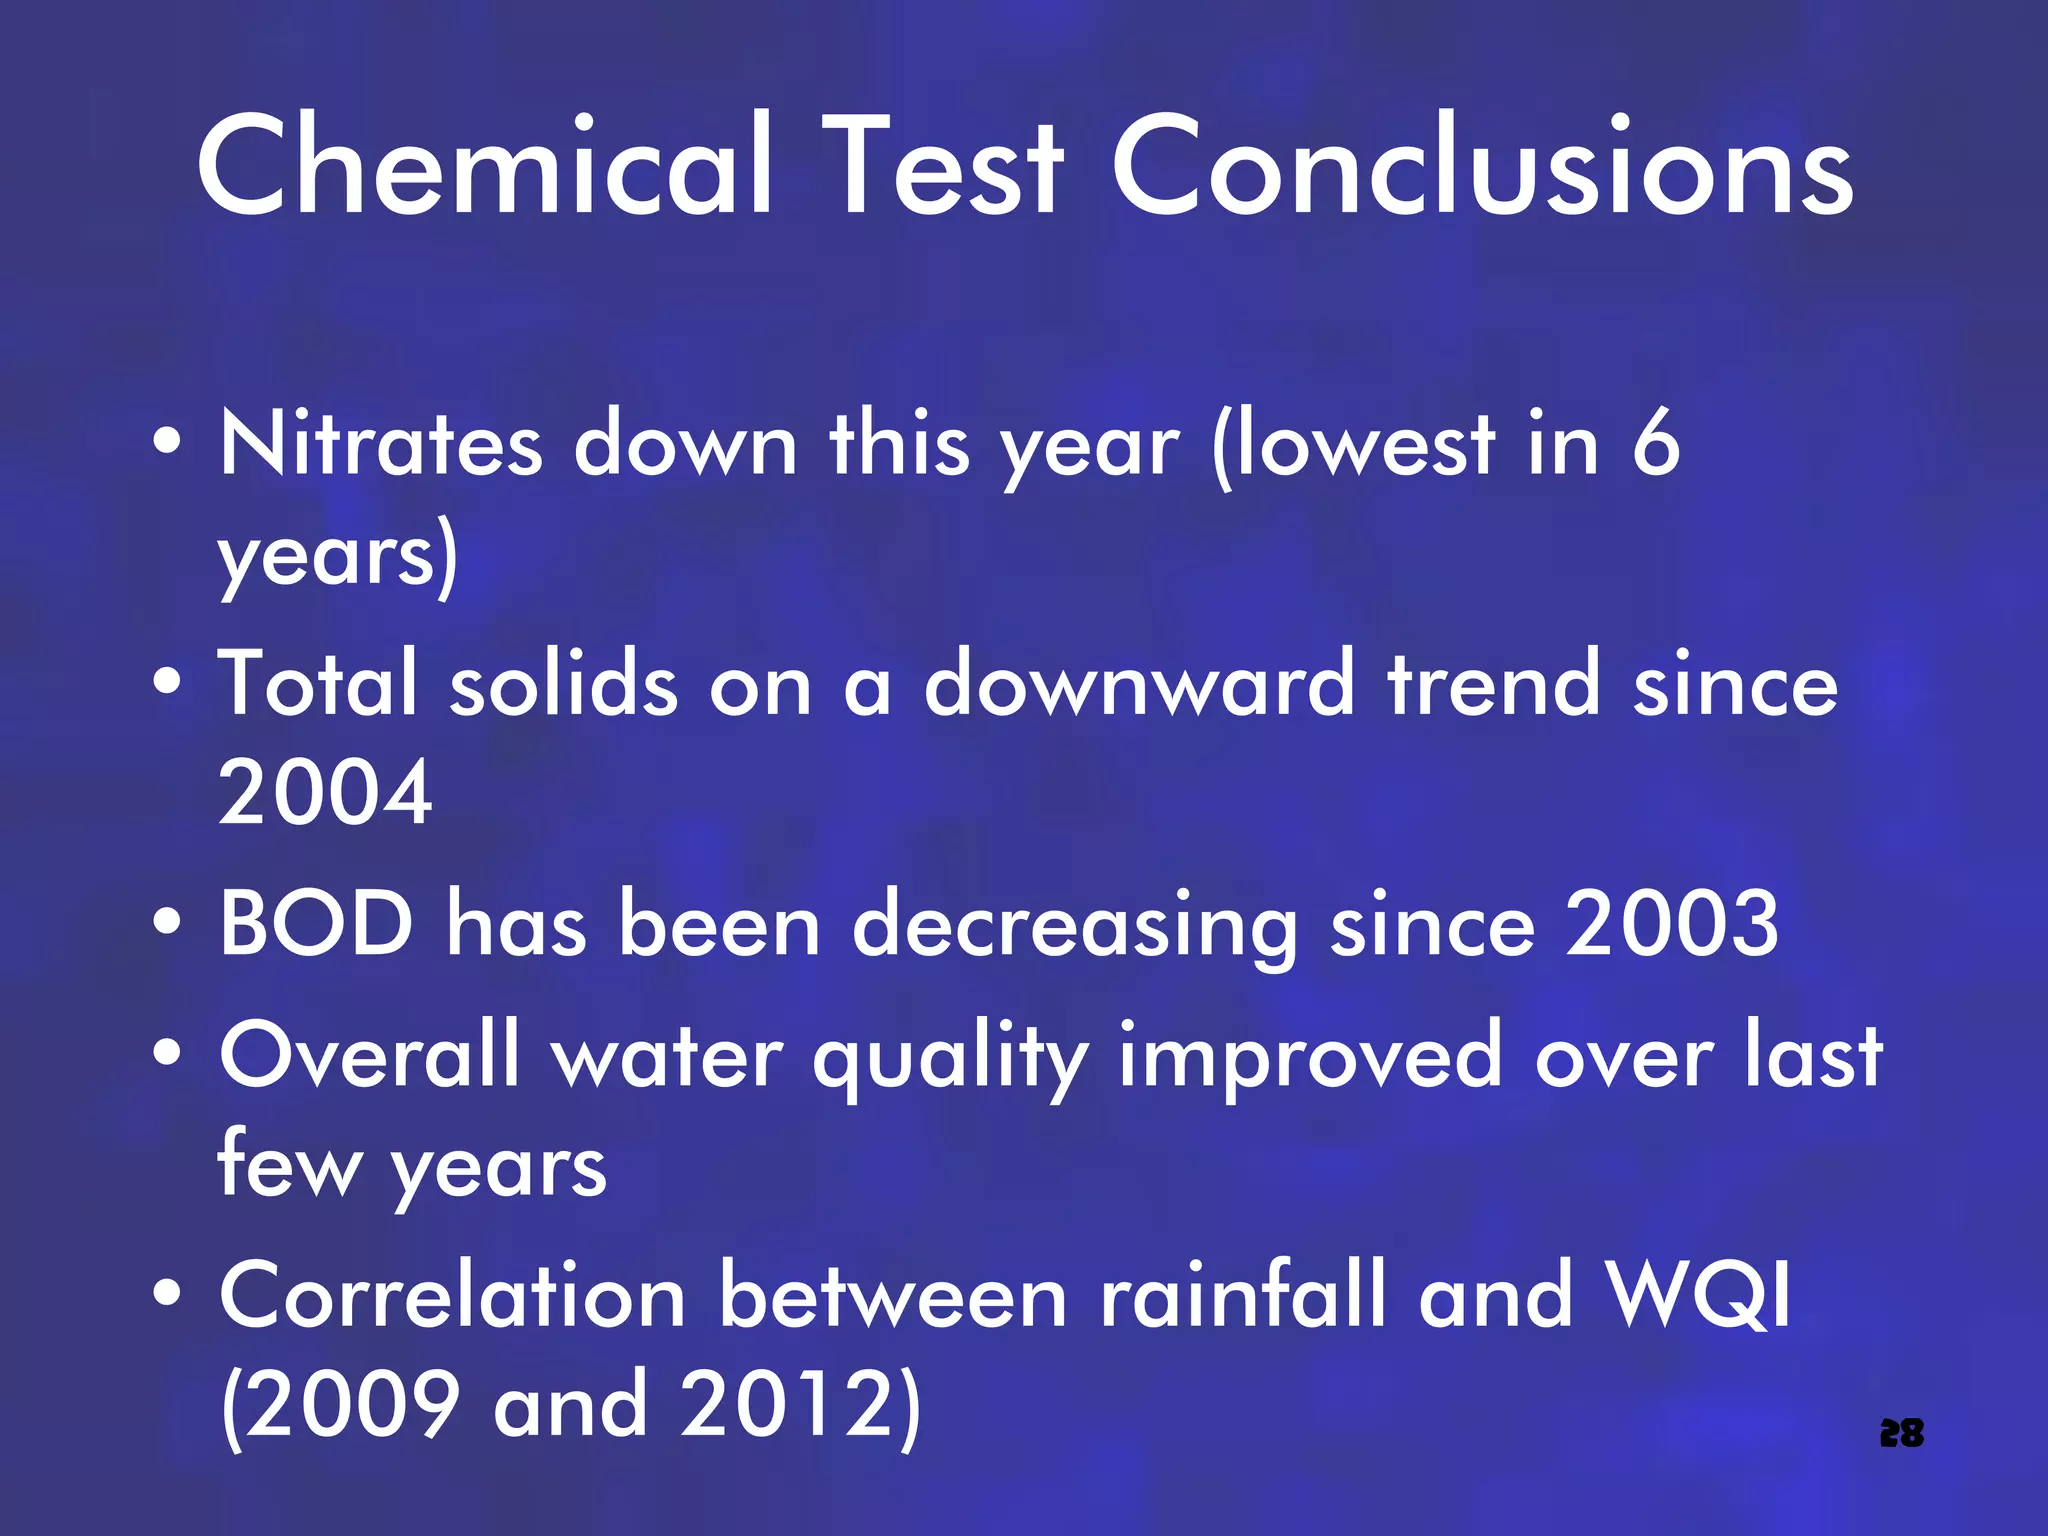
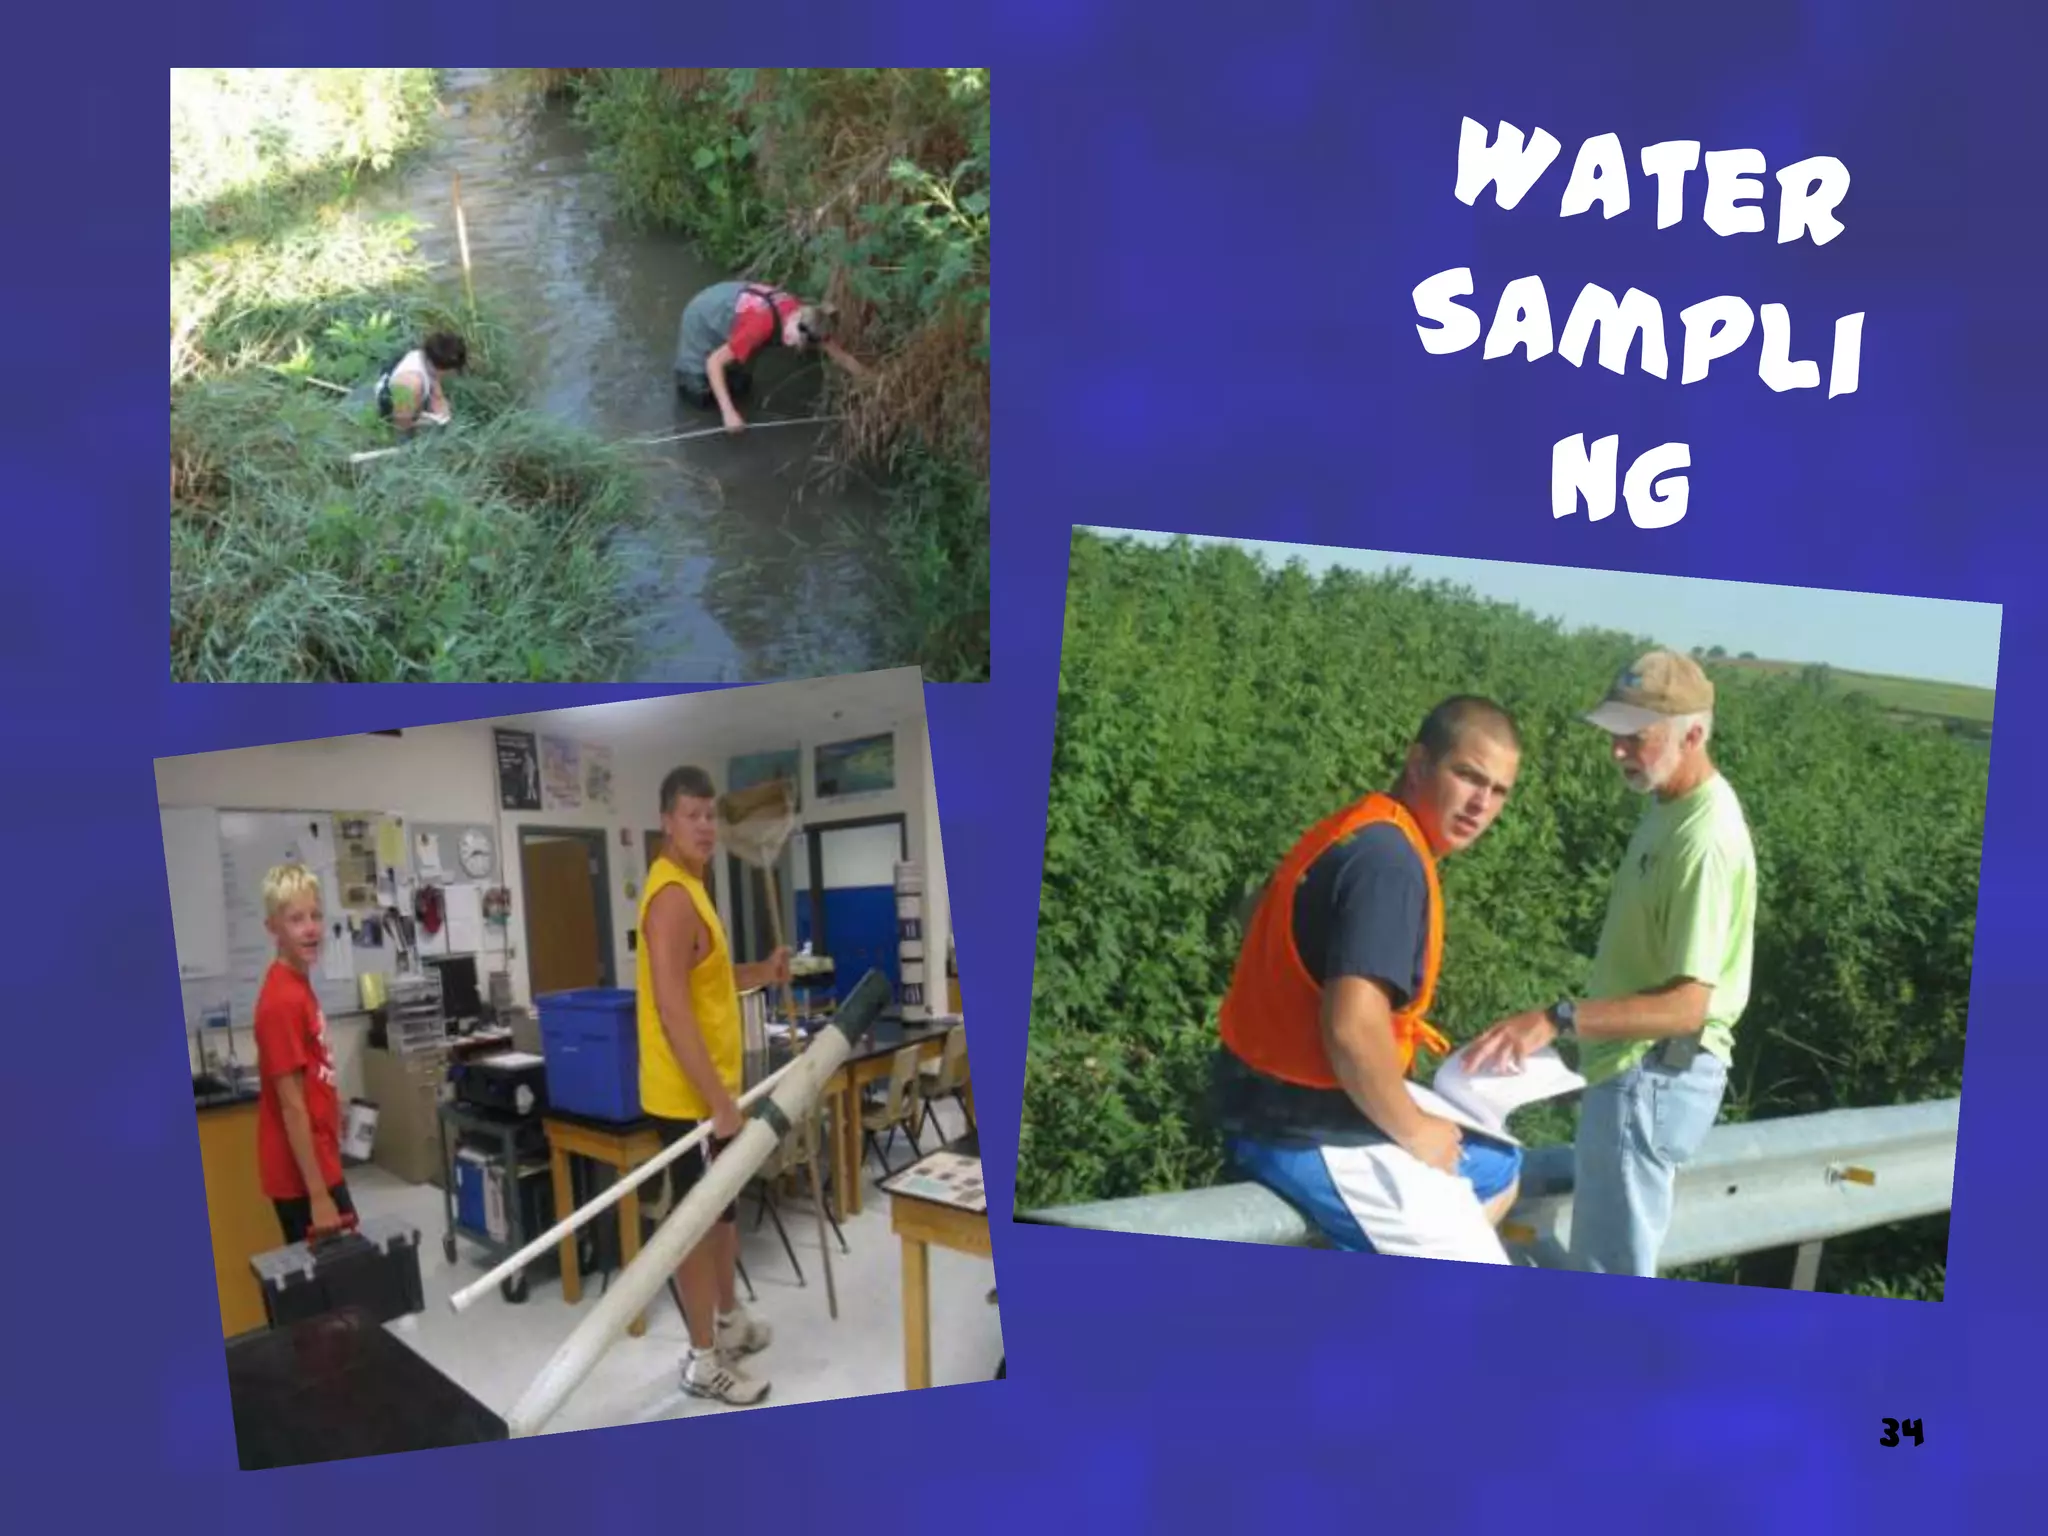
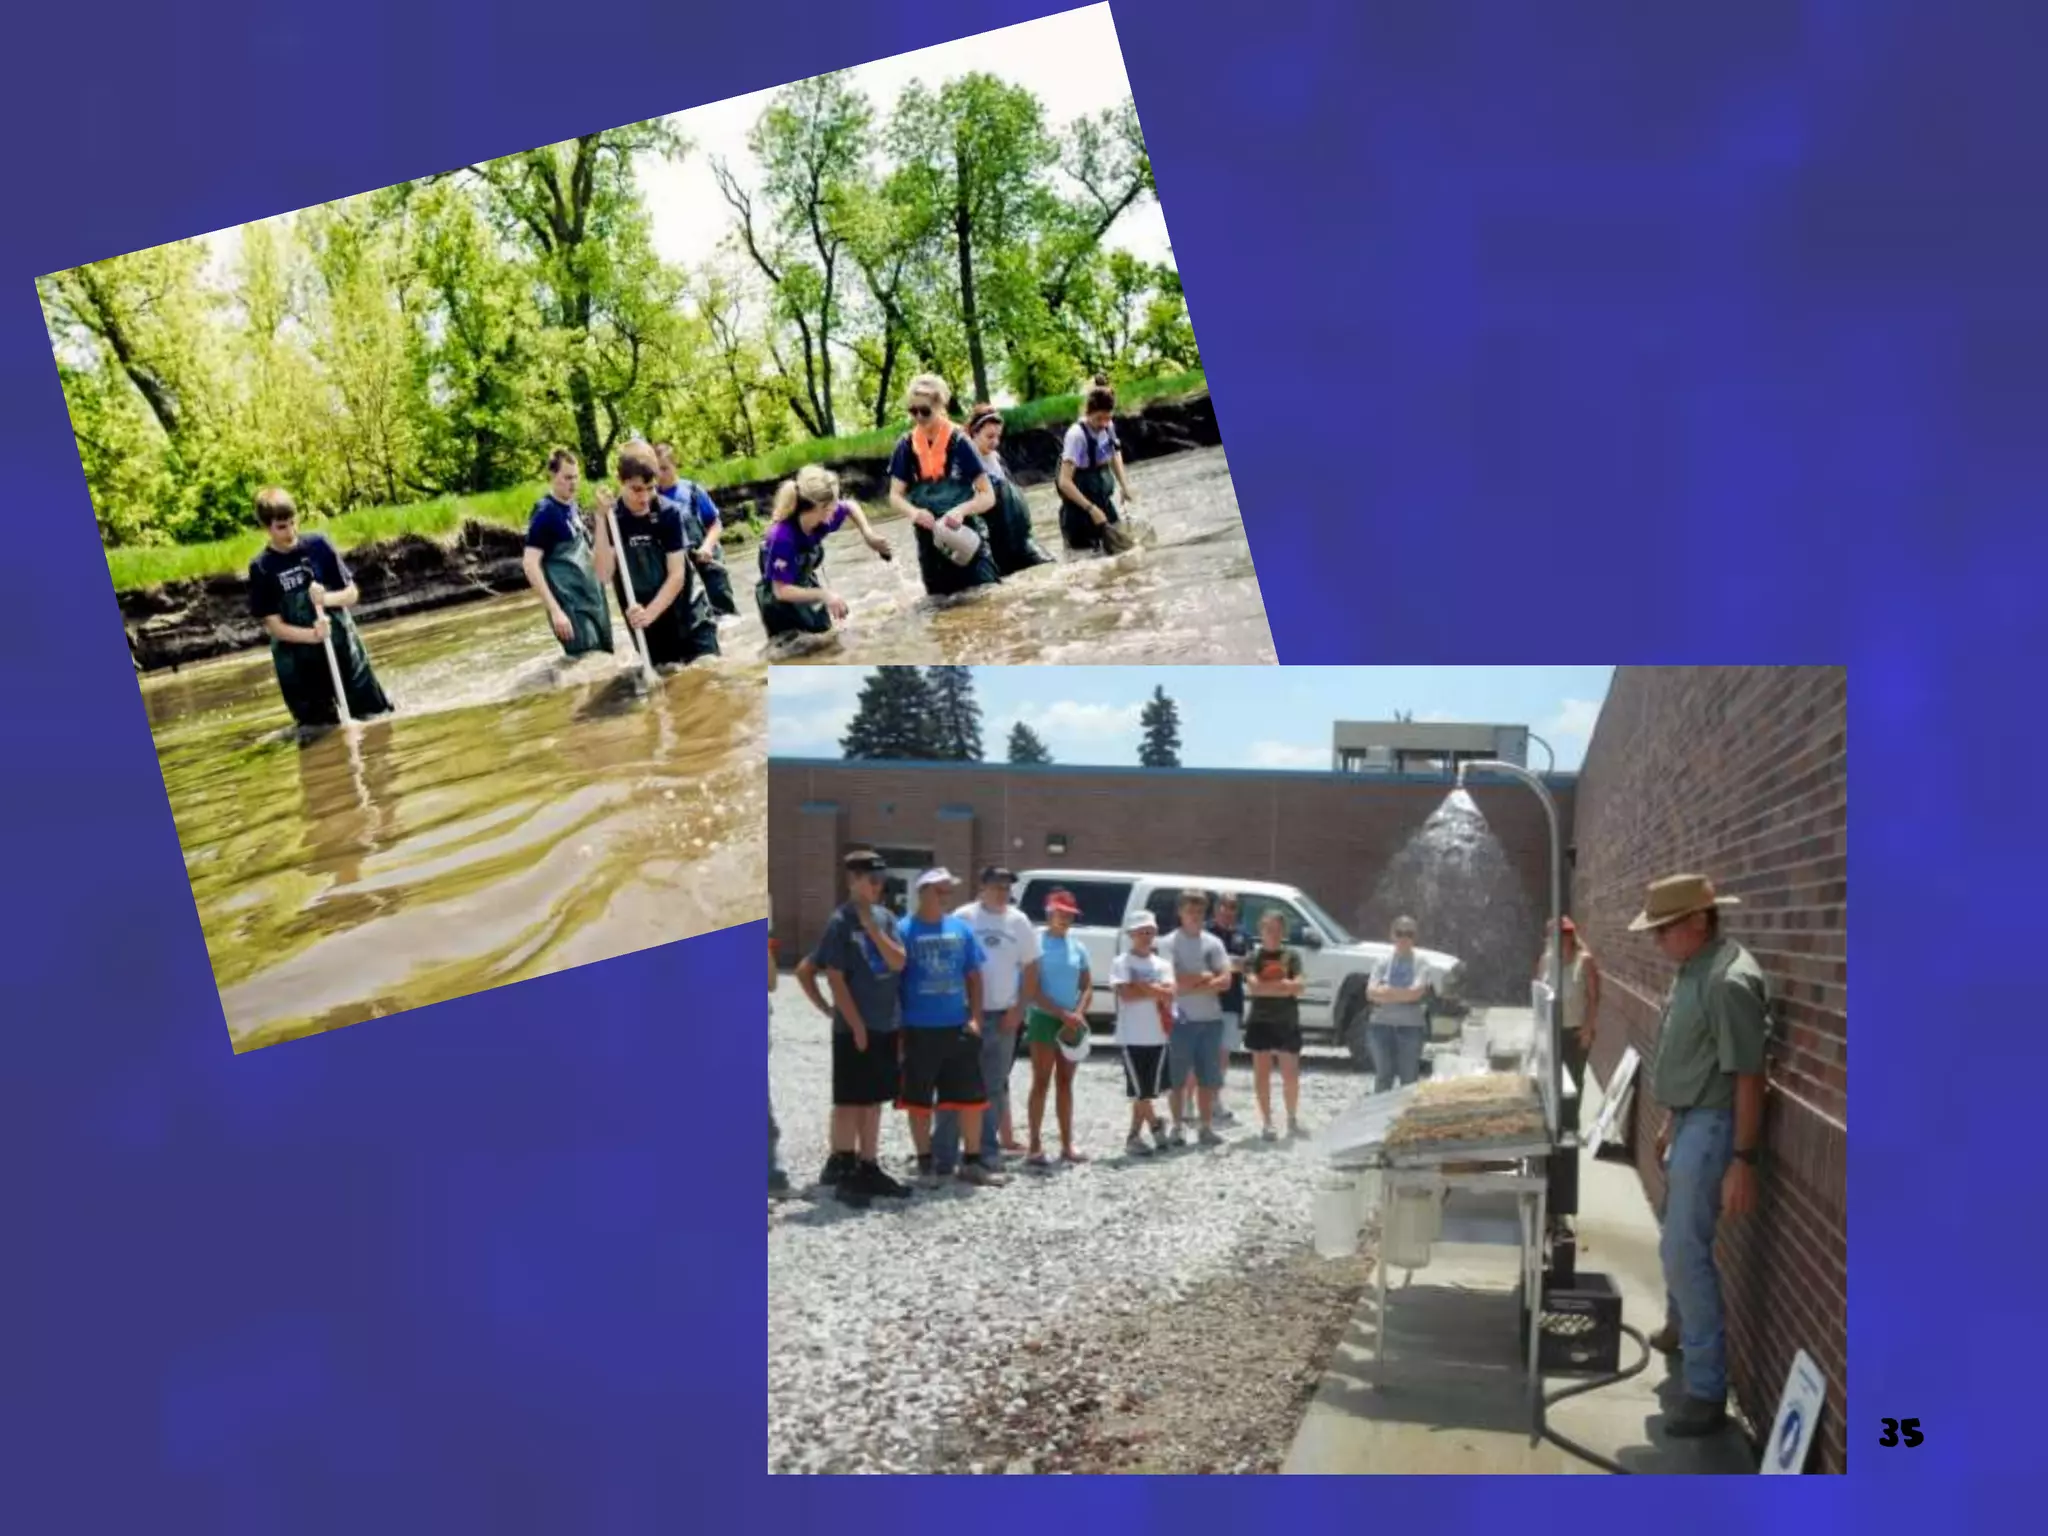
SlideShare a Scribd company logo
2012 Shell Creek
Watershed Research
      Group
   Advisors: Mark Seier, Karen
   Malmkar, and Kylie Sweeter
Researchers: Alisha Dunlap, Ciera
Afrank, Kendra Nelson, Darienne
 Pokorny, Jason Kaufman, Demi
    Edgell, Jacob Haase, John
  O’Brien, Brock Donelson, Billy
 O’Brien, Megan Nelson, Brooke
    Pieke, Alex Wiese, Garrett
  Flamme, Parker Wallin, Sadie
      Wallin, Brett Weinman
                             1
Shell Creek and Loseke-Taylor Creek Watersheds
                            (with Township-Range Labels)
                    Lower Platte North Natural Resources District


South Branch                                     North Branch
                               6


                                                                    2
Below Newman Grove

Above Newman Grove
                     6


                                          3
Below Lindsay

       6


West Platte Center
                               4
W.Q.I.
• The Water Quality Index was developed by the
  National Sanitation Foundation as a standard
  system to compare different bodies of water.
• To determine the WQI, a series of nine tests
  were performed. These tests were: dissolved
  oxygen, fecal coliform, pH, Biological Oxygen
  Demand (BOD), temperature, total phosphate,
  nitrates, turbidity, and total solids. We also did
  a water discharge test which we use to
  measure the flow of the creek in cubic feet per
  second.                                            5
• After the tests are completed, the WQI for each
  section of the creek can be computed.
• To formulate the WQI, we first computed Q-
  values.
• We multiply this number by a weighting factor,
  which provides a measure of the relative
  importance of each test to overall water quality.
• The water quality index ranges from zero to 100.
      - 0 - 25 is very bad
      - 25 - 50 is bad
      - 50 - 70 is medium
      - 70 - 90 is good
      - 90 - 100 is excellent
• The bio-indicator tests are not part of the W.Q.I.,
  but do give us a water quality rating.
                                                        6
Sample W.Q.I. Curve Chart


                            7
Sample W.Q.I. Form
                                     Weighting
                Test Results Q-value  Factor   Total
      DO          % sat.               0.17
Fecal Coliform col/100 mL              0.16
       pH          units               0.11
      BOD          mg/L                0.11
 Temperature change in C               0.1
Total Phosphate    mg/L                0.1
   Nitrates        mg/L                0.1
   Turbidity        JTU                0.08
 Total Solids      mg/L                0.07

              Overall Water Quality Index ___     8
2012 Precipitation

          4

         3.5

          3

         2.5

          2
Inches


         1.5

          1

         0.5

          0
               May      June          July   August


                               Date                   9
pH

           8.4

           8.1
                                                                 Site 1
           7.8
                                                                 Site 2
pH Level


           7.5                                                   Site 3
                                                                 Site 4
           7.2                                                   Site 6
                                                                 Site 5
           6.9

           6.6

           6.3
                 May 22   June 25, 26    July 9, 10   August 2

                                                                 10
                                    Date
Change in Water Temperature
                       The higher the change, the worse the water quality.
                  4

                  3

                  2
                                                                             Site 1
Degrees Celcius


                  1                                                          Site 2
                                                                             Site 3
                  0
                                                                             Site 4
                  -1                                                         Site 6
                                                                             Site 5
                  -2

                  -3

                  -4
                       May 22      June 25, 26    July 9, 10     August 2     11
                                              Date
Total Solids
             The higher the concentration, the worse the water quality.
       700


       600


       500                                                                Site 1
                                                                          Site 2
mg/L


       400                                                                Site 3
                                                                          Site 4
       300
                                                                          Site 6
                                                                          Site 5
       200


       100


        0
              May 22      June 25, 26  July 9,10       August 2            12
                                    Date
Fecal Coliform


                 13
Fecal Coliform
                  4,000

                  3,500

                  3,000
Colonies/100 mL


                                                                         Site 1
                  2,500
                                                                         Site 2

                  2,000                                                  Site 3
                                                                         Site 4
                  1,500                                                  Site 6
                                                                         Site 5
                  1,000

                   500

                     0
                          May 22   June 25, 26   July 9, 10   August 2
                                                                            14
                                             Date
Fecal Coliform
                  1800
                           In 2006           In 2010          In 2012
                           Site 1- 21,418    Site 1- 11,387   Site 6- 4,000
                  1600     Site 5- 17,800
                                             Site 6- 2,313
                  1400
Colonies/100 mL


                  1200                                                        Site 1
                                                                              Site 2
                  1000
                                                                              Site 3
                   800                                                        Site 4
                                                                              Site 6
                   600
                                                                              Site 5
                   400

                   200

                    0
                         2003 2004 2005 2006 2007 2008 2009 2010 2011 2012
                                                                               15
                                                  Date
Flow
                        120


                        100
Cubic Feet Per Second


                        80                                                   Site 1
                                                                             Site 2
                                                                             Site 3
                        60
                                                                             Site 4
                                                                             Site 6
                        40
                                                                             Site 5


                        20


                         0
                              May 22   June 25, 26   July 9, 10   August 2    16
                                                  Date
Turbidity
        200

        180

        160

        140
                                                            Site 1
        120                                                 Site 2
JTU's


                                                            Site 3
        100
                                                            Site 4
        80
                                                            Site 6
        60                                                  Site 5

        40

        20

         0
              May 22   June 25, 26   July 9,10   August 2    17
                                  Date
Dissolved Oxygen
               100

               90

               80

               70                                                   Site 1
% Saturation


               60                                                   Site 2
                                                                    Site 3
               50
                                                                    Site 4
               40
                                                                    Site 6
               30                                                   Site 5
               20

               10

                0
                     May 22   June 25, 26   July 9, 10   August 2
                                                                     18
                                        Date
5 Day Biological Oxygen Demand
           The higher the change, the worse the water quality.
      6


      5

                                                                 Site 1
      4                                                          Site 2
PPM


                                                                 Site 3
      3                                                          Site 4
                                                                 Site 6
      2                                                          Site 5


      1


      0
          May 22     June 25, 26    July 9,10      August 2       19
                                Date
Nitrates
      50

      45

      40

      35                                                  Site 1
      30                                                  Site 2
PPM


                                                          Site 3
      25
                                                          Site 4
      20
                                                          Site 6
      15                                                  Site 5

      10

      5

      0
           May 22   June 25, 26   July 9, 10   August 2
                                                           20
                              Date
Nitrates
      60


      50


      40                                                            Site 1
                                                                    Site 2
PPM


      30                                                            Site 3
                                                                    Site 4
                                                                    Site 6
      20
                                                                    Site 5

      10


      0
           2002 2003 2004 2005 2006 2007 2008 2009 2010 2011 2012
                                                                     21
                                    Date
Phosphates
      1.8

      1.6

      1.4

      1.2                                                     Site 1
                                                              Site 2
       1
PPM


                                                              Site 3
      0.8                                                     Site 4

      0.6                                                     Site 6
                                                              Site 5
      0.4

      0.2

       0
            May 22   June 25, 26      July 9, 10   August 2
                                                               22
                                   Date
WQI Averages by Site
      70                                                               Good


      65


      60
                                                                       Medium
WQI


      55


      50

                                                                       Bad
      45
           Site 1    Site 2     Site 3    Site 4   Site 6     Site 5
                2003 Averages      2004 Averages    2005 Averages
                2006 Averages      2007 Averages    2008 Averages       23
                2009 Averages      2010 Average     2011 Average
                2012 Averages
Total WQI Averages by Year
                                                                                 Good
      70


      65


      60
                                                                                 Medium
WQI


      55


      50
                                                                                 Bad

      45
           2003   2004   2005   2006   2007   2008   2009   2010   2011   2012


                                          WQI                                     24
2003 - 2012 Chemical Test Average Comparisons
30
                                                            2003 Averages
                                                            2004 Averages
25                                                          2005 Averages
                                                            2006 Averages
                                                            2007 Averages
20
                                                            2008 Averages
                                                            2009 Averages
15                                                          2010 Average
                                                            2011 Average
                                                            2012 Averages
10


5


0
     Total Rainfall Inches   Discharge CFS   Nitrates PPM   pH         25
2003 - 2012 Chemical Test Average
                  Comparisons
 3                                                  2003
                                                    Averages
                                                    2004
2.5
                                                    Averages
                                                    2005
 2                                                  Averages
                                                    2006
                                                    Averages
1.5                                                 2007
                                                    Averages

 1


0.5


 0
      Phosphates ppm   B.O.D. ppm   Change in Temp. Celcius

                                                               26
2003 - 2012 Chemical Test Average Comparisons
1200                                                                     2003 Averages
       ~ 2006 Fecal Coliform Average
                                                                         2004 Averages
       8,058 Col/100 mL
                                                                         2005 Averages
1000
       ~ 2010 Fecal Coliform                                             2006 Averages
       Average 3,648 Col/100 mL                                          2007 Averages
800                                                                      2008 Averages
                                                                         2009 Averages
                                                                         2010 Average
600                                                                      2011 Average
                                                                         2012 Averages
400


200


  0
       D.O. % Sat.   Turbidity JTU    Fecal Coliform Total Solids mg/L
                                                                                27
                                     Colonies/100 mL
Chemical Test Conclusions
• Nitrates down this year (lowest in 6
  years)
• Total solids on a downward trend since
  2004
• BOD has been decreasing since 2003
• Overall water quality improved over last
  few years
• Correlation between rainfall and WQI
  (2009 and 2012)                         28
Macro Invertebrates
             Somewhat
Sensiti       Sensitive    Tolera
ve                         nt


                               29
Beaver-Shell Creek Comparison
                 2012
8

7

6

5                                        Beaver Creek
                                         Shell Creek
4

3

2

1

0                                                  30
    pH   Nitrates   Phosphates   B.O.D
Beaver-Shell Creek Comparison
                   2012
700

600

500

400                                                     Beaver Creek
                                                        Shell Creek
300

200

100

 0
      Turbidity    Fecal     Total Solids D.O. % Sat.
                                                                31
                  Coliform
Beaver-Shell Creek WQI Comparison
             70
      Good
             60

  Medium 50


             40

      Bad 30
WQI


             20

             10

             0
                  Summer    Summer    Summer    Summer    Summer    May   June   July   August
                  Average   Average   Average   Average   Average
                    08        09        10        11        12

Beaver Creek Average WQI                                                                  32
Shell Creek Average WQI
Student Scientists in Action


                          33
34
35
36
37
Website

 • http://www.newman.esu8.org/
         • Click “Activities”
    • Click “Watershed Project”
  • Click “Watershed Homepage”
• You can see our data and further
     information concerning this
      project, including pictures.
                                     38
Thank You To:
 • Lower Platte North Natural
       Resource District

      • PrairieLand RC&D

        • Dan Gillespie

• Natural Resource Conservation
             Service

  • Nebraska Department of
     Environmental Quality        39

More Related Content

Similar to NG Shell Creek Data Powerpoint 2012 (8)

NG Shell Creek Data Powerpoint 2003
NG Shell Creek Data Powerpoint 2003NG Shell Creek Data Powerpoint 2003
NG Shell Creek Data Powerpoint 2003
 
NG Shell Creek Data Powerpoint 2002
NG Shell Creek Data Powerpoint 2002NG Shell Creek Data Powerpoint 2002
NG Shell Creek Data Powerpoint 2002
 
NG Shell Creek Data Powerpoint 2005
NG Shell Creek Data Powerpoint 2005NG Shell Creek Data Powerpoint 2005
NG Shell Creek Data Powerpoint 2005
 
Powerpoint 2014
Powerpoint 2014Powerpoint 2014
Powerpoint 2014
 
Powerpoint 2017 shell creek
Powerpoint 2017 shell creekPowerpoint 2017 shell creek
Powerpoint 2017 shell creek
 
NG Shell Creek Data Powerpoint 2013
NG Shell Creek Data Powerpoint 2013NG Shell Creek Data Powerpoint 2013
NG Shell Creek Data Powerpoint 2013
 
Plants water&soil
Plants water&soilPlants water&soil
Plants water&soil
 
Pathogen Management Modelling - APEG
Pathogen Management Modelling - APEGPathogen Management Modelling - APEG
Pathogen Management Modelling - APEG
 

Recently uploaded

Adversarial Attention Modeling for Multi-dimensional Emotion Regression.pdf
Adversarial Attention Modeling for Multi-dimensional Emotion Regression.pdfAdversarial Attention Modeling for Multi-dimensional Emotion Regression.pdf
Adversarial Attention Modeling for Multi-dimensional Emotion Regression.pdf
Po-Chuan Chen
 
Industrial Training Report- AKTU Industrial Training Report
Industrial Training Report- AKTU Industrial Training ReportIndustrial Training Report- AKTU Industrial Training Report
Industrial Training Report- AKTU Industrial Training Report
Avinash Rai
 
Additional Benefits for Employee Website.pdf
Additional Benefits for Employee Website.pdfAdditional Benefits for Employee Website.pdf
Additional Benefits for Employee Website.pdf
joachimlavalley1
 

Recently uploaded (20)

Advances in production technology of Grapes.pdf
Advances in production technology of Grapes.pdfAdvances in production technology of Grapes.pdf
Advances in production technology of Grapes.pdf
 
Jose-Rizal-and-Philippine-Nationalism-National-Symbol-2.pptx
Jose-Rizal-and-Philippine-Nationalism-National-Symbol-2.pptxJose-Rizal-and-Philippine-Nationalism-National-Symbol-2.pptx
Jose-Rizal-and-Philippine-Nationalism-National-Symbol-2.pptx
 
NLC-2024-Orientation-for-RO-SDO (1).pptx
NLC-2024-Orientation-for-RO-SDO (1).pptxNLC-2024-Orientation-for-RO-SDO (1).pptx
NLC-2024-Orientation-for-RO-SDO (1).pptx
 
Students, digital devices and success - Andreas Schleicher - 27 May 2024..pptx
Students, digital devices and success - Andreas Schleicher - 27 May 2024..pptxStudents, digital devices and success - Andreas Schleicher - 27 May 2024..pptx
Students, digital devices and success - Andreas Schleicher - 27 May 2024..pptx
 
Home assignment II on Spectroscopy 2024 Answers.pdf
Home assignment II on Spectroscopy 2024 Answers.pdfHome assignment II on Spectroscopy 2024 Answers.pdf
Home assignment II on Spectroscopy 2024 Answers.pdf
 
Adversarial Attention Modeling for Multi-dimensional Emotion Regression.pdf
Adversarial Attention Modeling for Multi-dimensional Emotion Regression.pdfAdversarial Attention Modeling for Multi-dimensional Emotion Regression.pdf
Adversarial Attention Modeling for Multi-dimensional Emotion Regression.pdf
 
Danh sách HSG Bộ môn cấp trường - Cấp THPT.pdf
Danh sách HSG Bộ môn cấp trường - Cấp THPT.pdfDanh sách HSG Bộ môn cấp trường - Cấp THPT.pdf
Danh sách HSG Bộ môn cấp trường - Cấp THPT.pdf
 
Industrial Training Report- AKTU Industrial Training Report
Industrial Training Report- AKTU Industrial Training ReportIndustrial Training Report- AKTU Industrial Training Report
Industrial Training Report- AKTU Industrial Training Report
 
Benefits and Challenges of Using Open Educational Resources
Benefits and Challenges of Using Open Educational ResourcesBenefits and Challenges of Using Open Educational Resources
Benefits and Challenges of Using Open Educational Resources
 
Basic Civil Engg Notes_Chapter-6_Environment Pollution & Engineering
Basic Civil Engg Notes_Chapter-6_Environment Pollution & EngineeringBasic Civil Engg Notes_Chapter-6_Environment Pollution & Engineering
Basic Civil Engg Notes_Chapter-6_Environment Pollution & Engineering
 
The Benefits and Challenges of Open Educational Resources
The Benefits and Challenges of Open Educational ResourcesThe Benefits and Challenges of Open Educational Resources
The Benefits and Challenges of Open Educational Resources
 
UNIT – IV_PCI Complaints: Complaints and evaluation of complaints, Handling o...
UNIT – IV_PCI Complaints: Complaints and evaluation of complaints, Handling o...UNIT – IV_PCI Complaints: Complaints and evaluation of complaints, Handling o...
UNIT – IV_PCI Complaints: Complaints and evaluation of complaints, Handling o...
 
How to Split Bills in the Odoo 17 POS Module
How to Split Bills in the Odoo 17 POS ModuleHow to Split Bills in the Odoo 17 POS Module
How to Split Bills in the Odoo 17 POS Module
 
Mattingly "AI & Prompt Design: Limitations and Solutions with LLMs"
Mattingly "AI & Prompt Design: Limitations and Solutions with LLMs"Mattingly "AI & Prompt Design: Limitations and Solutions with LLMs"
Mattingly "AI & Prompt Design: Limitations and Solutions with LLMs"
 
Synthetic Fiber Construction in lab .pptx
Synthetic Fiber Construction in lab .pptxSynthetic Fiber Construction in lab .pptx
Synthetic Fiber Construction in lab .pptx
 
Additional Benefits for Employee Website.pdf
Additional Benefits for Employee Website.pdfAdditional Benefits for Employee Website.pdf
Additional Benefits for Employee Website.pdf
 
MARUTI SUZUKI- A Successful Joint Venture in India.pptx
MARUTI SUZUKI- A Successful Joint Venture in India.pptxMARUTI SUZUKI- A Successful Joint Venture in India.pptx
MARUTI SUZUKI- A Successful Joint Venture in India.pptx
 
Matatag-Curriculum and the 21st Century Skills Presentation.pptx
Matatag-Curriculum and the 21st Century Skills Presentation.pptxMatatag-Curriculum and the 21st Century Skills Presentation.pptx
Matatag-Curriculum and the 21st Century Skills Presentation.pptx
 
NCERT Solutions Power Sharing Class 10 Notes pdf
NCERT Solutions Power Sharing Class 10 Notes pdfNCERT Solutions Power Sharing Class 10 Notes pdf
NCERT Solutions Power Sharing Class 10 Notes pdf
 
slides CapTechTalks Webinar May 2024 Alexander Perry.pptx
slides CapTechTalks Webinar May 2024 Alexander Perry.pptxslides CapTechTalks Webinar May 2024 Alexander Perry.pptx
slides CapTechTalks Webinar May 2024 Alexander Perry.pptx
 

NG Shell Creek Data Powerpoint 2012

  • 1. 2012 Shell Creek Watershed Research Group Advisors: Mark Seier, Karen Malmkar, and Kylie Sweeter Researchers: Alisha Dunlap, Ciera Afrank, Kendra Nelson, Darienne Pokorny, Jason Kaufman, Demi Edgell, Jacob Haase, John O’Brien, Brock Donelson, Billy O’Brien, Megan Nelson, Brooke Pieke, Alex Wiese, Garrett Flamme, Parker Wallin, Sadie Wallin, Brett Weinman 1
  • 2. Shell Creek and Loseke-Taylor Creek Watersheds (with Township-Range Labels) Lower Platte North Natural Resources District South Branch North Branch 6 2
  • 3. Below Newman Grove Above Newman Grove 6 3
  • 4. Below Lindsay 6 West Platte Center 4
  • 5. W.Q.I. • The Water Quality Index was developed by the National Sanitation Foundation as a standard system to compare different bodies of water. • To determine the WQI, a series of nine tests were performed. These tests were: dissolved oxygen, fecal coliform, pH, Biological Oxygen Demand (BOD), temperature, total phosphate, nitrates, turbidity, and total solids. We also did a water discharge test which we use to measure the flow of the creek in cubic feet per second. 5
  • 6. • After the tests are completed, the WQI for each section of the creek can be computed. • To formulate the WQI, we first computed Q- values. • We multiply this number by a weighting factor, which provides a measure of the relative importance of each test to overall water quality. • The water quality index ranges from zero to 100. - 0 - 25 is very bad - 25 - 50 is bad - 50 - 70 is medium - 70 - 90 is good - 90 - 100 is excellent • The bio-indicator tests are not part of the W.Q.I., but do give us a water quality rating. 6
  • 8. Sample W.Q.I. Form Weighting Test Results Q-value Factor Total DO % sat. 0.17 Fecal Coliform col/100 mL 0.16 pH units 0.11 BOD mg/L 0.11 Temperature change in C 0.1 Total Phosphate mg/L 0.1 Nitrates mg/L 0.1 Turbidity JTU 0.08 Total Solids mg/L 0.07 Overall Water Quality Index ___ 8
  • 9. 2012 Precipitation 4 3.5 3 2.5 2 Inches 1.5 1 0.5 0 May June July August Date 9
  • 10. pH 8.4 8.1 Site 1 7.8 Site 2 pH Level 7.5 Site 3 Site 4 7.2 Site 6 Site 5 6.9 6.6 6.3 May 22 June 25, 26 July 9, 10 August 2 10 Date
  • 11. Change in Water Temperature The higher the change, the worse the water quality. 4 3 2 Site 1 Degrees Celcius 1 Site 2 Site 3 0 Site 4 -1 Site 6 Site 5 -2 -3 -4 May 22 June 25, 26 July 9, 10 August 2 11 Date
  • 12. Total Solids The higher the concentration, the worse the water quality. 700 600 500 Site 1 Site 2 mg/L 400 Site 3 Site 4 300 Site 6 Site 5 200 100 0 May 22 June 25, 26 July 9,10 August 2 12 Date
  • 14. Fecal Coliform 4,000 3,500 3,000 Colonies/100 mL Site 1 2,500 Site 2 2,000 Site 3 Site 4 1,500 Site 6 Site 5 1,000 500 0 May 22 June 25, 26 July 9, 10 August 2 14 Date
  • 15. Fecal Coliform 1800 In 2006 In 2010 In 2012 Site 1- 21,418 Site 1- 11,387 Site 6- 4,000 1600 Site 5- 17,800 Site 6- 2,313 1400 Colonies/100 mL 1200 Site 1 Site 2 1000 Site 3 800 Site 4 Site 6 600 Site 5 400 200 0 2003 2004 2005 2006 2007 2008 2009 2010 2011 2012 15 Date
  • 16. Flow 120 100 Cubic Feet Per Second 80 Site 1 Site 2 Site 3 60 Site 4 Site 6 40 Site 5 20 0 May 22 June 25, 26 July 9, 10 August 2 16 Date
  • 17. Turbidity 200 180 160 140 Site 1 120 Site 2 JTU's Site 3 100 Site 4 80 Site 6 60 Site 5 40 20 0 May 22 June 25, 26 July 9,10 August 2 17 Date
  • 18. Dissolved Oxygen 100 90 80 70 Site 1 % Saturation 60 Site 2 Site 3 50 Site 4 40 Site 6 30 Site 5 20 10 0 May 22 June 25, 26 July 9, 10 August 2 18 Date
  • 19. 5 Day Biological Oxygen Demand The higher the change, the worse the water quality. 6 5 Site 1 4 Site 2 PPM Site 3 3 Site 4 Site 6 2 Site 5 1 0 May 22 June 25, 26 July 9,10 August 2 19 Date
  • 20. Nitrates 50 45 40 35 Site 1 30 Site 2 PPM Site 3 25 Site 4 20 Site 6 15 Site 5 10 5 0 May 22 June 25, 26 July 9, 10 August 2 20 Date
  • 21. Nitrates 60 50 40 Site 1 Site 2 PPM 30 Site 3 Site 4 Site 6 20 Site 5 10 0 2002 2003 2004 2005 2006 2007 2008 2009 2010 2011 2012 21 Date
  • 22. Phosphates 1.8 1.6 1.4 1.2 Site 1 Site 2 1 PPM Site 3 0.8 Site 4 0.6 Site 6 Site 5 0.4 0.2 0 May 22 June 25, 26 July 9, 10 August 2 22 Date
  • 23. WQI Averages by Site 70 Good 65 60 Medium WQI 55 50 Bad 45 Site 1 Site 2 Site 3 Site 4 Site 6 Site 5 2003 Averages 2004 Averages 2005 Averages 2006 Averages 2007 Averages 2008 Averages 23 2009 Averages 2010 Average 2011 Average 2012 Averages
  • 24. Total WQI Averages by Year Good 70 65 60 Medium WQI 55 50 Bad 45 2003 2004 2005 2006 2007 2008 2009 2010 2011 2012 WQI 24
  • 25. 2003 - 2012 Chemical Test Average Comparisons 30 2003 Averages 2004 Averages 25 2005 Averages 2006 Averages 2007 Averages 20 2008 Averages 2009 Averages 15 2010 Average 2011 Average 2012 Averages 10 5 0 Total Rainfall Inches Discharge CFS Nitrates PPM pH 25
  • 26. 2003 - 2012 Chemical Test Average Comparisons 3 2003 Averages 2004 2.5 Averages 2005 2 Averages 2006 Averages 1.5 2007 Averages 1 0.5 0 Phosphates ppm B.O.D. ppm Change in Temp. Celcius 26
  • 27. 2003 - 2012 Chemical Test Average Comparisons 1200 2003 Averages ~ 2006 Fecal Coliform Average 2004 Averages 8,058 Col/100 mL 2005 Averages 1000 ~ 2010 Fecal Coliform 2006 Averages Average 3,648 Col/100 mL 2007 Averages 800 2008 Averages 2009 Averages 2010 Average 600 2011 Average 2012 Averages 400 200 0 D.O. % Sat. Turbidity JTU Fecal Coliform Total Solids mg/L 27 Colonies/100 mL
  • 28. Chemical Test Conclusions • Nitrates down this year (lowest in 6 years) • Total solids on a downward trend since 2004 • BOD has been decreasing since 2003 • Overall water quality improved over last few years • Correlation between rainfall and WQI (2009 and 2012) 28
  • 29. Macro Invertebrates Somewhat Sensiti Sensitive Tolera ve nt 29
  • 30. Beaver-Shell Creek Comparison 2012 8 7 6 5 Beaver Creek Shell Creek 4 3 2 1 0 30 pH Nitrates Phosphates B.O.D
  • 31. Beaver-Shell Creek Comparison 2012 700 600 500 400 Beaver Creek Shell Creek 300 200 100 0 Turbidity Fecal Total Solids D.O. % Sat. 31 Coliform
  • 32. Beaver-Shell Creek WQI Comparison 70 Good 60 Medium 50 40 Bad 30 WQI 20 10 0 Summer Summer Summer Summer Summer May June July August Average Average Average Average Average 08 09 10 11 12 Beaver Creek Average WQI 32 Shell Creek Average WQI
  • 34. 34
  • 35. 35
  • 36. 36
  • 37. 37
  • 38. Website • http://www.newman.esu8.org/ • Click “Activities” • Click “Watershed Project” • Click “Watershed Homepage” • You can see our data and further information concerning this project, including pictures. 38
  • 39. Thank You To: • Lower Platte North Natural Resource District • PrairieLand RC&D • Dan Gillespie • Natural Resource Conservation Service • Nebraska Department of Environmental Quality 39