
Download as PDF, PPTX


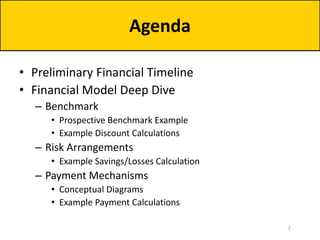
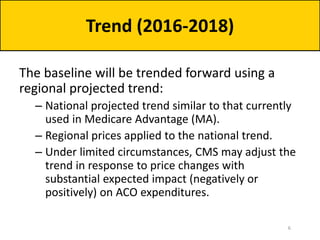
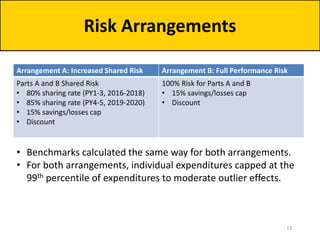
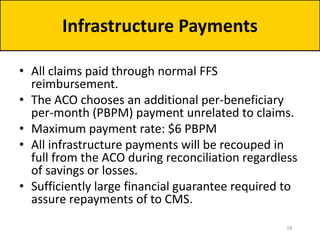
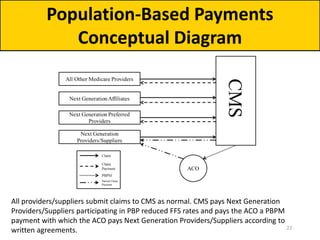
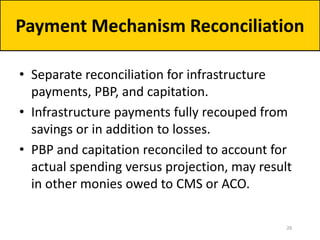
![• Once the baseline has been calculated, trended, and risk-adjusted,
CMS will apply a discount.
• Summing the following components creates each ACO’s discount:
– Quality:
• Range: 2.0% to 3.0%
• Formula: [2.0 + (1- quality score)]%
– Regional Efficiency:
• Range: -1% to 1%
• Compares the ACO’s risk-adjusted historical per capita baseline to a risk-
adjusted regional FFS per capita baseline.
– National Efficiency:
• Range: -0.5% to 0.5%
• Compares the risk-adjusted regional FFS baseline to risk-adjusted national FFS
per capita spending.
• Total discount range: 0.5% to 4.5%
Discount (2016-2018)](https://image.slidesharecdn.com/nextgenerationaco-odf3slides33115-150403071009-conversion-gate01/85/Open-Door-Forum-Next-Generation-ACO-Model-Financial-Methodology-and-Related-Issues-8-320.jpg)
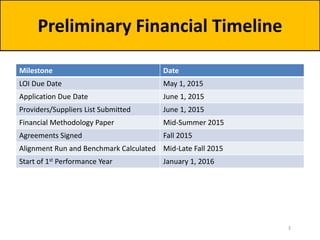
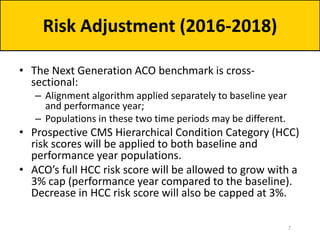
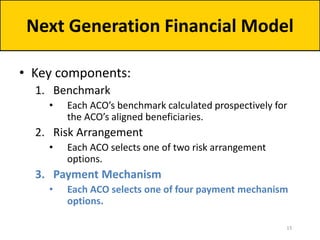
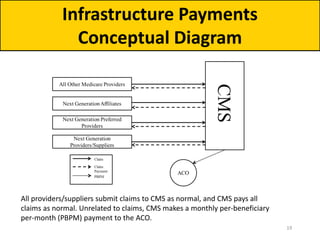
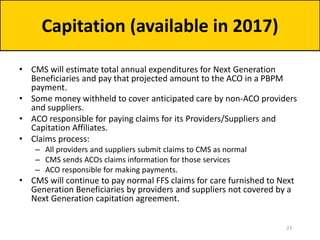
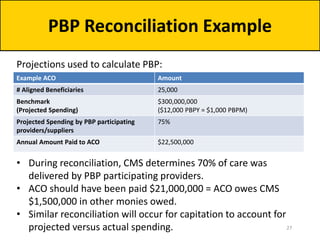
![Example ACO A
Discount Calculation
Calculating the Discount Illustrative
Amount
1. Quality null
Quality Score 100%
Quality Component 2.0%
2. Regional Efficiency null
ACO Risk-Adjusted Baseline $8,000
Regional FFS Risk-Adjusted Baseline $8,500
Regional Efficiency Ratio 0.94
Regional Efficiency Discount Component -0.6%
3. National Efficiency null
Regional FFS Risk-Adjusted Baseline $8,500
National FFS Risk-Adjusted Baseline $10,500
National Efficiency Ratio 0.81
National Efficiency Discount Component -0.5%
Example ACO A Discount 0.9%
• In PY1, 100% will be used as the
quality score for all Next
Generation ACOs:
• [2.0 + (1-1.0)]%
• Example ACO A’s historic
baseline expenditures are 6%
less expensive than regional
FFS—ACO is rewarded for this
attainment by having the
discount reduced by 0.6%.
• ACO is in a very low cost region
(19% below national FFS)—ACO
is rewarded with 0.5% discount
reduction (the maximum
regional-to-national FFS
discount reduction).
9](https://image.slidesharecdn.com/nextgenerationaco-odf3slides33115-150403071009-conversion-gate01/85/Open-Door-Forum-Next-Generation-ACO-Model-Financial-Methodology-and-Related-Issues-9-320.jpg)
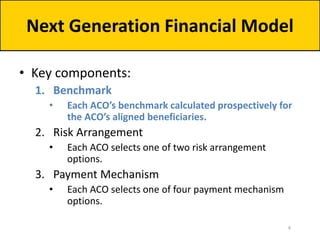
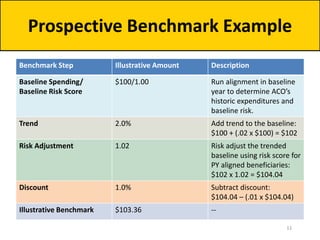
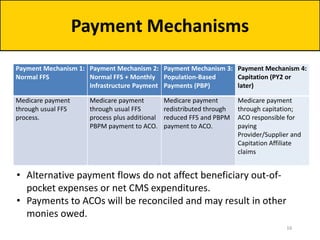
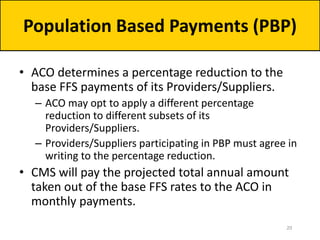
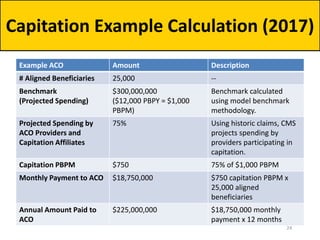
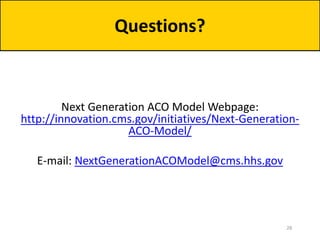
![Example ACO B
Discount Calculation
Calculating the Discount Illustrative
Amount
1. Quality null
Quality Score 100%
Quality Component 2.0%
2. Regional Efficiency null
ACO Risk-Adjusted Baseline $12,000
Regional FFS Risk-Adjusted Baseline $13,000
Regional Efficiency Ratio 0.92
Regional Efficiency Discount Component -0.8%
3. National Efficiency null
Regional FFS Risk-Adjusted Baseline $13,000
National FFS Risk-Adjusted Baseline $11,500
National Efficiency Ratio 1.13
National Efficiency Discount Component 0.4%
Example ACO B Discount 1.6%
• In PY1, 100% will be used as the
quality score for all Next
Generation ACOs:
• [2.0 + (1-1.0)]%
• Example ACO B’s historic
baseline expenditures are 8%
less expensive than regional
FFS—ACO is rewarded for this
attainment by having the
discount reduced by 0.8%.
• ACO is in a region whose
spending is 13% higher than
national FFS—ACO’s discount is
increased by 0.4% to reflect this
regional-to-national FFS
differential.
10](https://image.slidesharecdn.com/nextgenerationaco-odf3slides33115-150403071009-conversion-gate01/85/Open-Door-Forum-Next-Generation-ACO-Model-Financial-Methodology-and-Related-Issues-10-320.jpg)
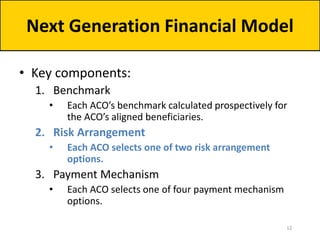
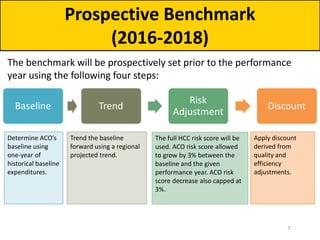
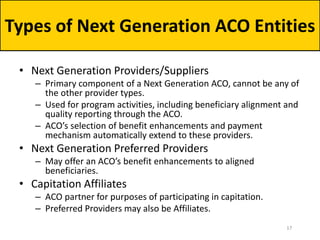
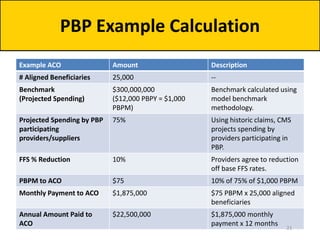
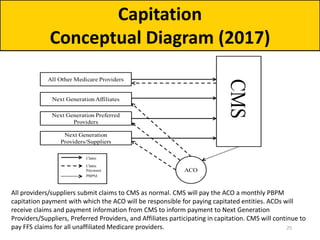
![Example Savings/Losses Calculation
Shared Savings/Loss
Reconciliation
Arrangement A: Increased
Shared Risk
Arrangement B: Full
Performance Risk
Illustrative Benchmark $100,000,000 $100,000,000
Sharing Rate 80% 100%
Savings/Losses Cap 15% 15%
Maximum
Savings/Losses
+/- $12,000,000
[80% x (15% x $100,000,000)]
+/- $15,000,000
[100% x (15% x $100,000,000)]
Actual PY Expenditures $97,000,000 $97,000,000
Shared Savings Payment $2,400,000 $3,000,000
Actual PY Expenditures $103,000,000 $103,000,000
Shared Losses Owed $2,400,000 $3,000,000
• Savings or losses determined by comparing total Parts A and B
spending for aligned beneficiaries to the benchmark.
• Risk arrangement determines ACO’s share of savings or losses. 14](https://image.slidesharecdn.com/nextgenerationaco-odf3slides33115-150403071009-conversion-gate01/85/Open-Door-Forum-Next-Generation-ACO-Model-Financial-Methodology-and-Related-Issues-14-320.jpg)
The document outlines the Next Generation Accountable Care Organization (ACO) Model's financial framework established during a forum on March 31, 2015. It details the components of the financial model, including benchmarks for ACOs, risk arrangements, payment mechanisms, and discount calculations for performance years 2016-2018. Key milestones and timelines for ACO applications and financial methodologies are also provided, aiming to incentivize quality and efficiency in healthcare practices.


