
Download as PDF, PPTX


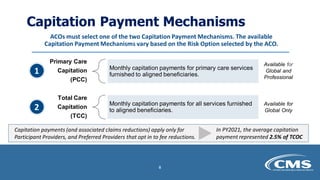
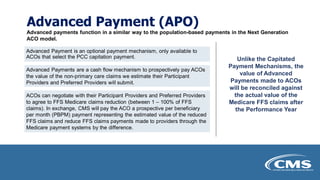
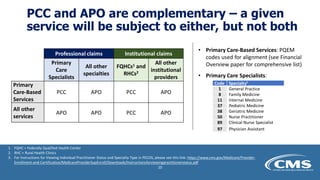

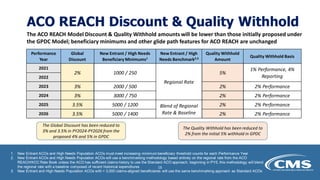


The ACO REACH model financial methodology updates webinar on March 28, 2022, provided an overview of new financial features, including benchmarking and capitation payment mechanisms, aimed at enhancing equity and community health. Key topics included how benchmarks for shared savings or losses are set, capitation options, advanced payments, and health equity adjustments for providers serving underserved populations. Detailed methodology papers and additional information are expected to be published by CMS in summer 2022.


