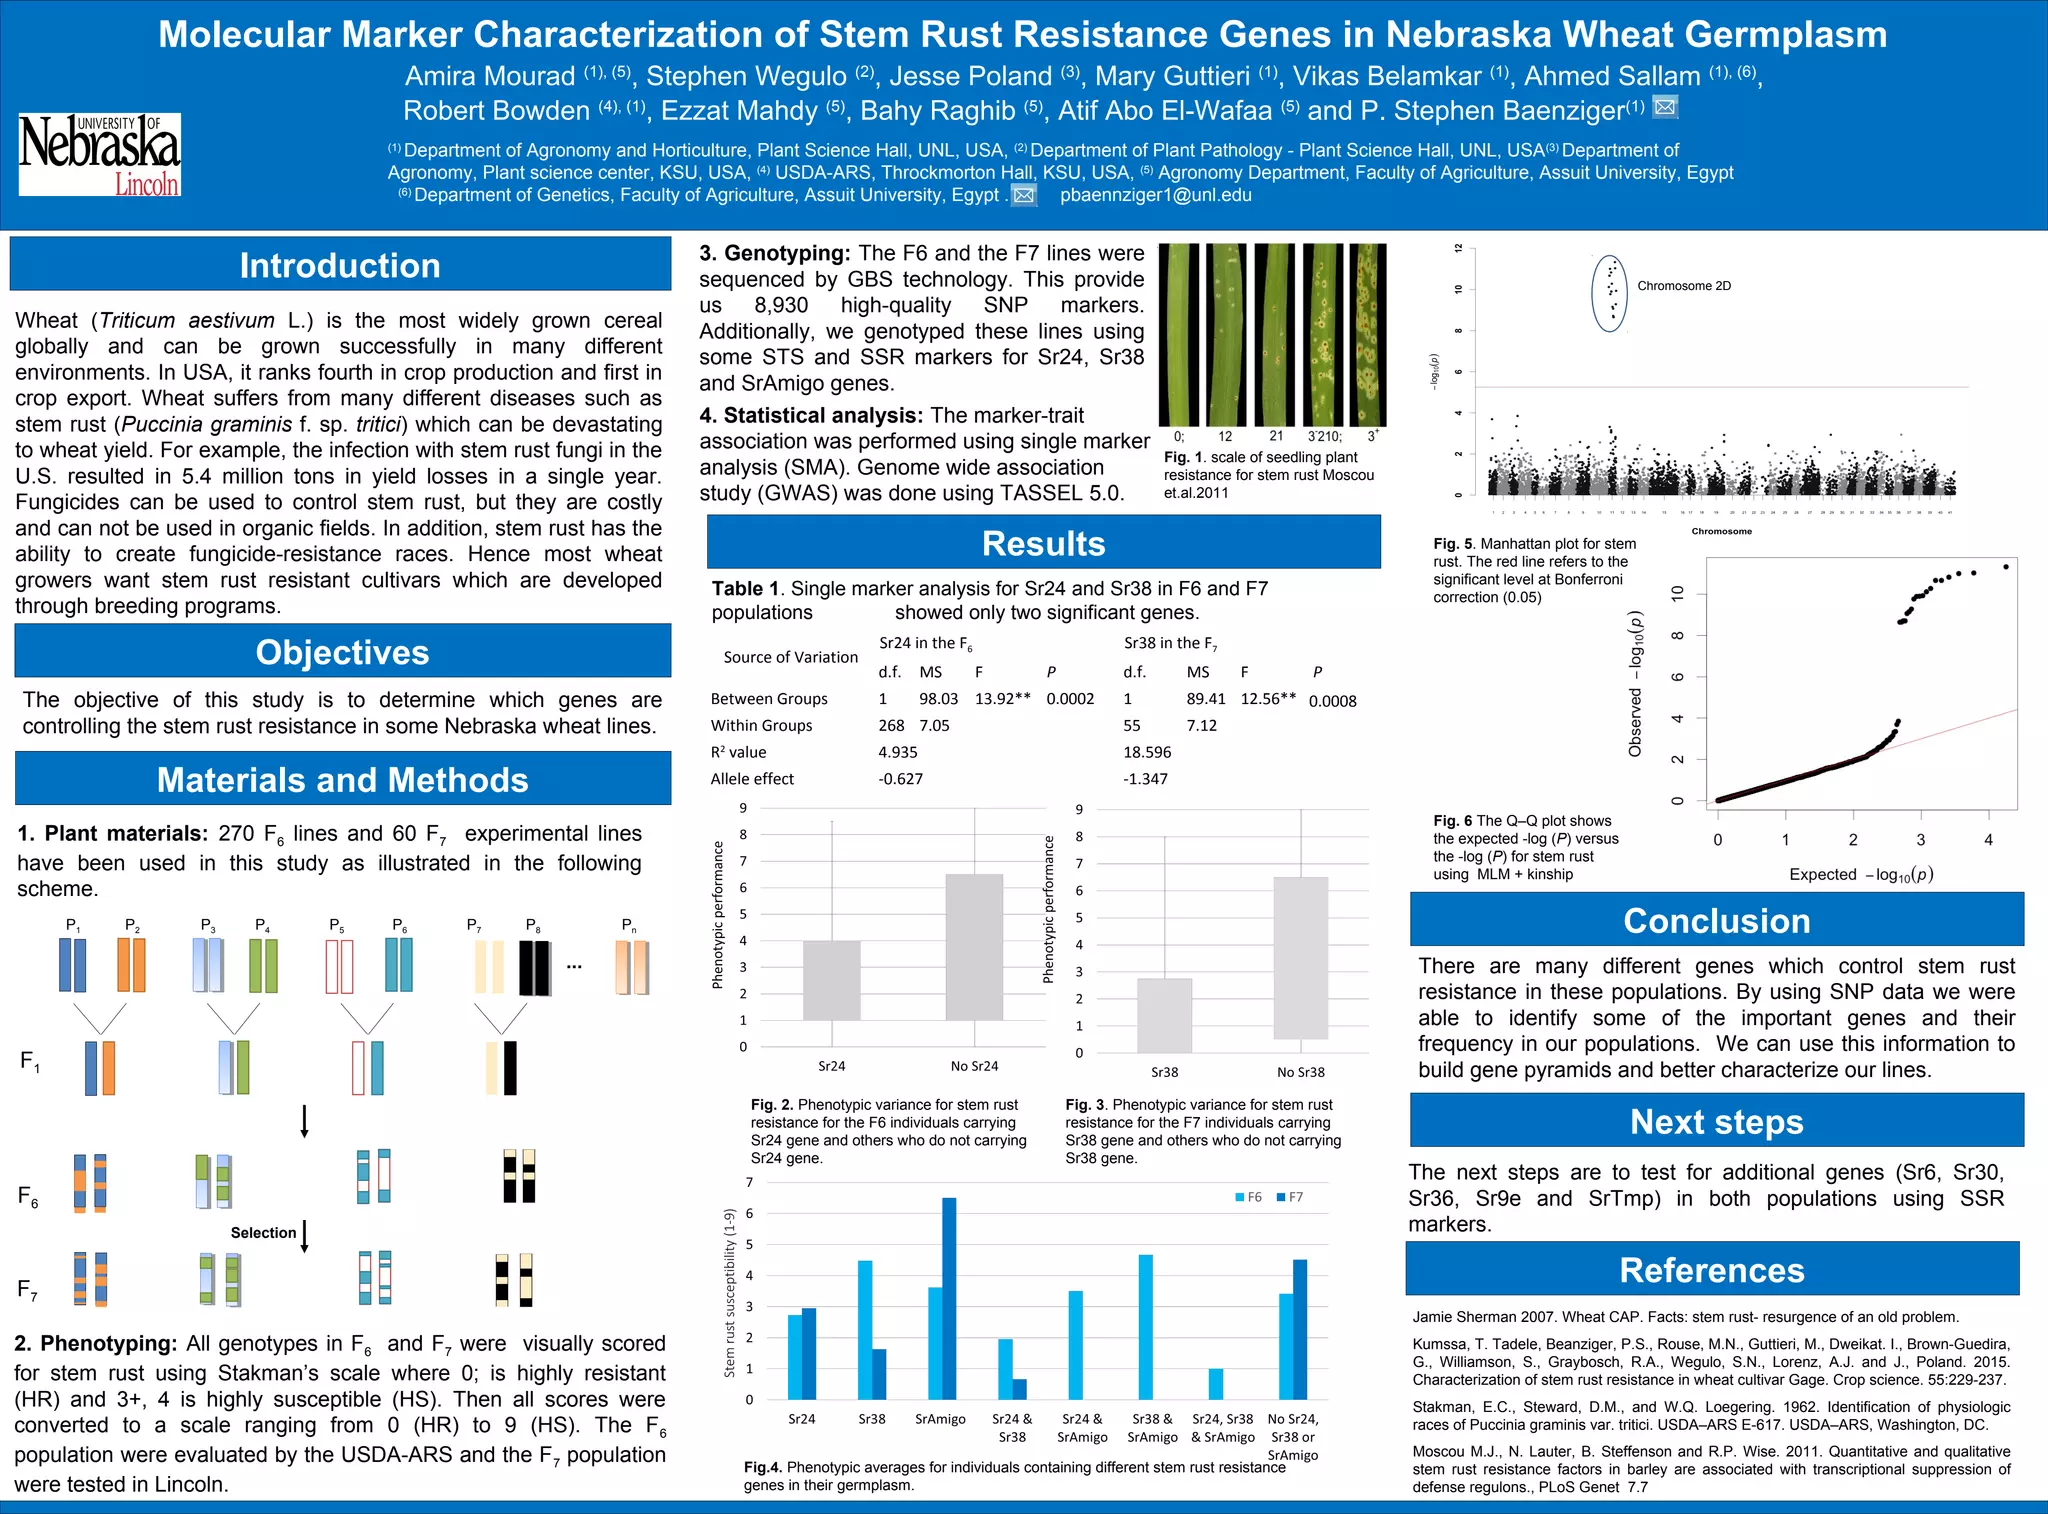
Molecular Marker Characterization of Stem Rust Resistance Genes in Nebraska Wheat Germplasm
Amira Mourad (1), (5)
, Stephen Wegulo (2)
, Jesse Poland (3)
, Mary Guttieri (1)
, Vikas Belamkar (1)
, Ahmed Sallam (1), (6)
,
Robert Bowden (4), (1)
, Ezzat Mahdy (5)
, Bahy Raghib (5)
, Atif Abo El-Wafaa (5)
and P. Stephen Baenziger(1)
(1)
Department of Agronomy and Horticulture, Plant Science Hall, UNL, USA, (2)
Department of Plant Pathology - Plant Science Hall, UNL, USA(3)
Department of
Agronomy, Plant science center, KSU, USA, (4)
USDA-ARS, Throckmorton Hall, KSU, USA, (5)
Agronomy Department, Faculty of Agriculture, Assuit University, Egypt
(6)
Department of Genetics, Faculty of Agriculture, Assuit University, Egypt . pbaennziger1@unl.edu
Introduction
Wheat (Triticum aestivum L.) is the most widely grown cereal
globally and can be grown successfully in many different
environments. In USA, it ranks fourth in crop production and first in
crop export. Wheat suffers from many different diseases such as
stem rust (Puccinia graminis f. sp. tritici) which can be devastating
to wheat yield. For example, the infection with stem rust fungi in the
U.S. resulted in 5.4 million tons in yield losses in a single year.
Fungicides can be used to control stem rust, but they are costly
and can not be used in organic fields. In addition, stem rust has the
ability to create fungicide-resistance races. Hence most wheat
growers want stem rust resistant cultivars which are developed
through breeding programs.
Objectives
The objective of this study is to determine which genes are
controlling the stem rust resistance in some Nebraska wheat lines.
Materials and Methods
1. Plant materials: 270 F6 lines and 60 F7 experimental lines
have been used in this study as illustrated in the following
scheme.
2. Phenotyping: All genotypes in F6 and F7 were visually scored
for stem rust using Stakman’s scale where 0; is highly resistant
(HR) and 3+, 4 is highly susceptible (HS). Then all scores were
converted to a scale ranging from 0 (HR) to 9 (HS). The F6
population were evaluated by the USDA-ARS and the F7 population
were tested in Lincoln.
3. Genotyping: The F6 and the F7 lines were
sequenced by GBS technology. This provide
us 8,930 high-quality SNP markers.
Additionally, we genotyped these lines using
some STS and SSR markers for Sr24, Sr38
and SrAmigo genes.
4. Statistical analysis: The marker-trait
association was performed using single marker
analysis (SMA). Genome wide association
study (GWAS) was done using TASSEL 5.0.
P1 P4 P7P6P5P3P2 PnP8
F1
F6
Selection
F7
...
Fig. 1. scale of seedling plant
resistance for stem rust Moscou
et.al.2011
Results
Table 1. Single marker analysis for Sr24 and Sr38 in F6 and F7
populations showed only two significant genes.
Source of Variation
Sr24 in the F6 Sr38 in the F7
d.f. MS F P d.f. MS F P
Between Groups 1 98.03 13.92** 0.0002 1 89.41 12.56** 0.0008
Within Groups 268 7.05 55 7.12
R2
value 4.935 18.596
Allele effect -0.627 -1.347
Fig. 2. Phenotypic variance for stem rust
resistance for the F6 individuals carrying
Sr24 gene and others who do not carrying
Sr24 gene.
Fig. 3. Phenotypic variance for stem rust
resistance for the F7 individuals carrying
Sr38 gene and others who do not carrying
Sr38 gene.
Fig.4. Phenotypic averages for individuals containing different stem rust resistance
genes in their germplasm.
Fig. 6 The Q–Q plot shows
the expected -log (P) versus
the -log (P) for stem rust
using MLM + kinship
References
Conclusion
There are many different genes which control stem rust
resistance in these populations. By using SNP data we were
able to identify some of the important genes and their
frequency in our populations. We can use this information to
build gene pyramids and better characterize our lines.
.
Jamie Sherman 2007. Wheat CAP. Facts: stem rust- resurgence of an old problem.
Kumssa, T. Tadele, Beanziger, P.S., Rouse, M.N., Guttieri, M., Dweikat. I., Brown-Guedira,
G., Williamson, S., Graybosch, R.A., Wegulo, S.N., Lorenz, A.J. and J., Poland. 2015.
Characterization of stem rust resistance in wheat cultivar Gage. Crop science. 55:229-237.
Stakman, E.C., Steward, D.M., and W.Q. Loegering. 1962. Identification of physiologic
races of Puccinia graminis var. tritici. USDA–ARS E-617. USDA–ARS, Washington, DC.
Moscou M.J., N. Lauter, B. Steffenson and R.P. Wise. 2011. Quantitative and qualitative
stem rust resistance factors in barley are associated with transcriptional suppression of
defense regulons., PLoS Genet 7.7
Next steps
The next steps are to test for additional genes (Sr6, Sr30,
Sr36, Sr9e and SrTmp) in both populations using SSR
markers.
Fig. 5. Manhattan plot for stem
rust. The red line refers to the
significant level at Bonferroni
correction (0.05)
Chromosome 2D

new size

  • 1.
    Molecular Marker Characterizationof Stem Rust Resistance Genes in Nebraska Wheat Germplasm Amira Mourad (1), (5) , Stephen Wegulo (2) , Jesse Poland (3) , Mary Guttieri (1) , Vikas Belamkar (1) , Ahmed Sallam (1), (6) , Robert Bowden (4), (1) , Ezzat Mahdy (5) , Bahy Raghib (5) , Atif Abo El-Wafaa (5) and P. Stephen Baenziger(1) (1) Department of Agronomy and Horticulture, Plant Science Hall, UNL, USA, (2) Department of Plant Pathology - Plant Science Hall, UNL, USA(3) Department of Agronomy, Plant science center, KSU, USA, (4) USDA-ARS, Throckmorton Hall, KSU, USA, (5) Agronomy Department, Faculty of Agriculture, Assuit University, Egypt (6) Department of Genetics, Faculty of Agriculture, Assuit University, Egypt . pbaennziger1@unl.edu Introduction Wheat (Triticum aestivum L.) is the most widely grown cereal globally and can be grown successfully in many different environments. In USA, it ranks fourth in crop production and first in crop export. Wheat suffers from many different diseases such as stem rust (Puccinia graminis f. sp. tritici) which can be devastating to wheat yield. For example, the infection with stem rust fungi in the U.S. resulted in 5.4 million tons in yield losses in a single year. Fungicides can be used to control stem rust, but they are costly and can not be used in organic fields. In addition, stem rust has the ability to create fungicide-resistance races. Hence most wheat growers want stem rust resistant cultivars which are developed through breeding programs. Objectives The objective of this study is to determine which genes are controlling the stem rust resistance in some Nebraska wheat lines. Materials and Methods 1. Plant materials: 270 F6 lines and 60 F7 experimental lines have been used in this study as illustrated in the following scheme. 2. Phenotyping: All genotypes in F6 and F7 were visually scored for stem rust using Stakman’s scale where 0; is highly resistant (HR) and 3+, 4 is highly susceptible (HS). Then all scores were converted to a scale ranging from 0 (HR) to 9 (HS). The F6 population were evaluated by the USDA-ARS and the F7 population were tested in Lincoln. 3. Genotyping: The F6 and the F7 lines were sequenced by GBS technology. This provide us 8,930 high-quality SNP markers. Additionally, we genotyped these lines using some STS and SSR markers for Sr24, Sr38 and SrAmigo genes. 4. Statistical analysis: The marker-trait association was performed using single marker analysis (SMA). Genome wide association study (GWAS) was done using TASSEL 5.0. P1 P4 P7P6P5P3P2 PnP8 F1 F6 Selection F7 ... Fig. 1. scale of seedling plant resistance for stem rust Moscou et.al.2011 Results Table 1. Single marker analysis for Sr24 and Sr38 in F6 and F7 populations showed only two significant genes. Source of Variation Sr24 in the F6 Sr38 in the F7 d.f. MS F P d.f. MS F P Between Groups 1 98.03 13.92** 0.0002 1 89.41 12.56** 0.0008 Within Groups 268 7.05 55 7.12 R2 value 4.935 18.596 Allele effect -0.627 -1.347 Fig. 2. Phenotypic variance for stem rust resistance for the F6 individuals carrying Sr24 gene and others who do not carrying Sr24 gene. Fig. 3. Phenotypic variance for stem rust resistance for the F7 individuals carrying Sr38 gene and others who do not carrying Sr38 gene. Fig.4. Phenotypic averages for individuals containing different stem rust resistance genes in their germplasm. Fig. 6 The Q–Q plot shows the expected -log (P) versus the -log (P) for stem rust using MLM + kinship References Conclusion There are many different genes which control stem rust resistance in these populations. By using SNP data we were able to identify some of the important genes and their frequency in our populations. We can use this information to build gene pyramids and better characterize our lines. . Jamie Sherman 2007. Wheat CAP. Facts: stem rust- resurgence of an old problem. Kumssa, T. Tadele, Beanziger, P.S., Rouse, M.N., Guttieri, M., Dweikat. I., Brown-Guedira, G., Williamson, S., Graybosch, R.A., Wegulo, S.N., Lorenz, A.J. and J., Poland. 2015. Characterization of stem rust resistance in wheat cultivar Gage. Crop science. 55:229-237. Stakman, E.C., Steward, D.M., and W.Q. Loegering. 1962. Identification of physiologic races of Puccinia graminis var. tritici. USDA–ARS E-617. USDA–ARS, Washington, DC. Moscou M.J., N. Lauter, B. Steffenson and R.P. Wise. 2011. Quantitative and qualitative stem rust resistance factors in barley are associated with transcriptional suppression of defense regulons., PLoS Genet 7.7 Next steps The next steps are to test for additional genes (Sr6, Sr30, Sr36, Sr9e and SrTmp) in both populations using SSR markers. Fig. 5. Manhattan plot for stem rust. The red line refers to the significant level at Bonferroni correction (0.05) Chromosome 2D