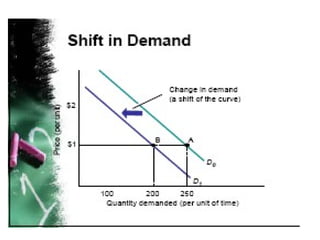
Demand
Laugher Curve Q. What do you get when you cross the Godfather with an economist? A. An offer you can't understand
Demand •  Demand  means the willingness and capacity to pay. •  Prices are the tools by which the market coordinates individual desires.
The Law of Demand •  Law of demand  – there is an inverse  relationship between price and quantity demanded. –  Quantity demanded rises as price falls,  other things constant. –  Quantity demanded falls as prices rise, other things constant.
The Law of Demand •  What accounts for the law of demand? –  People tend to substitute for goods whose price has gone up.
The Demand Curve •  The  demand curve  is the graphic representation of the law of demand. •  The demand curve slopes downward and  to the right. •  As the price goes up, the quantity demanded goes down.
 
Other Things Constant •  Other things constant  places a limitation on the application of the law of demand. –  All other factors that affect quantity demanded are assumed to remain constant, whether they actually remain constant or not.
Other Things Constant •  Other things constant  places a limitation on the application of the law of demand. –  These factors may include changing tastes, prices of other goods, income, even the weather.
•  Demand refers to a schedule of quantities of a good that will be bought per unit of time at various prices, other things constant. •  Graphically, it refers to the entire demand curve. Shifts in Demand Versus Movements Along a Demand Curve
•  Quantity demanded  refers to a specific amount that will be demand per unit of time at a specific price. •  Graphically, it refers to a specific point on the demand curve. Shifts in Demand Versus Movements Along a Demand Curve
Shifts in Demand Versus Movements Along a Demand Curve •  A  movement along a demand curve  is the graphical representation of the effect of a change in price on the quantity demanded.
Shifts in Demand Versus Movements Along a Demand Curve •  A  shift in demand  is the graphical representation of the effect of anything other than price on demand.
 
 
Shift Factors of Demand •  Shift factors of demand are factors that cause shifts in the demand curve: –  Society's income. –  The prices of other goods. –  Tastes. –  Expectations. –  Taxes on subsidies to consumers.
Income •  An increase in income will increase demand for normal goods. •  An increase in income will decrease demand for inferior goods.
Price of Other Goods •  When the price of a substitute good falls, demand falls for the good whose price has not changed. •  When the price of a complement good falls, demand rises for the good whose price has not changed.
Tastes •  A change in taste will change demand with no change in price.
Expectations •  If you expect your income to rise, you may consume more now. •  If you expect prices to fall in the future, you may put off purchases today.
Taxes and Subsidies •  Taxes levied on consumers increase the cost of goods to consumers, there by reducing demand. •  Subsidies have an opposite effect
The Demand Table •  The demand table assumes all the following: –  As price rises, quantity demanded declines. –  Quantity demanded has a specific time dimension to it. –  All the products involved are identical in shape, size, quality, etc.
The Demand Table •  The demand table assumes all the following: –  The schedule assumes that everything else is held constant.
From a Demand Table to a Demand Curve •  You plot each point in the demand table on a graph and connect the points to derive the demand curve
From a Demand Table to a Demand Curve •  The demand curve graphically conveys the same information that is on the demand table.
From a Demand Table to a Demand Curve •  The curve represents the maximum price that you will pay for various quantities of a good – you will happily pay less.
 
Individual and Market Demand Curves •  A market demand curve is the horizontal sum of all individual demand curves. –  This is determined by adding the individual demand curves of all the demanders.
Individual and Market Demand Curves •  Sellers estimate total market demand for their product which becomes smooth and downward sloping curve.
 
The Law of Demand •  The demand curve is downward sloping for the following reasons: –  At lower prices, existing demanders buy more. –  At lower prices, new demanders enter the market.

New demand ppt

  • 1.
  • 2.
    Laugher Curve Q.What do you get when you cross the Godfather with an economist? A. An offer you can't understand
  • 3.
    Demand • Demand means the willingness and capacity to pay. • Prices are the tools by which the market coordinates individual desires.
  • 4.
    The Law ofDemand • Law of demand – there is an inverse relationship between price and quantity demanded. – Quantity demanded rises as price falls, other things constant. – Quantity demanded falls as prices rise, other things constant.
  • 5.
    The Law ofDemand • What accounts for the law of demand? – People tend to substitute for goods whose price has gone up.
  • 6.
    The Demand Curve• The demand curve is the graphic representation of the law of demand. • The demand curve slopes downward and to the right. • As the price goes up, the quantity demanded goes down.
  • 7.
  • 8.
    Other Things Constant• Other things constant places a limitation on the application of the law of demand. – All other factors that affect quantity demanded are assumed to remain constant, whether they actually remain constant or not.
  • 9.
    Other Things Constant• Other things constant places a limitation on the application of the law of demand. – These factors may include changing tastes, prices of other goods, income, even the weather.
  • 10.
    • Demandrefers to a schedule of quantities of a good that will be bought per unit of time at various prices, other things constant. • Graphically, it refers to the entire demand curve. Shifts in Demand Versus Movements Along a Demand Curve
  • 11.
    • Quantitydemanded refers to a specific amount that will be demand per unit of time at a specific price. • Graphically, it refers to a specific point on the demand curve. Shifts in Demand Versus Movements Along a Demand Curve
  • 12.
    Shifts in DemandVersus Movements Along a Demand Curve • A movement along a demand curve is the graphical representation of the effect of a change in price on the quantity demanded.
  • 13.
    Shifts in DemandVersus Movements Along a Demand Curve • A shift in demand is the graphical representation of the effect of anything other than price on demand.
  • 14.
  • 15.
  • 16.
    Shift Factors ofDemand • Shift factors of demand are factors that cause shifts in the demand curve: – Society's income. – The prices of other goods. – Tastes. – Expectations. – Taxes on subsidies to consumers.
  • 17.
    Income • An increase in income will increase demand for normal goods. • An increase in income will decrease demand for inferior goods.
  • 18.
    Price of OtherGoods • When the price of a substitute good falls, demand falls for the good whose price has not changed. • When the price of a complement good falls, demand rises for the good whose price has not changed.
  • 19.
    Tastes • A change in taste will change demand with no change in price.
  • 20.
    Expectations • If you expect your income to rise, you may consume more now. • If you expect prices to fall in the future, you may put off purchases today.
  • 21.
    Taxes and Subsidies• Taxes levied on consumers increase the cost of goods to consumers, there by reducing demand. • Subsidies have an opposite effect
  • 22.
    The Demand Table• The demand table assumes all the following: – As price rises, quantity demanded declines. – Quantity demanded has a specific time dimension to it. – All the products involved are identical in shape, size, quality, etc.
  • 23.
    The Demand Table• The demand table assumes all the following: – The schedule assumes that everything else is held constant.
  • 24.
    From a DemandTable to a Demand Curve • You plot each point in the demand table on a graph and connect the points to derive the demand curve
  • 25.
    From a DemandTable to a Demand Curve • The demand curve graphically conveys the same information that is on the demand table.
  • 26.
    From a DemandTable to a Demand Curve • The curve represents the maximum price that you will pay for various quantities of a good – you will happily pay less.
  • 27.
  • 28.
    Individual and MarketDemand Curves • A market demand curve is the horizontal sum of all individual demand curves. – This is determined by adding the individual demand curves of all the demanders.
  • 29.
    Individual and MarketDemand Curves • Sellers estimate total market demand for their product which becomes smooth and downward sloping curve.
  • 30.
  • 31.
    The Law ofDemand • The demand curve is downward sloping for the following reasons: – At lower prices, existing demanders buy more. – At lower prices, new demanders enter the market.