Downloaded 433 times
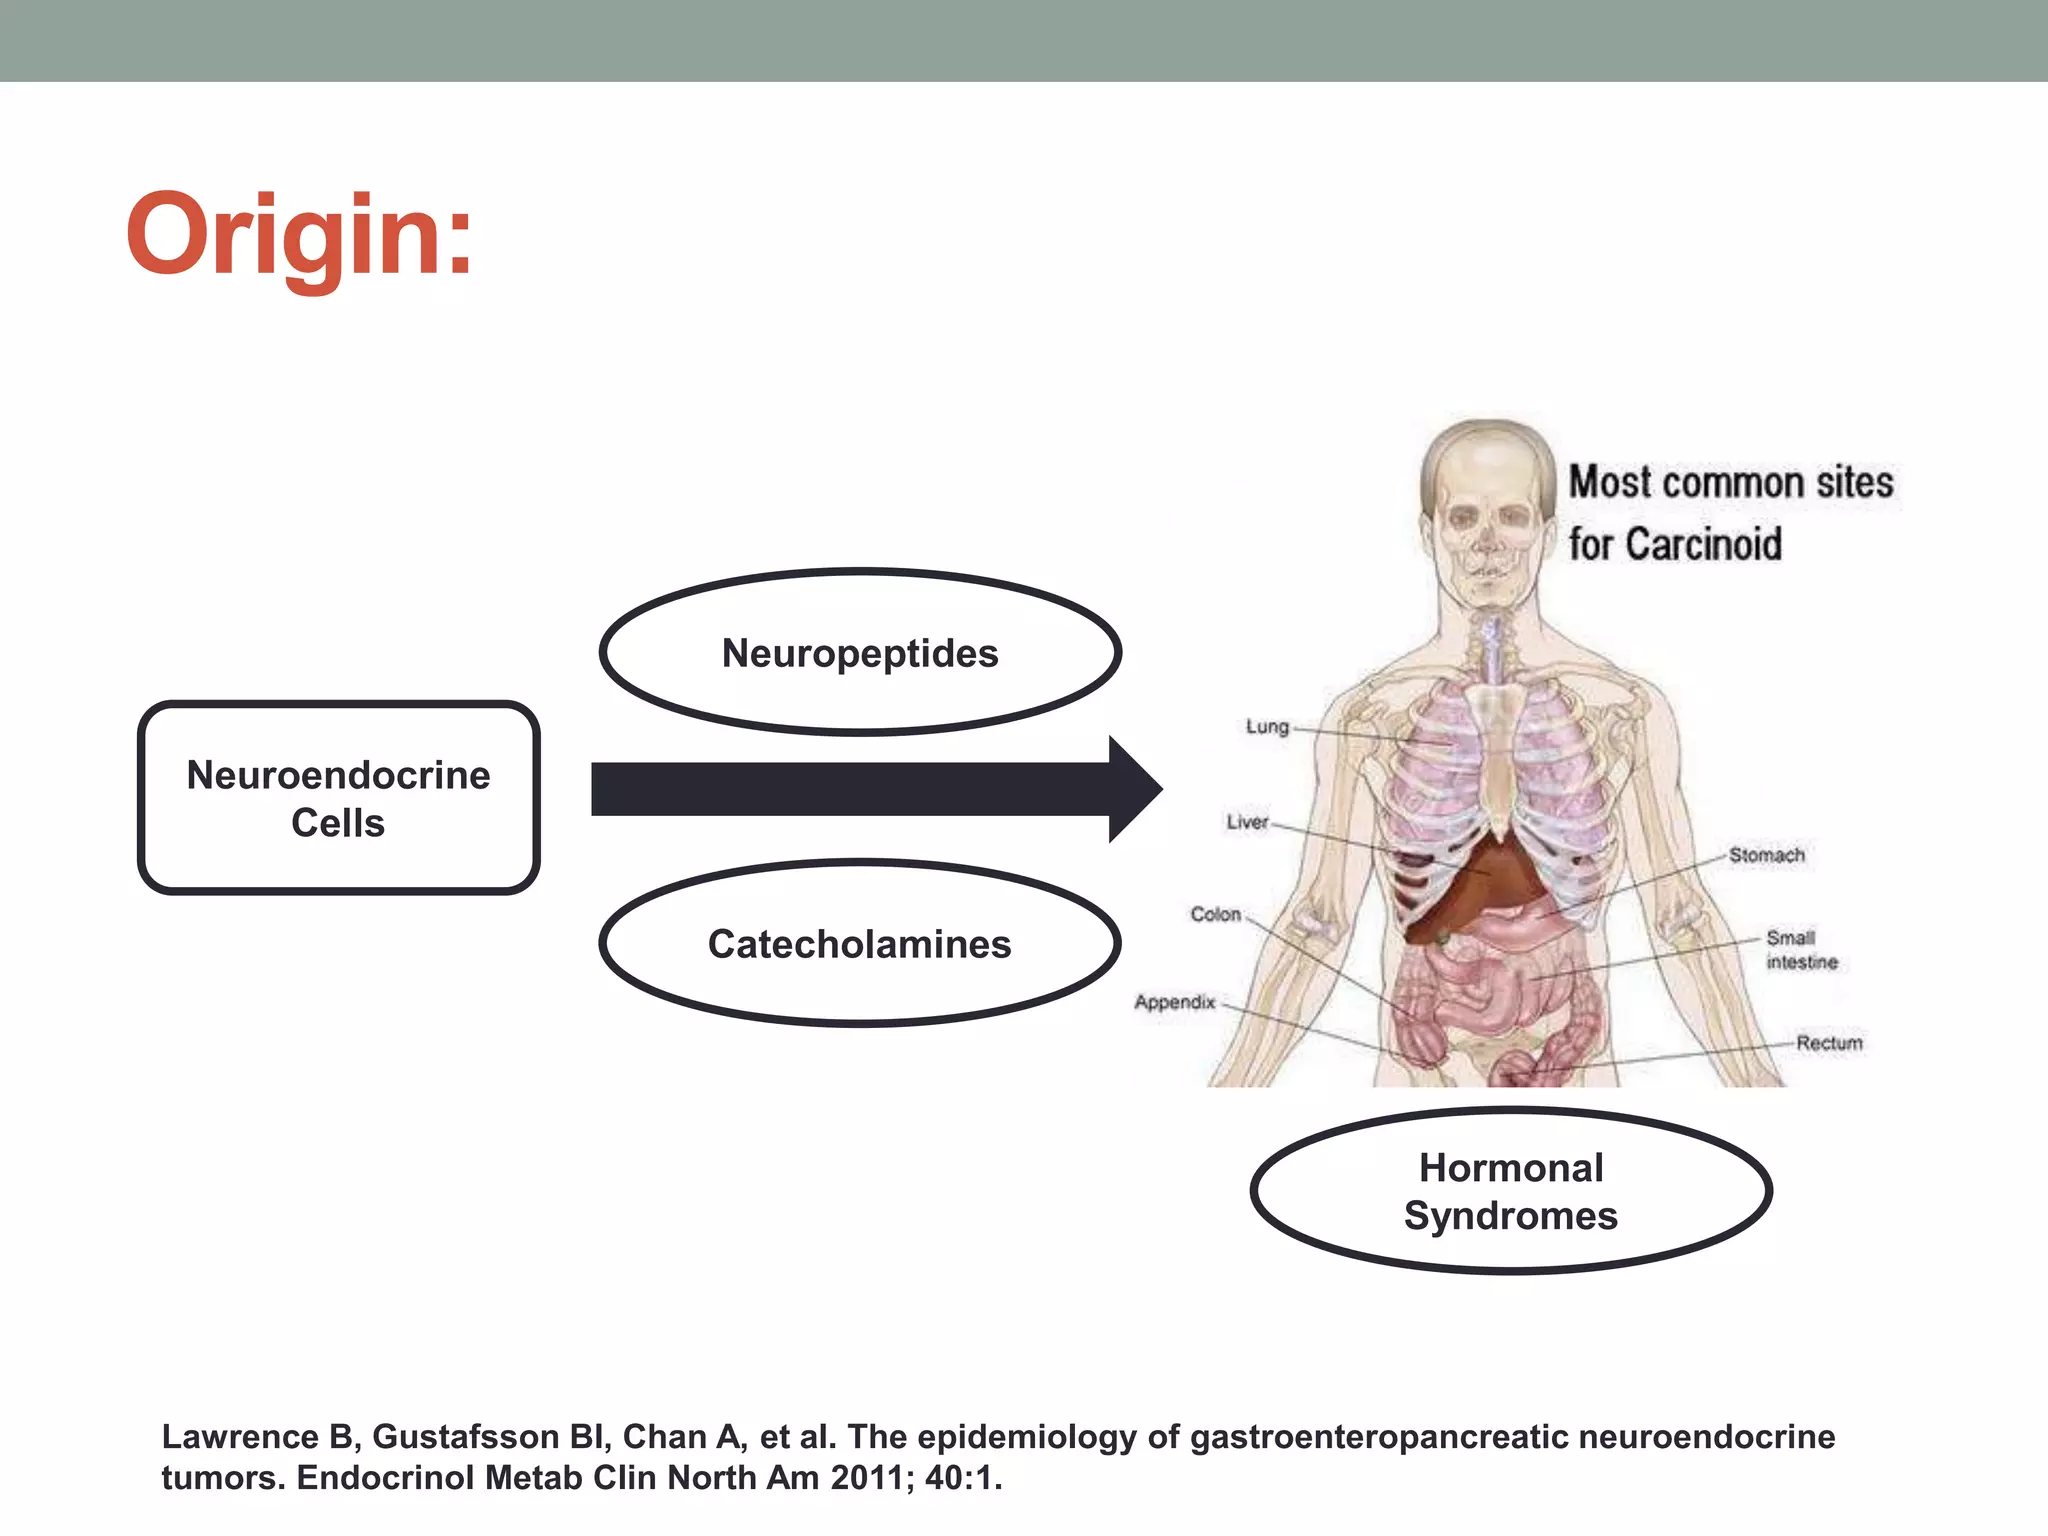
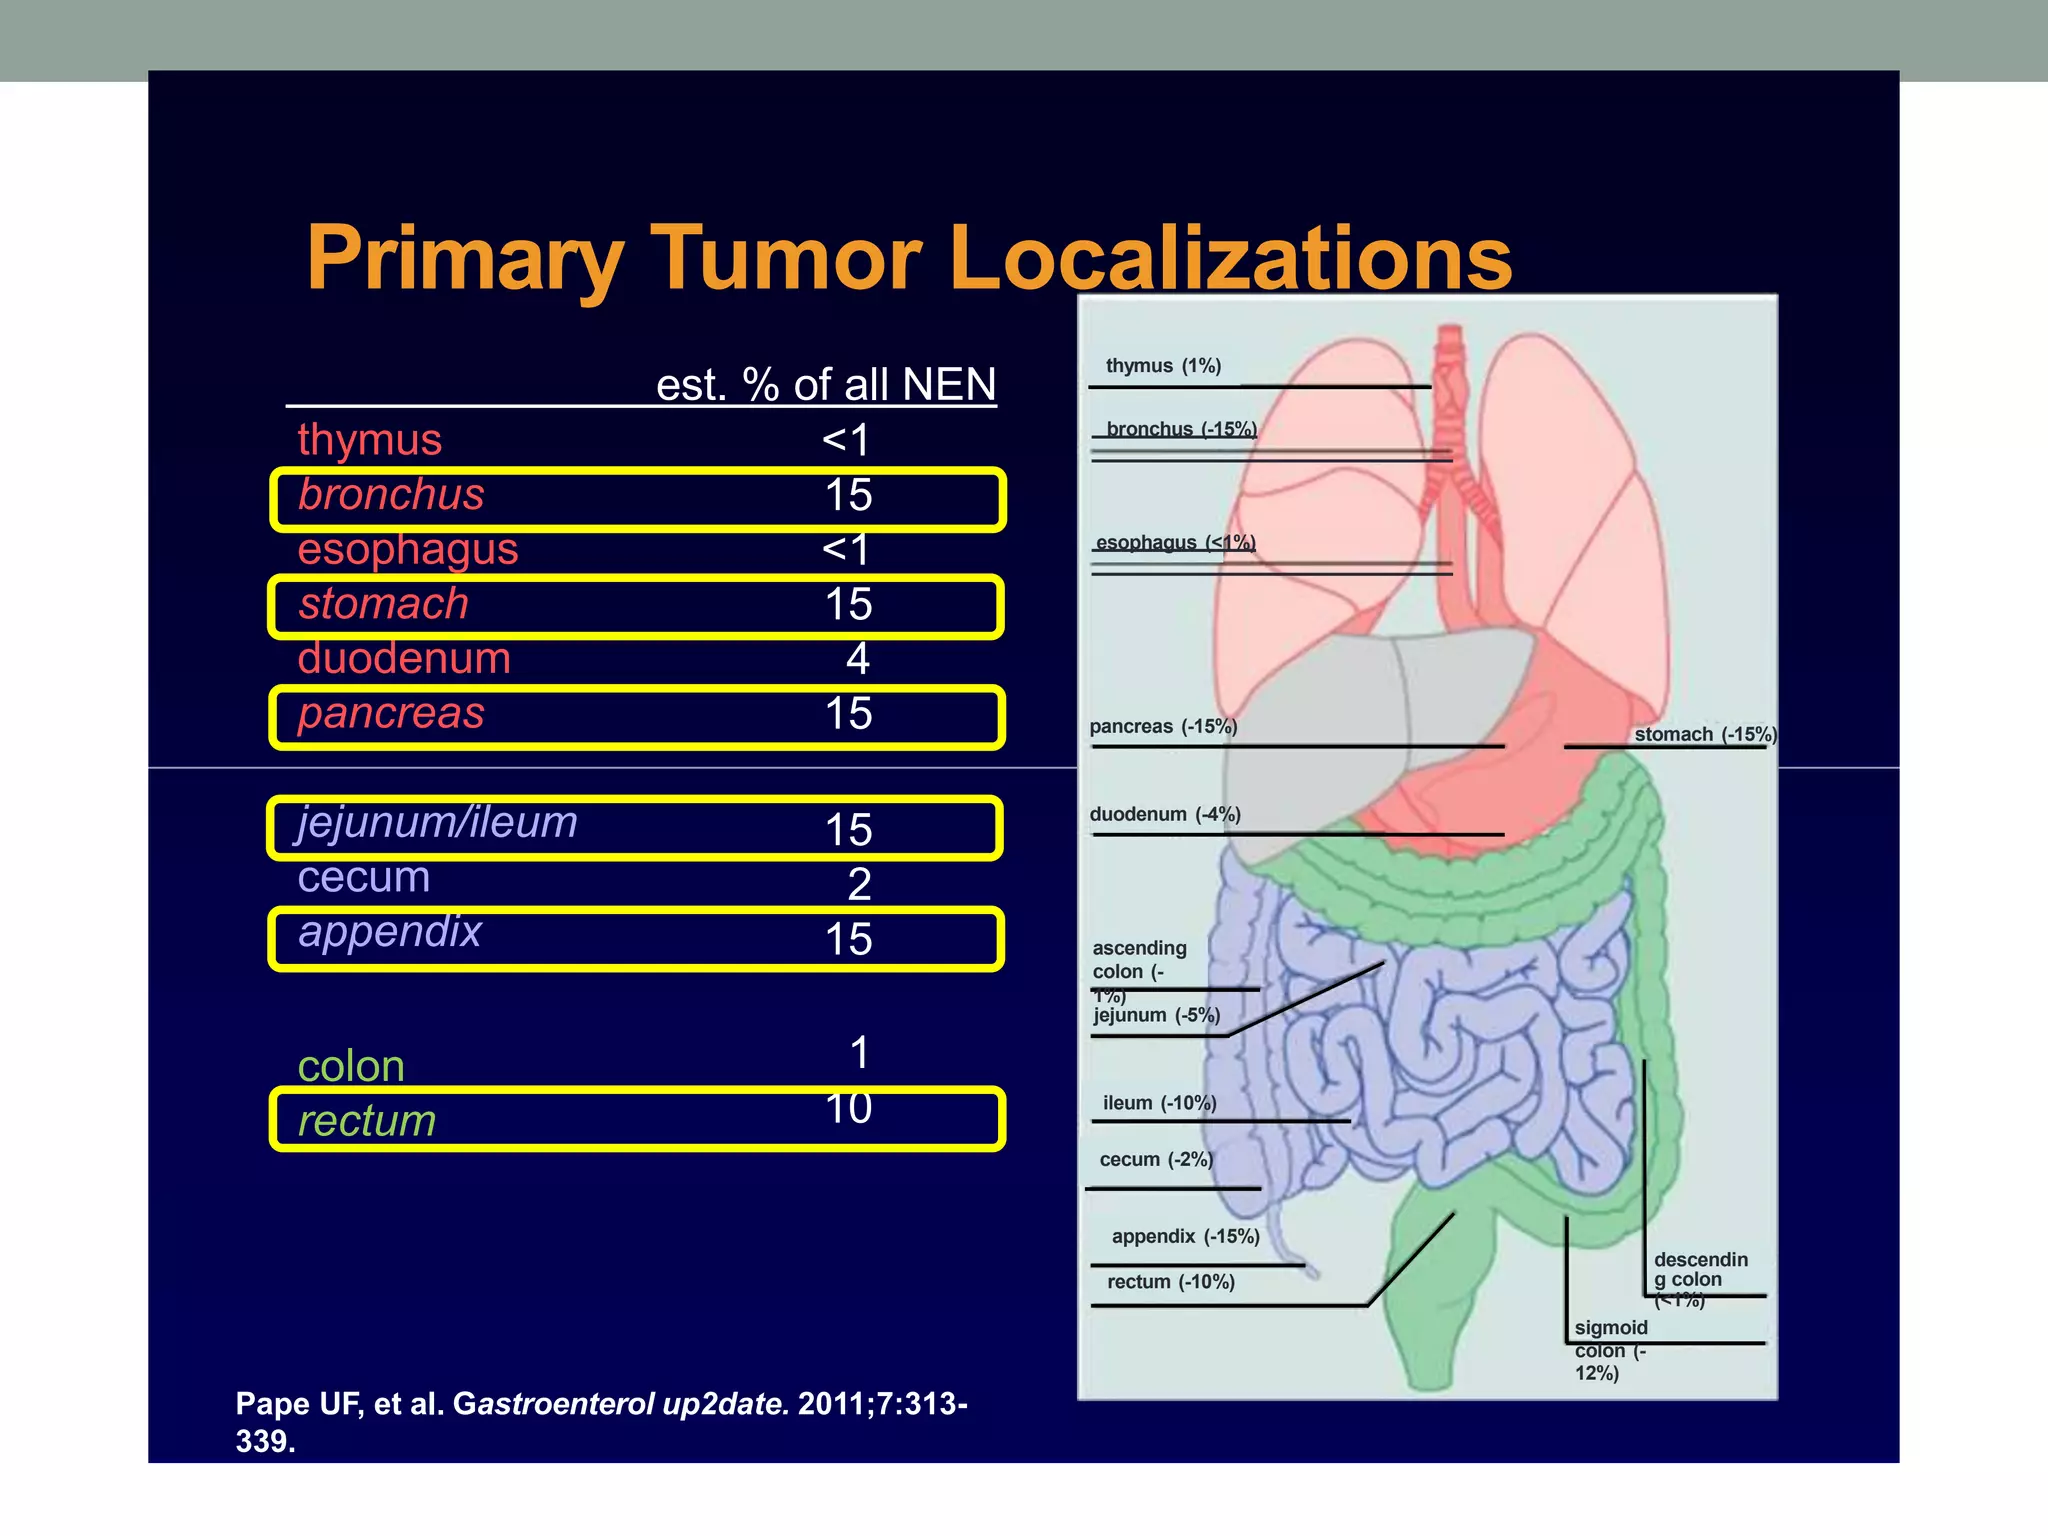
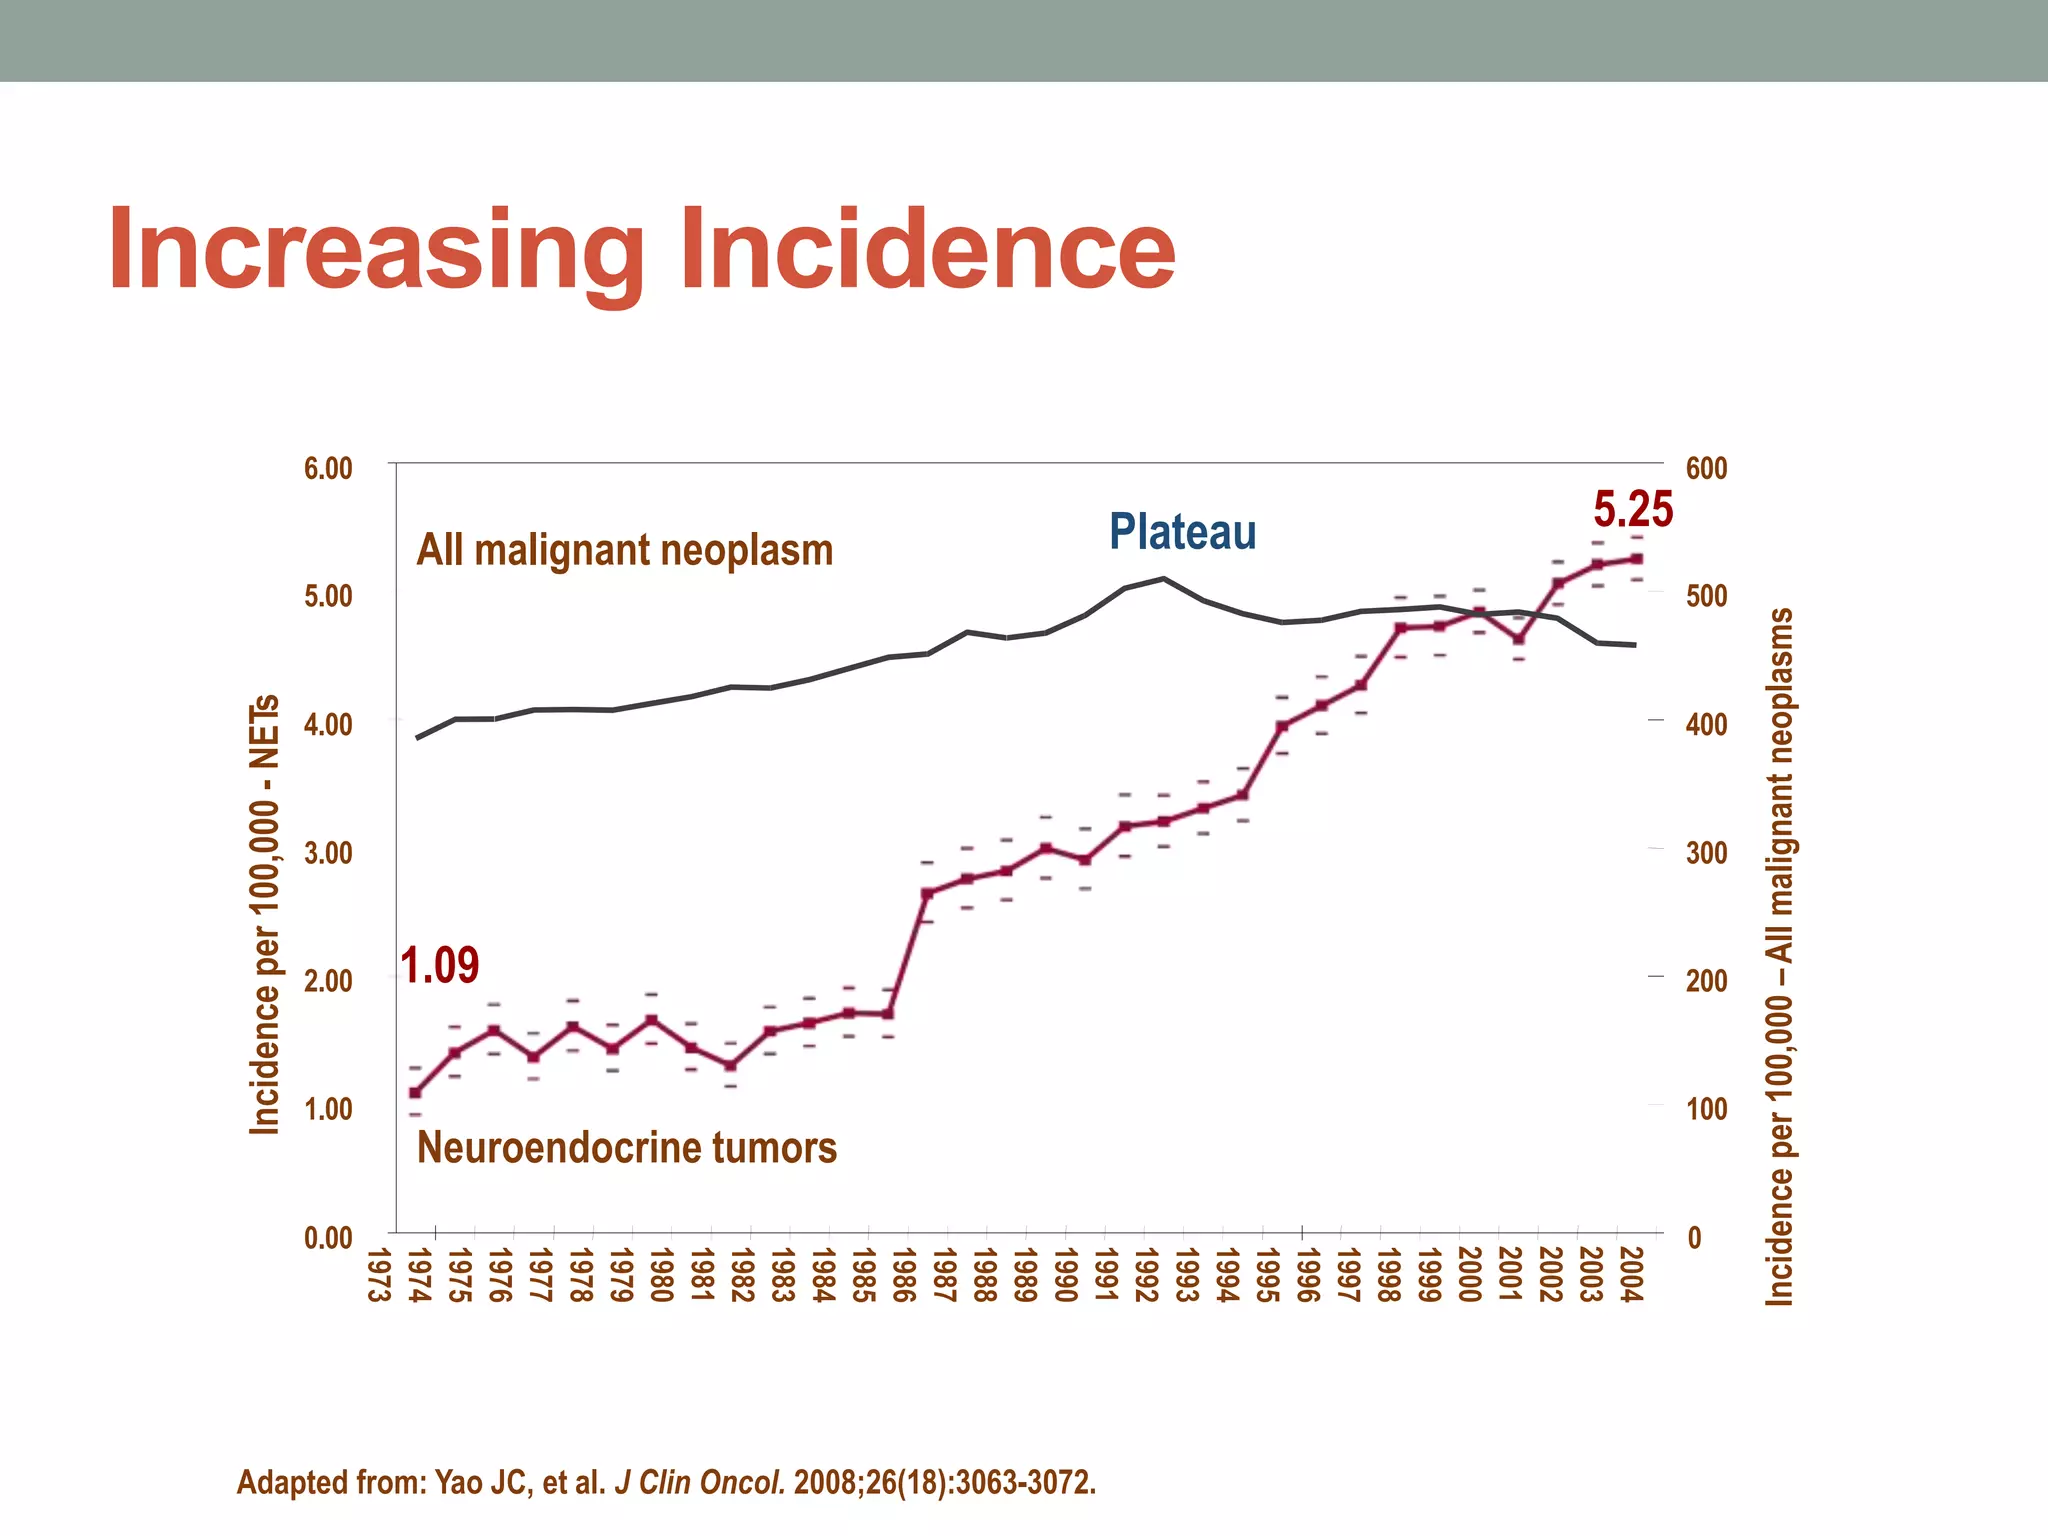

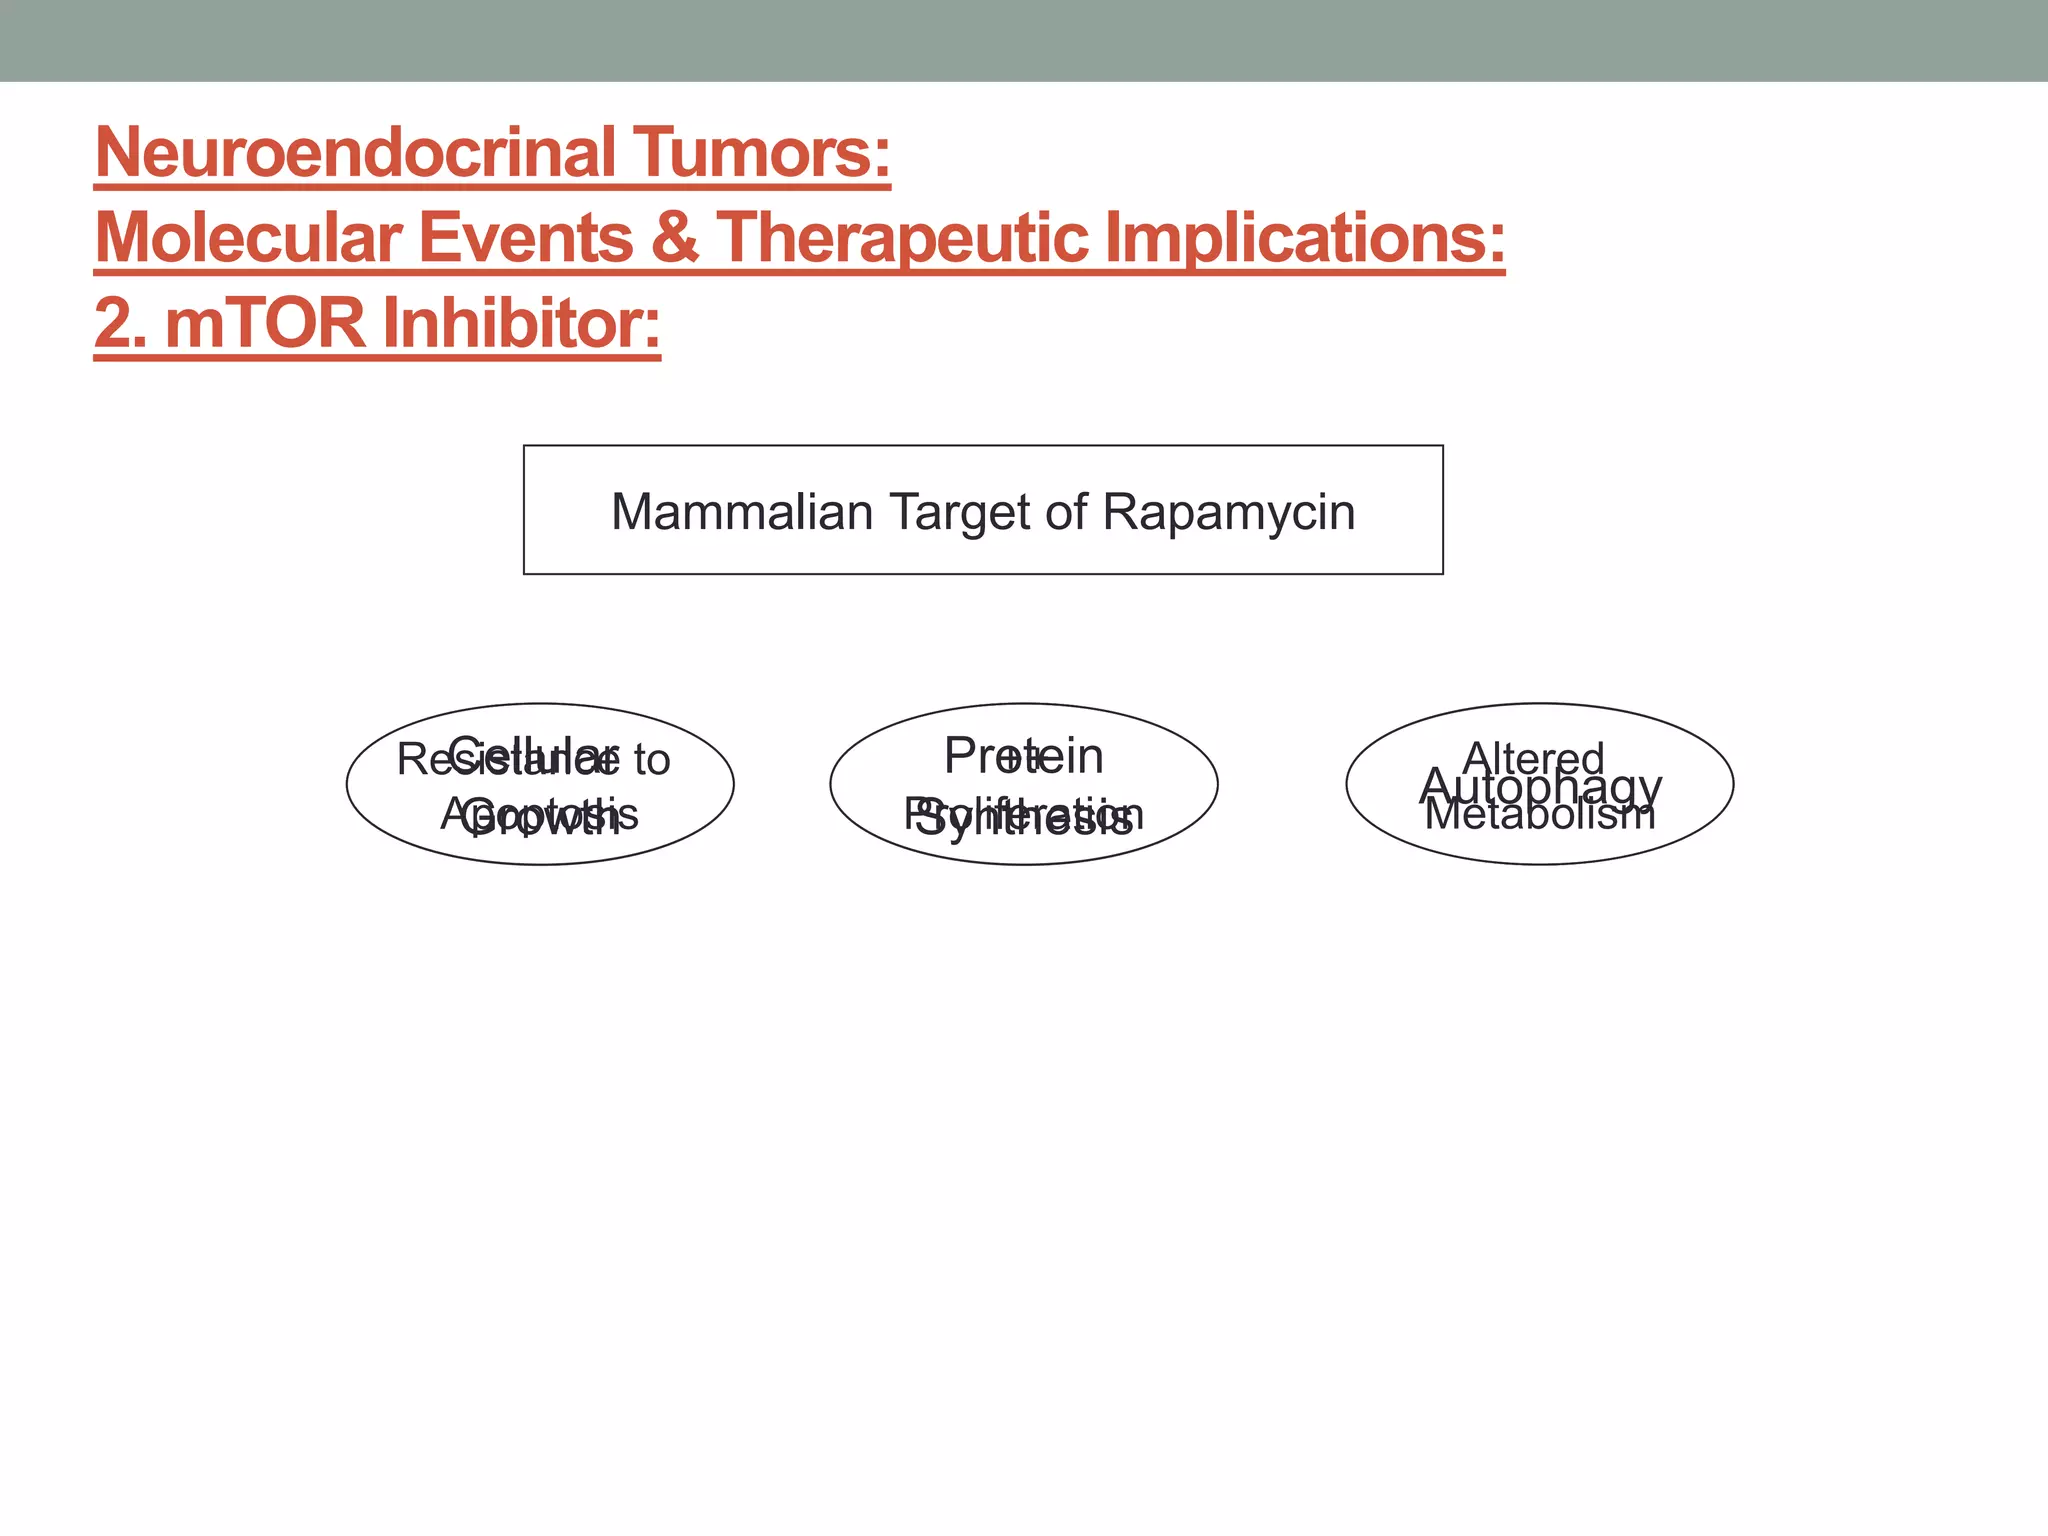
![[TITLE]
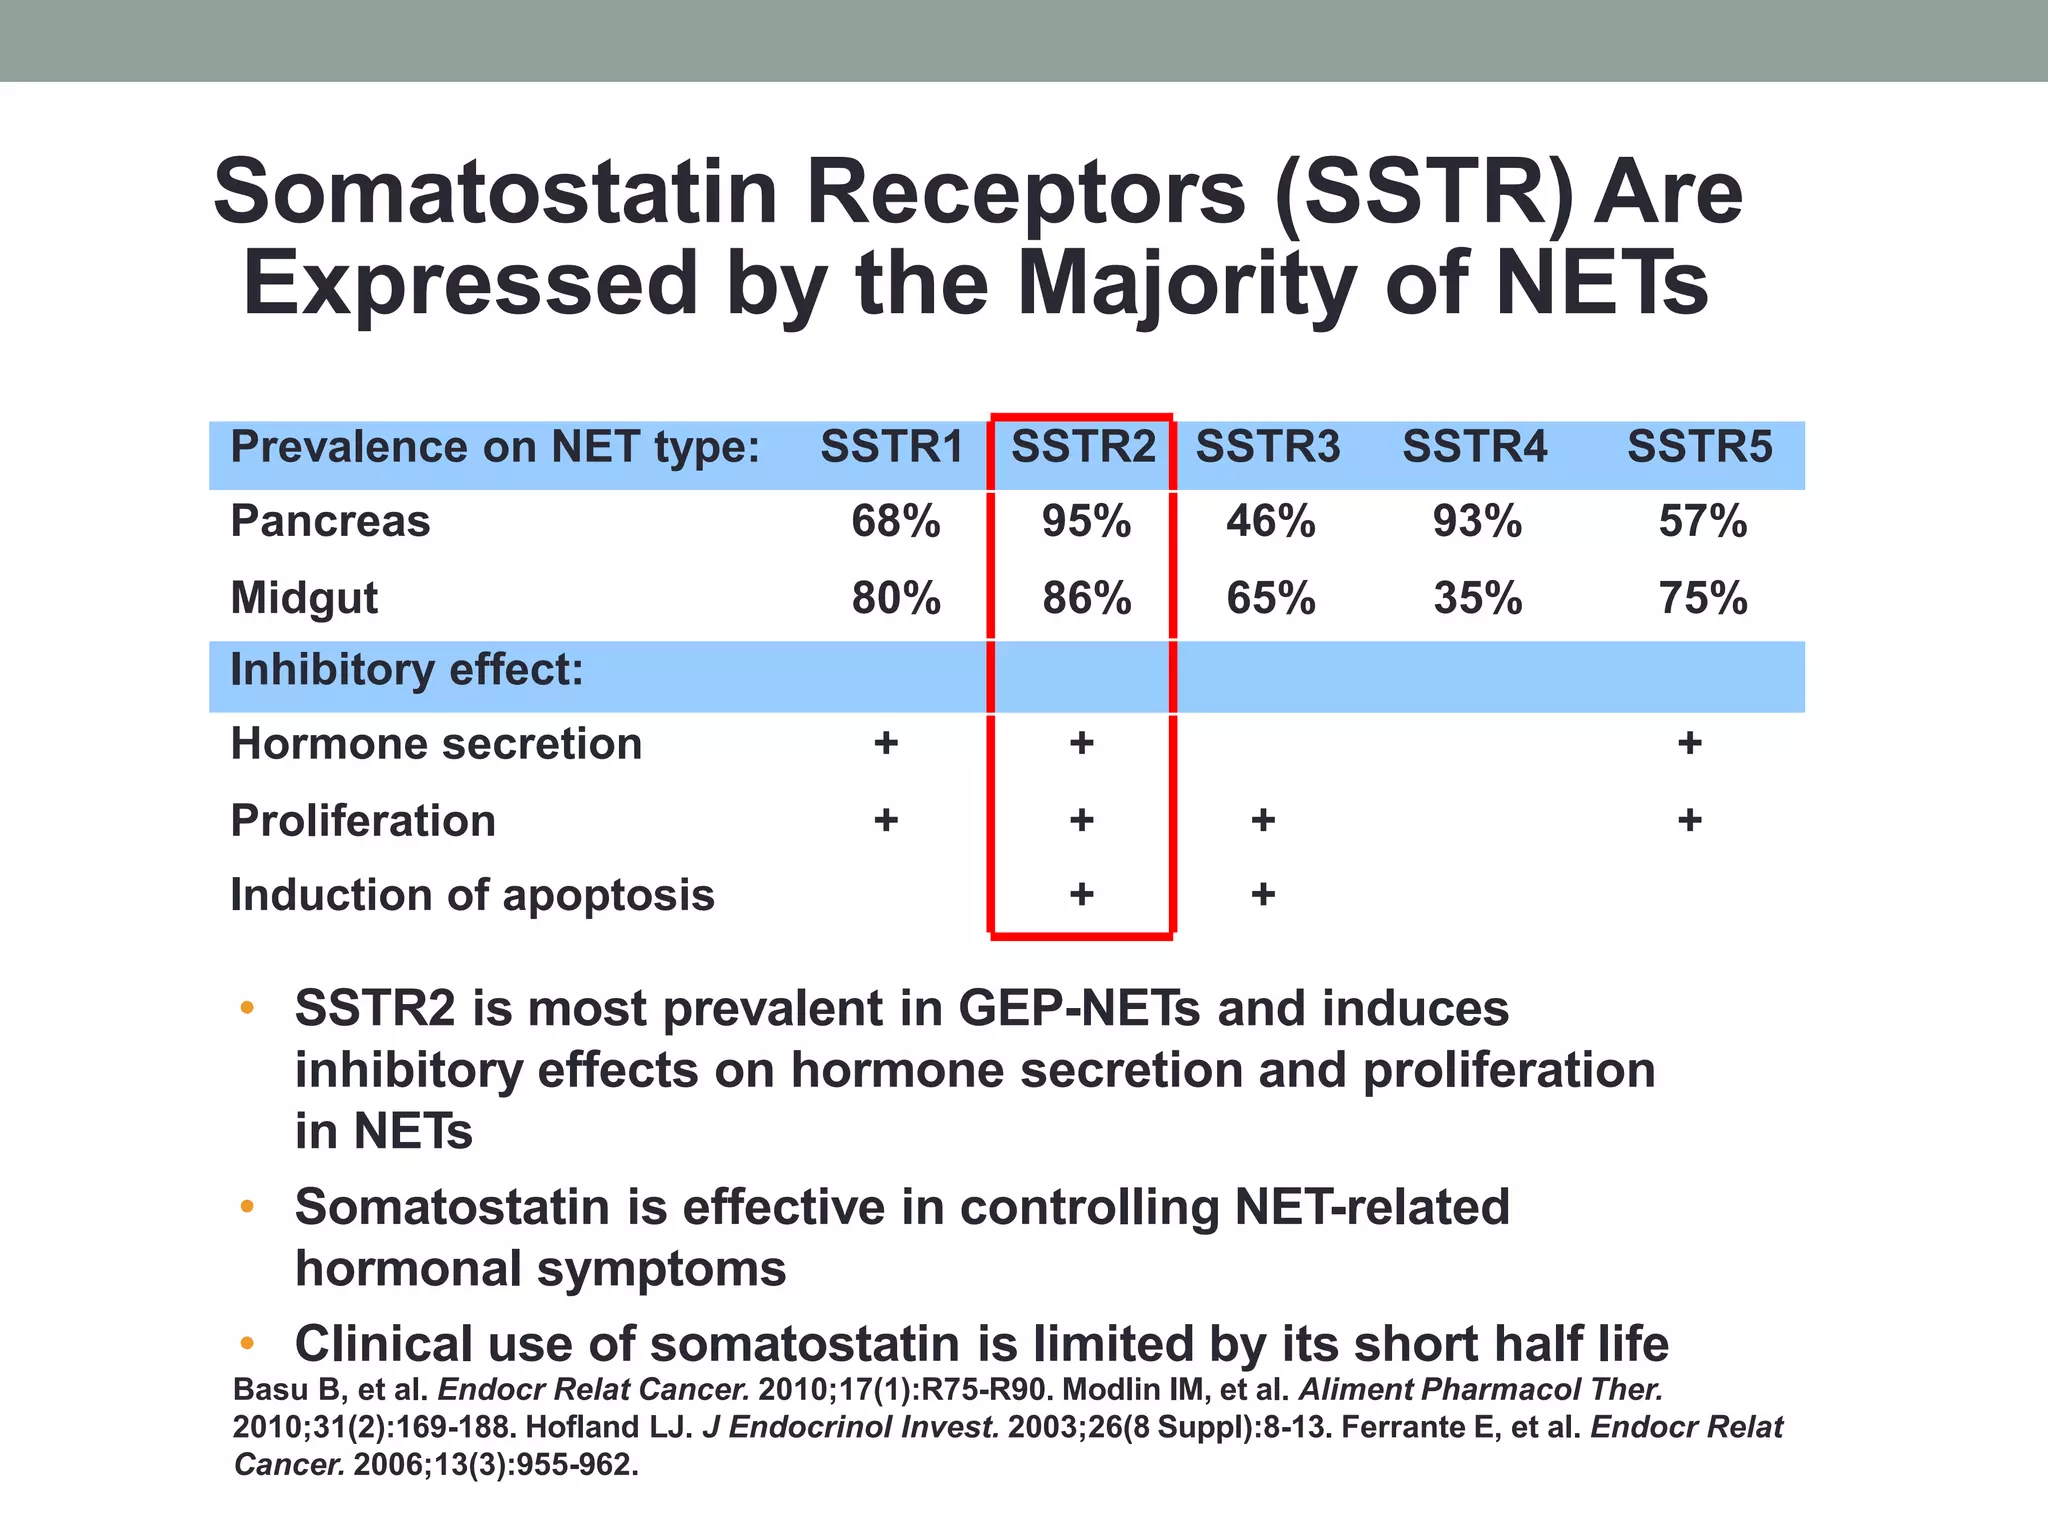
Presented By Pamela L. Kunz, MD at 2012Annual Meeting](https://image.slidesharecdn.com/neuroendocrinetumorsin2015-150501061503-conversion-gate02/75/Neuroendocrine-tumors-in-2015-9-2048.jpg)


![Octreotide LAR 30 mg
Significantly Prolongs TTP:
HR = hazard ratio. PROMID = Placebo-controlled prospective Randomized study on the antiproliferative efficacy of Octreotide LAR in patients
with metastatic neuroendocrine MIDgut tumours; TTP = time to progression
Rinke A, Müller HH, Schade-Brittinger C, et al. J Clin Oncol. 2009;27:4656-4663.
Octreotide LAR vs placebo
HR=0.34 P=0.000072
[95% CI: 0.20–0.59]
Based on conservative ITT analysis
ProportionWithout
Progression
1.0
.75
.50
.25
0
0 6 12 18 24 30 36 42
Time (mo)
48 54 60 66 72 78
Octreotide LAR (n = 42)
Median 14.3 mo
Placebo (n = 43)
Median 6.0 mo](https://image.slidesharecdn.com/neuroendocrinetumorsin2015-150501061503-conversion-gate02/75/Neuroendocrine-tumors-in-2015-32-2048.jpg)


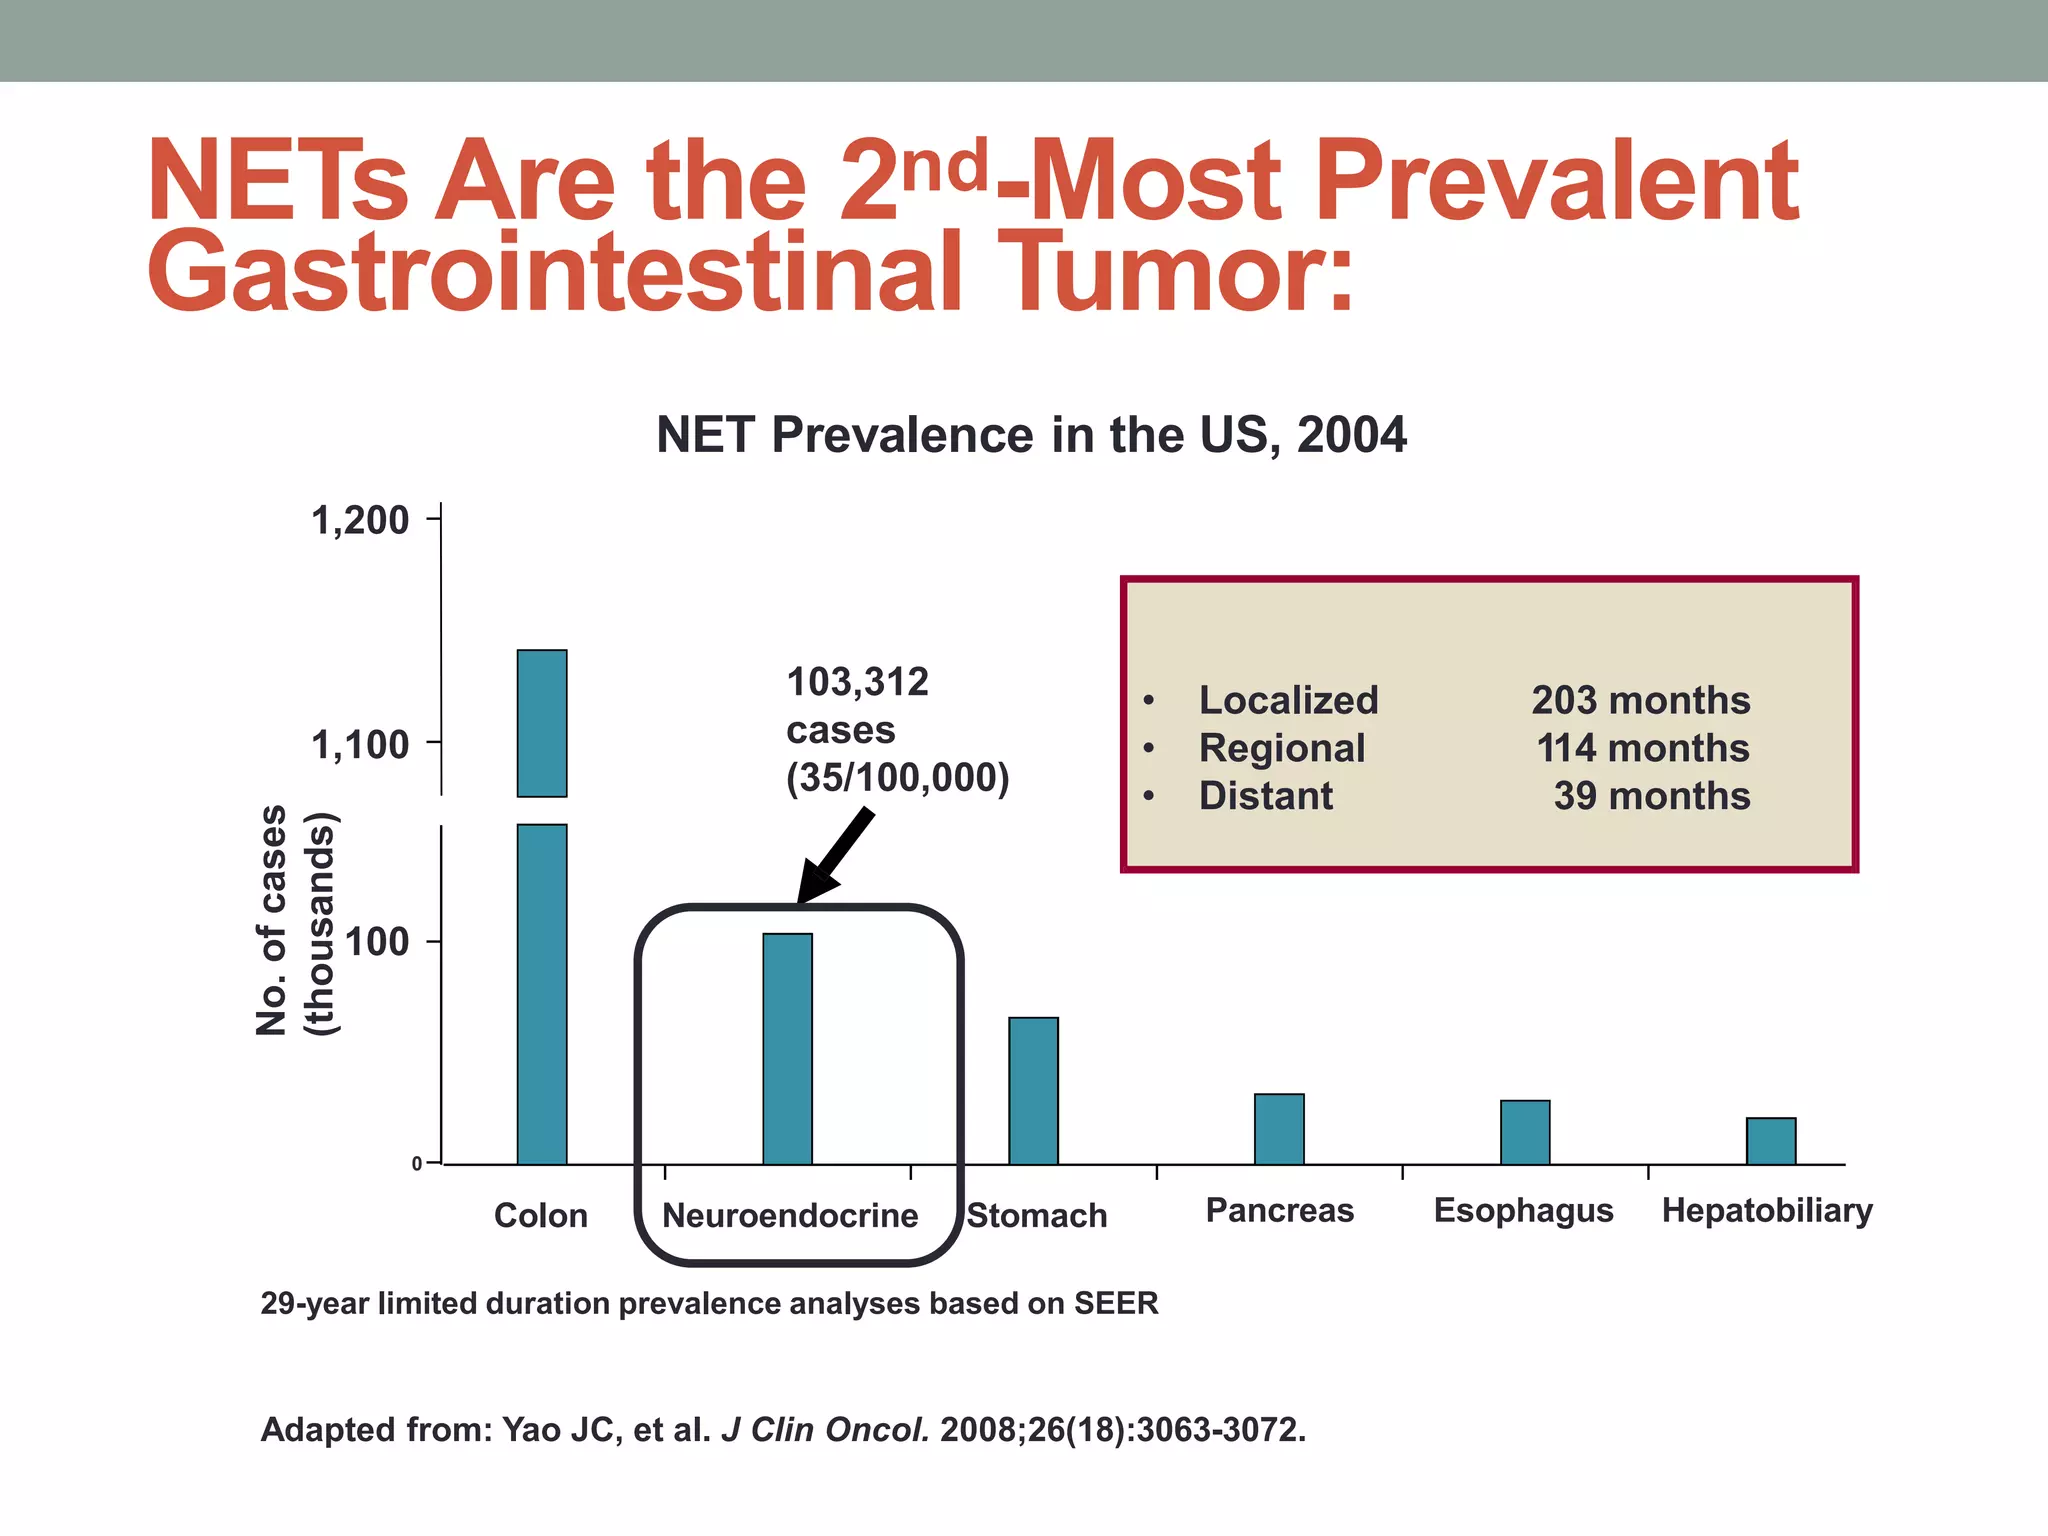
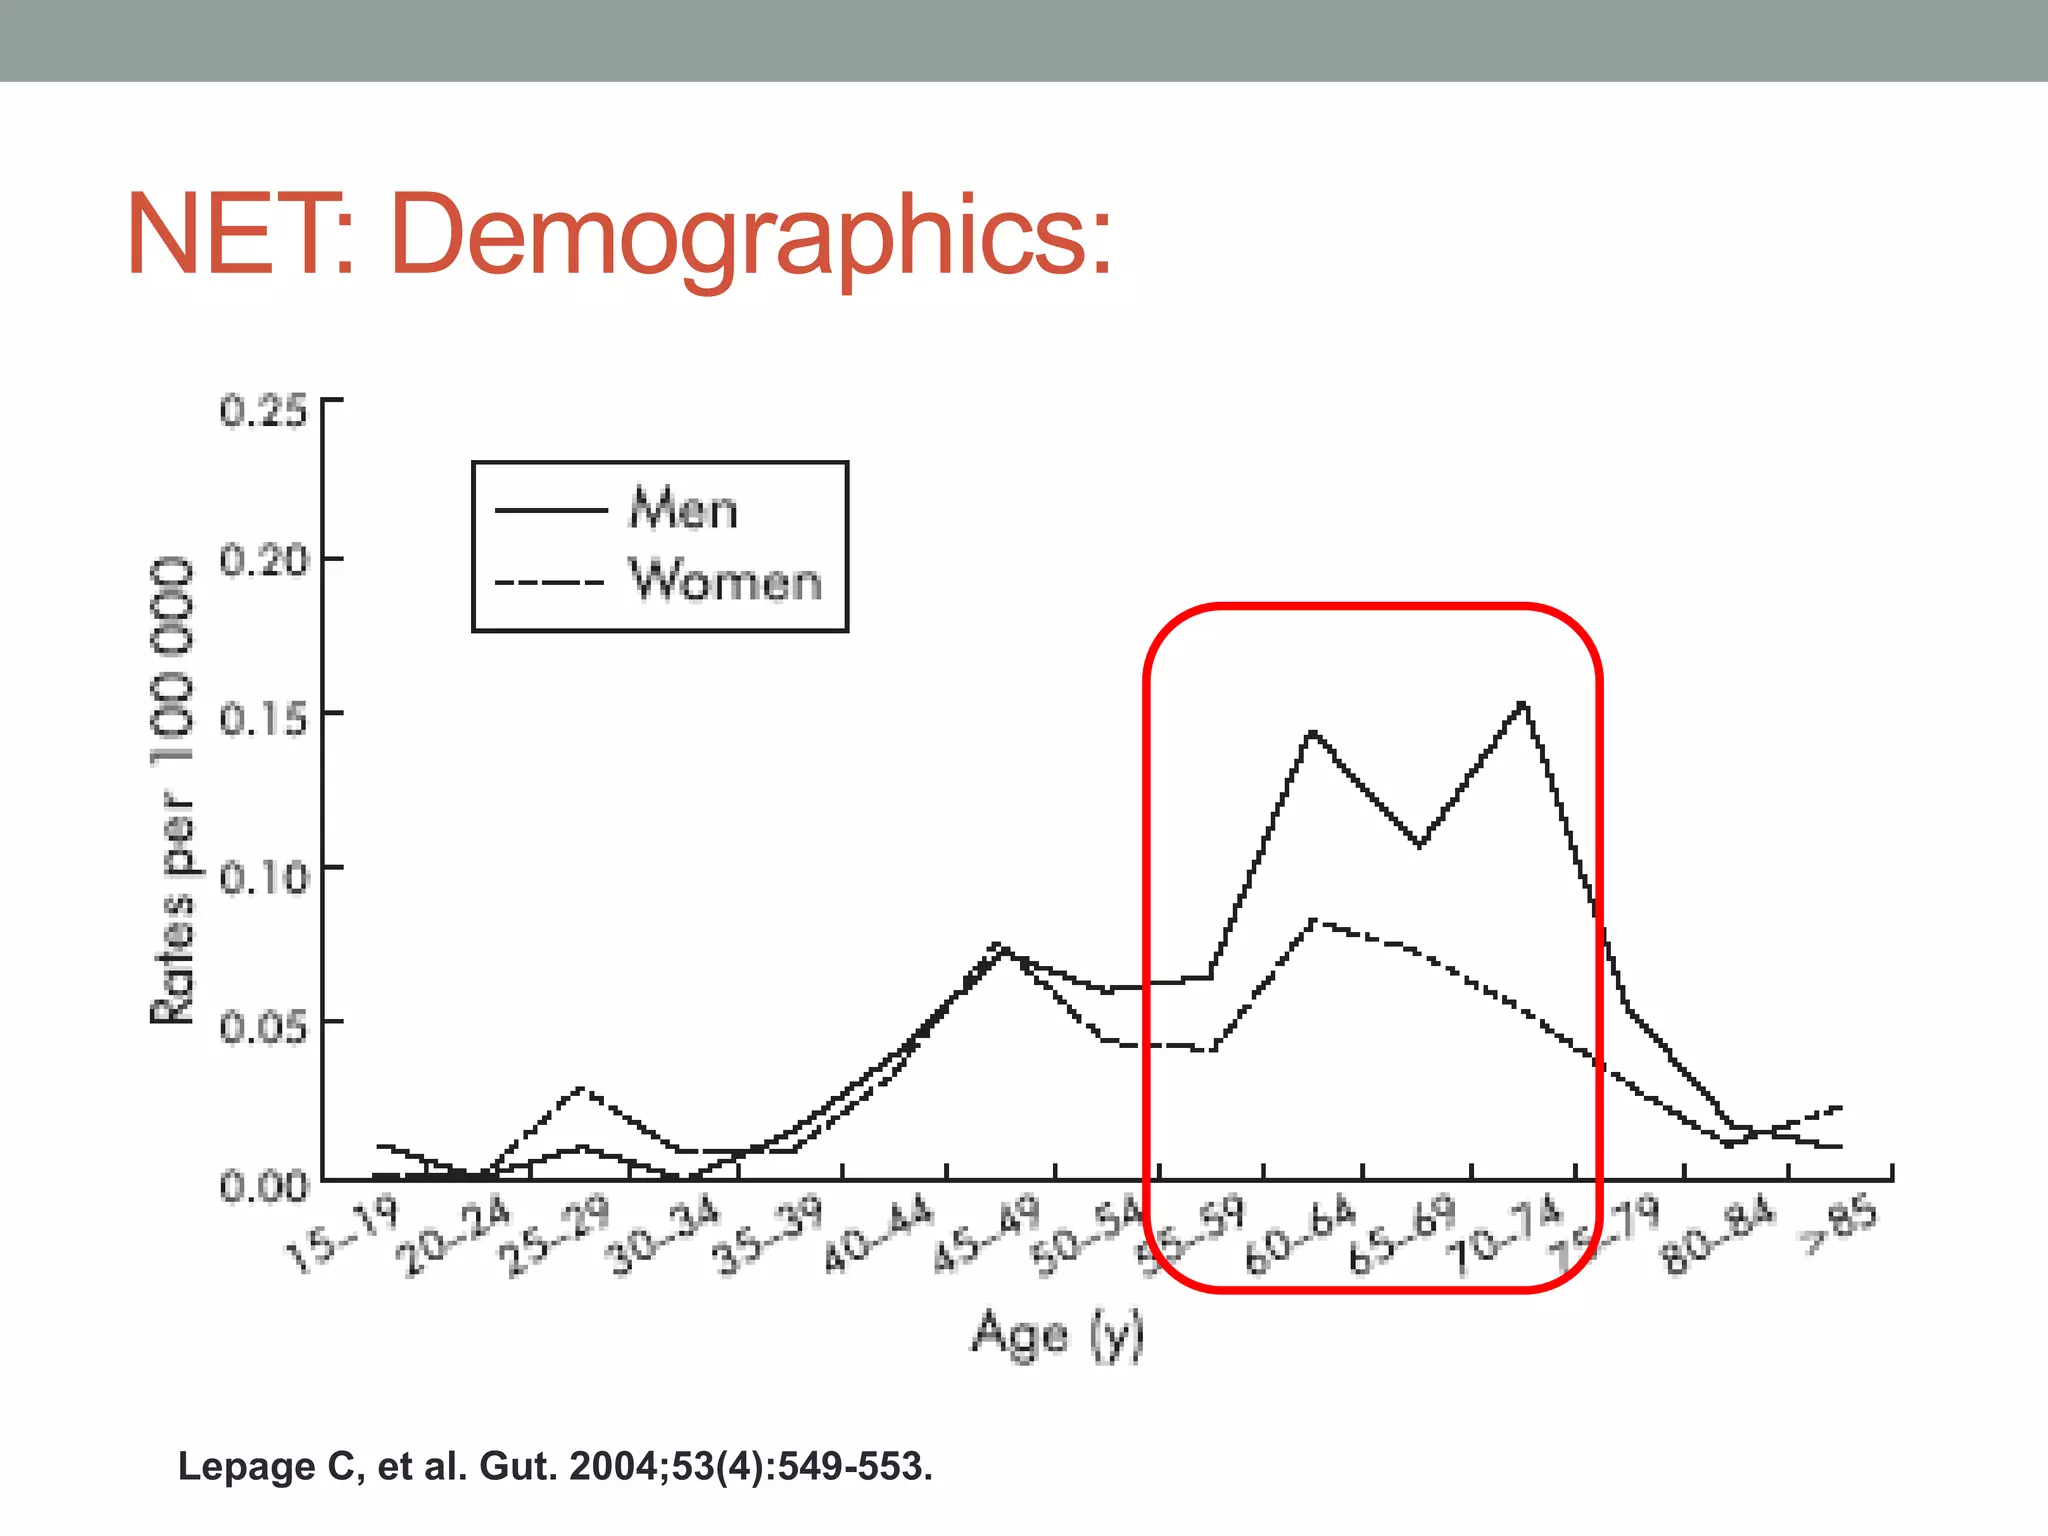
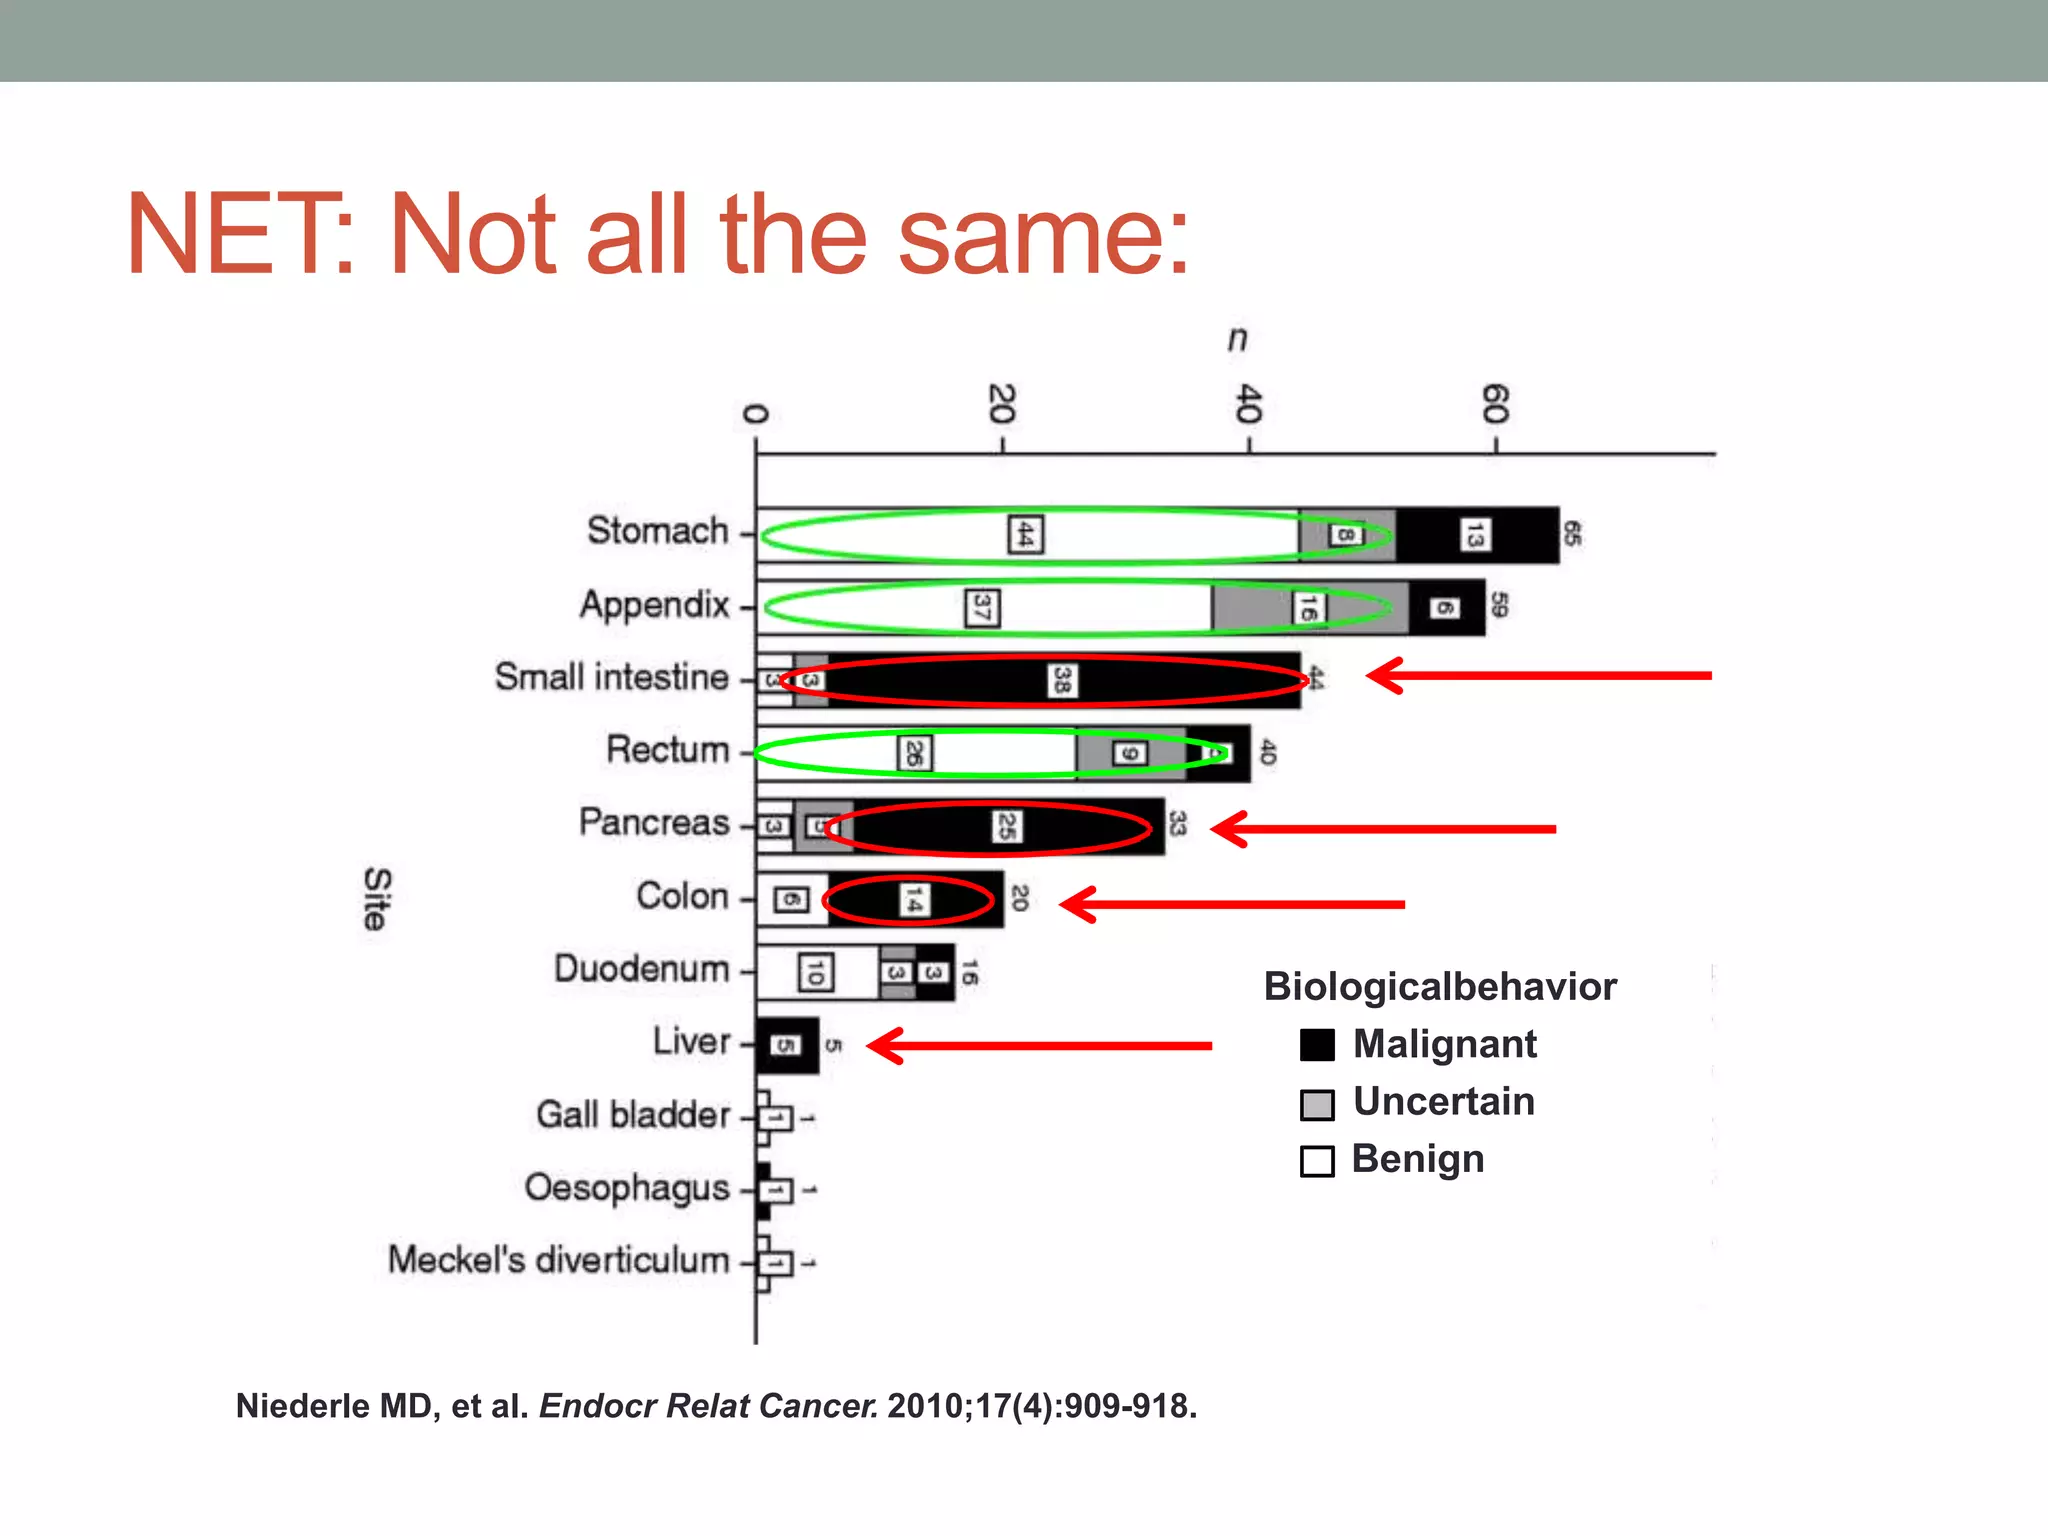
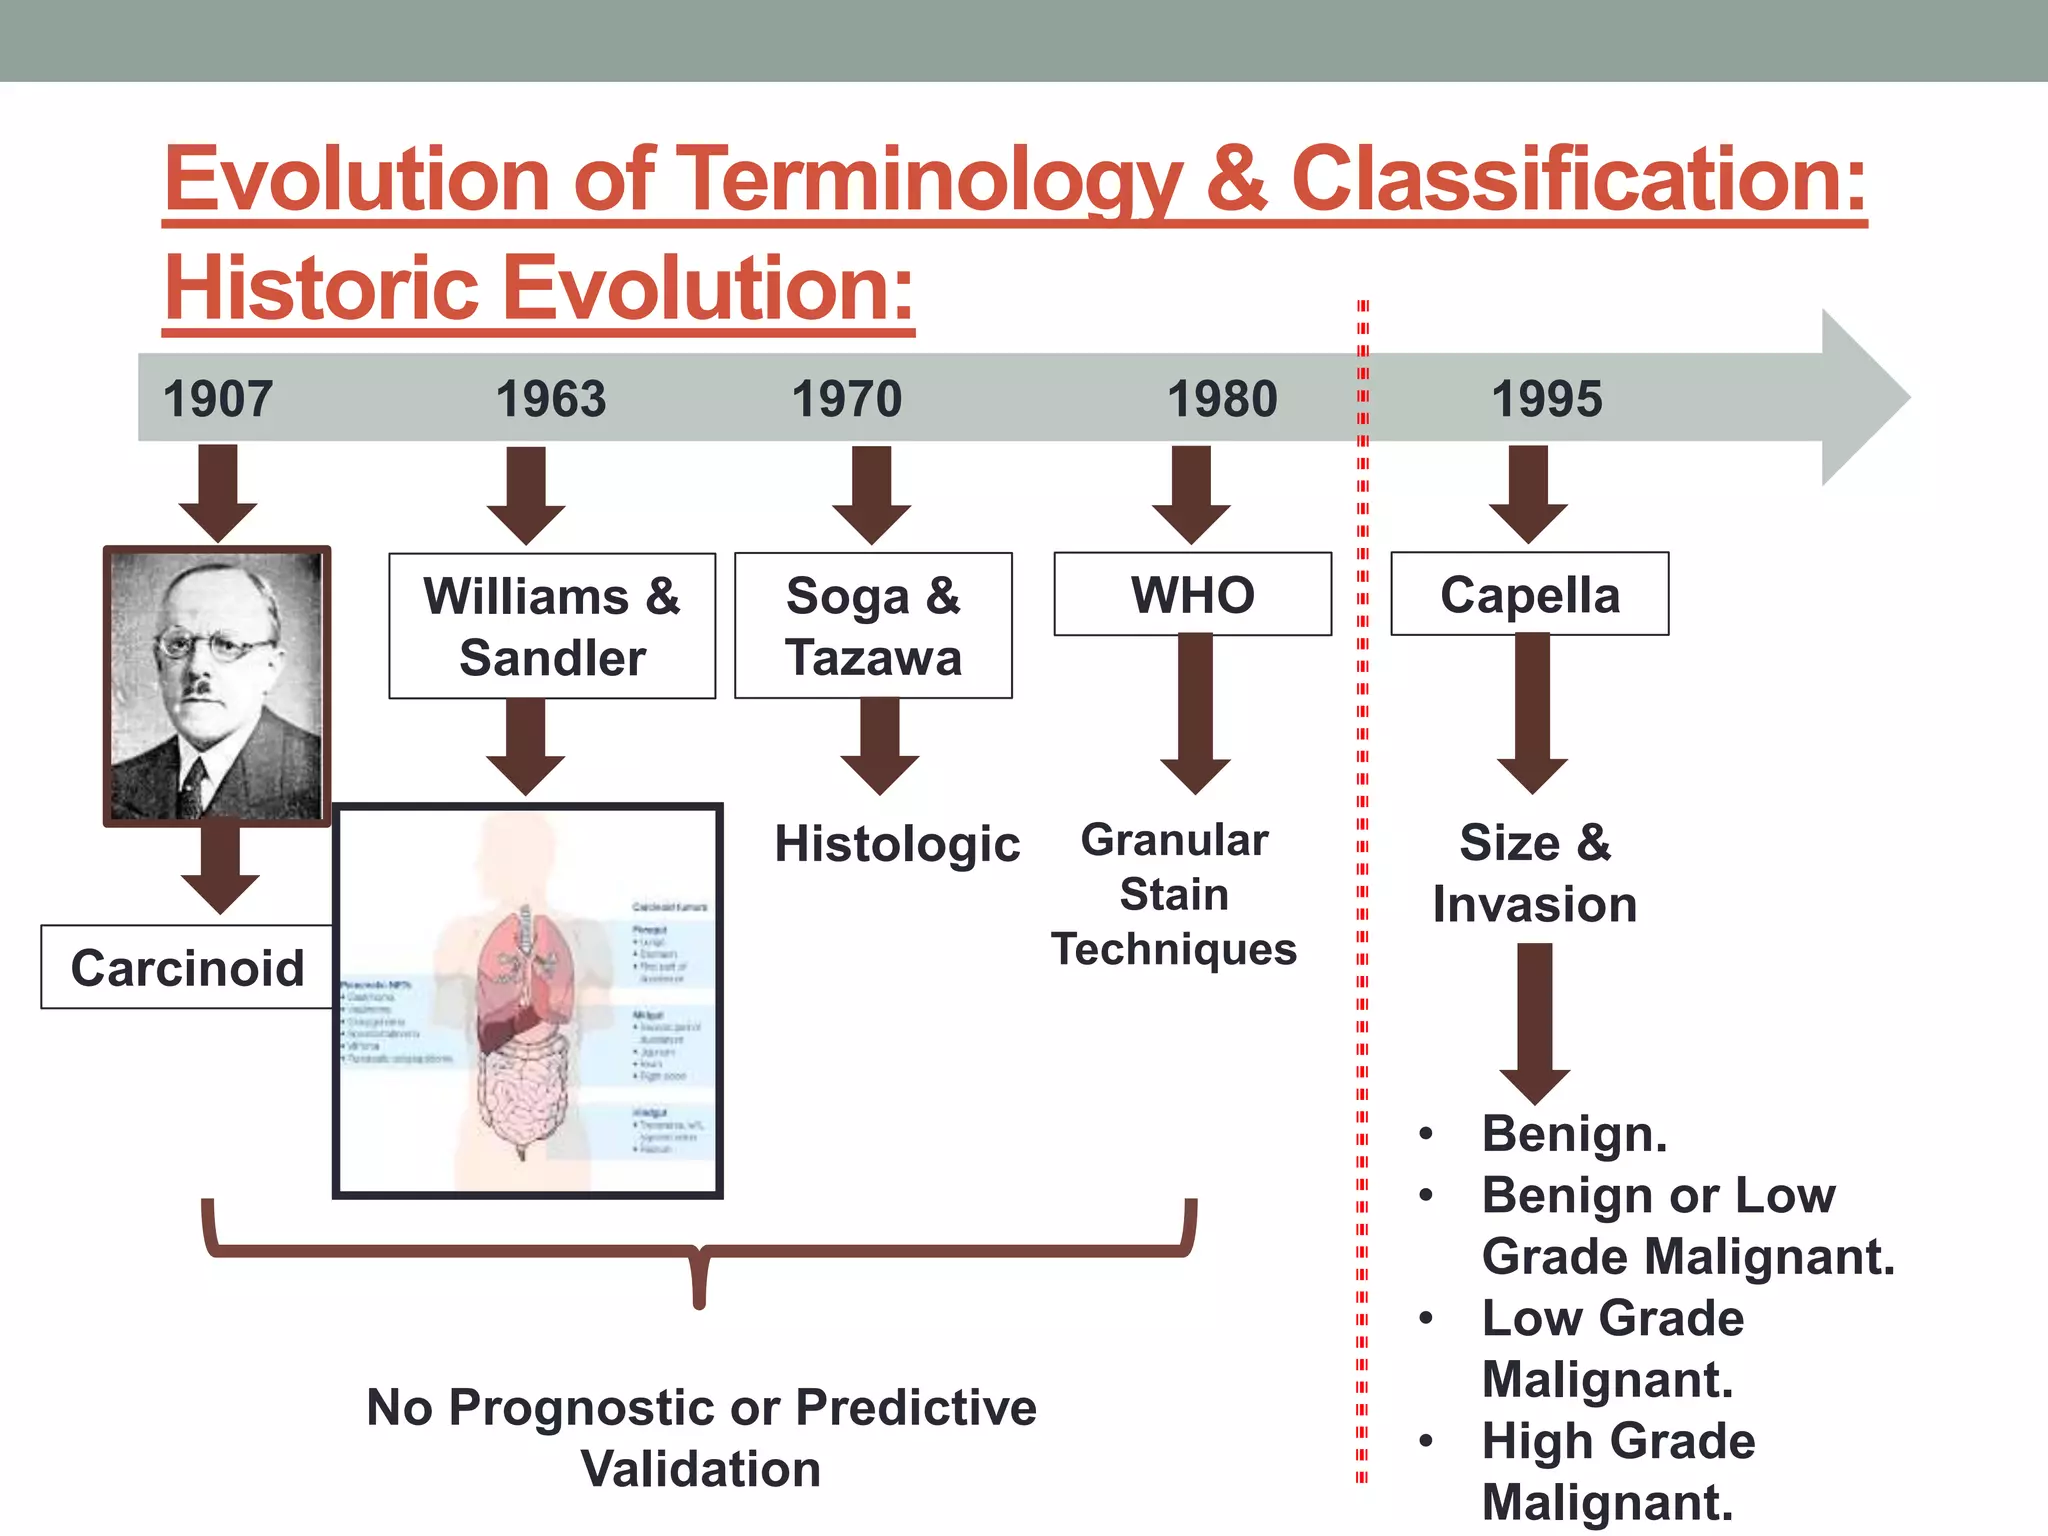
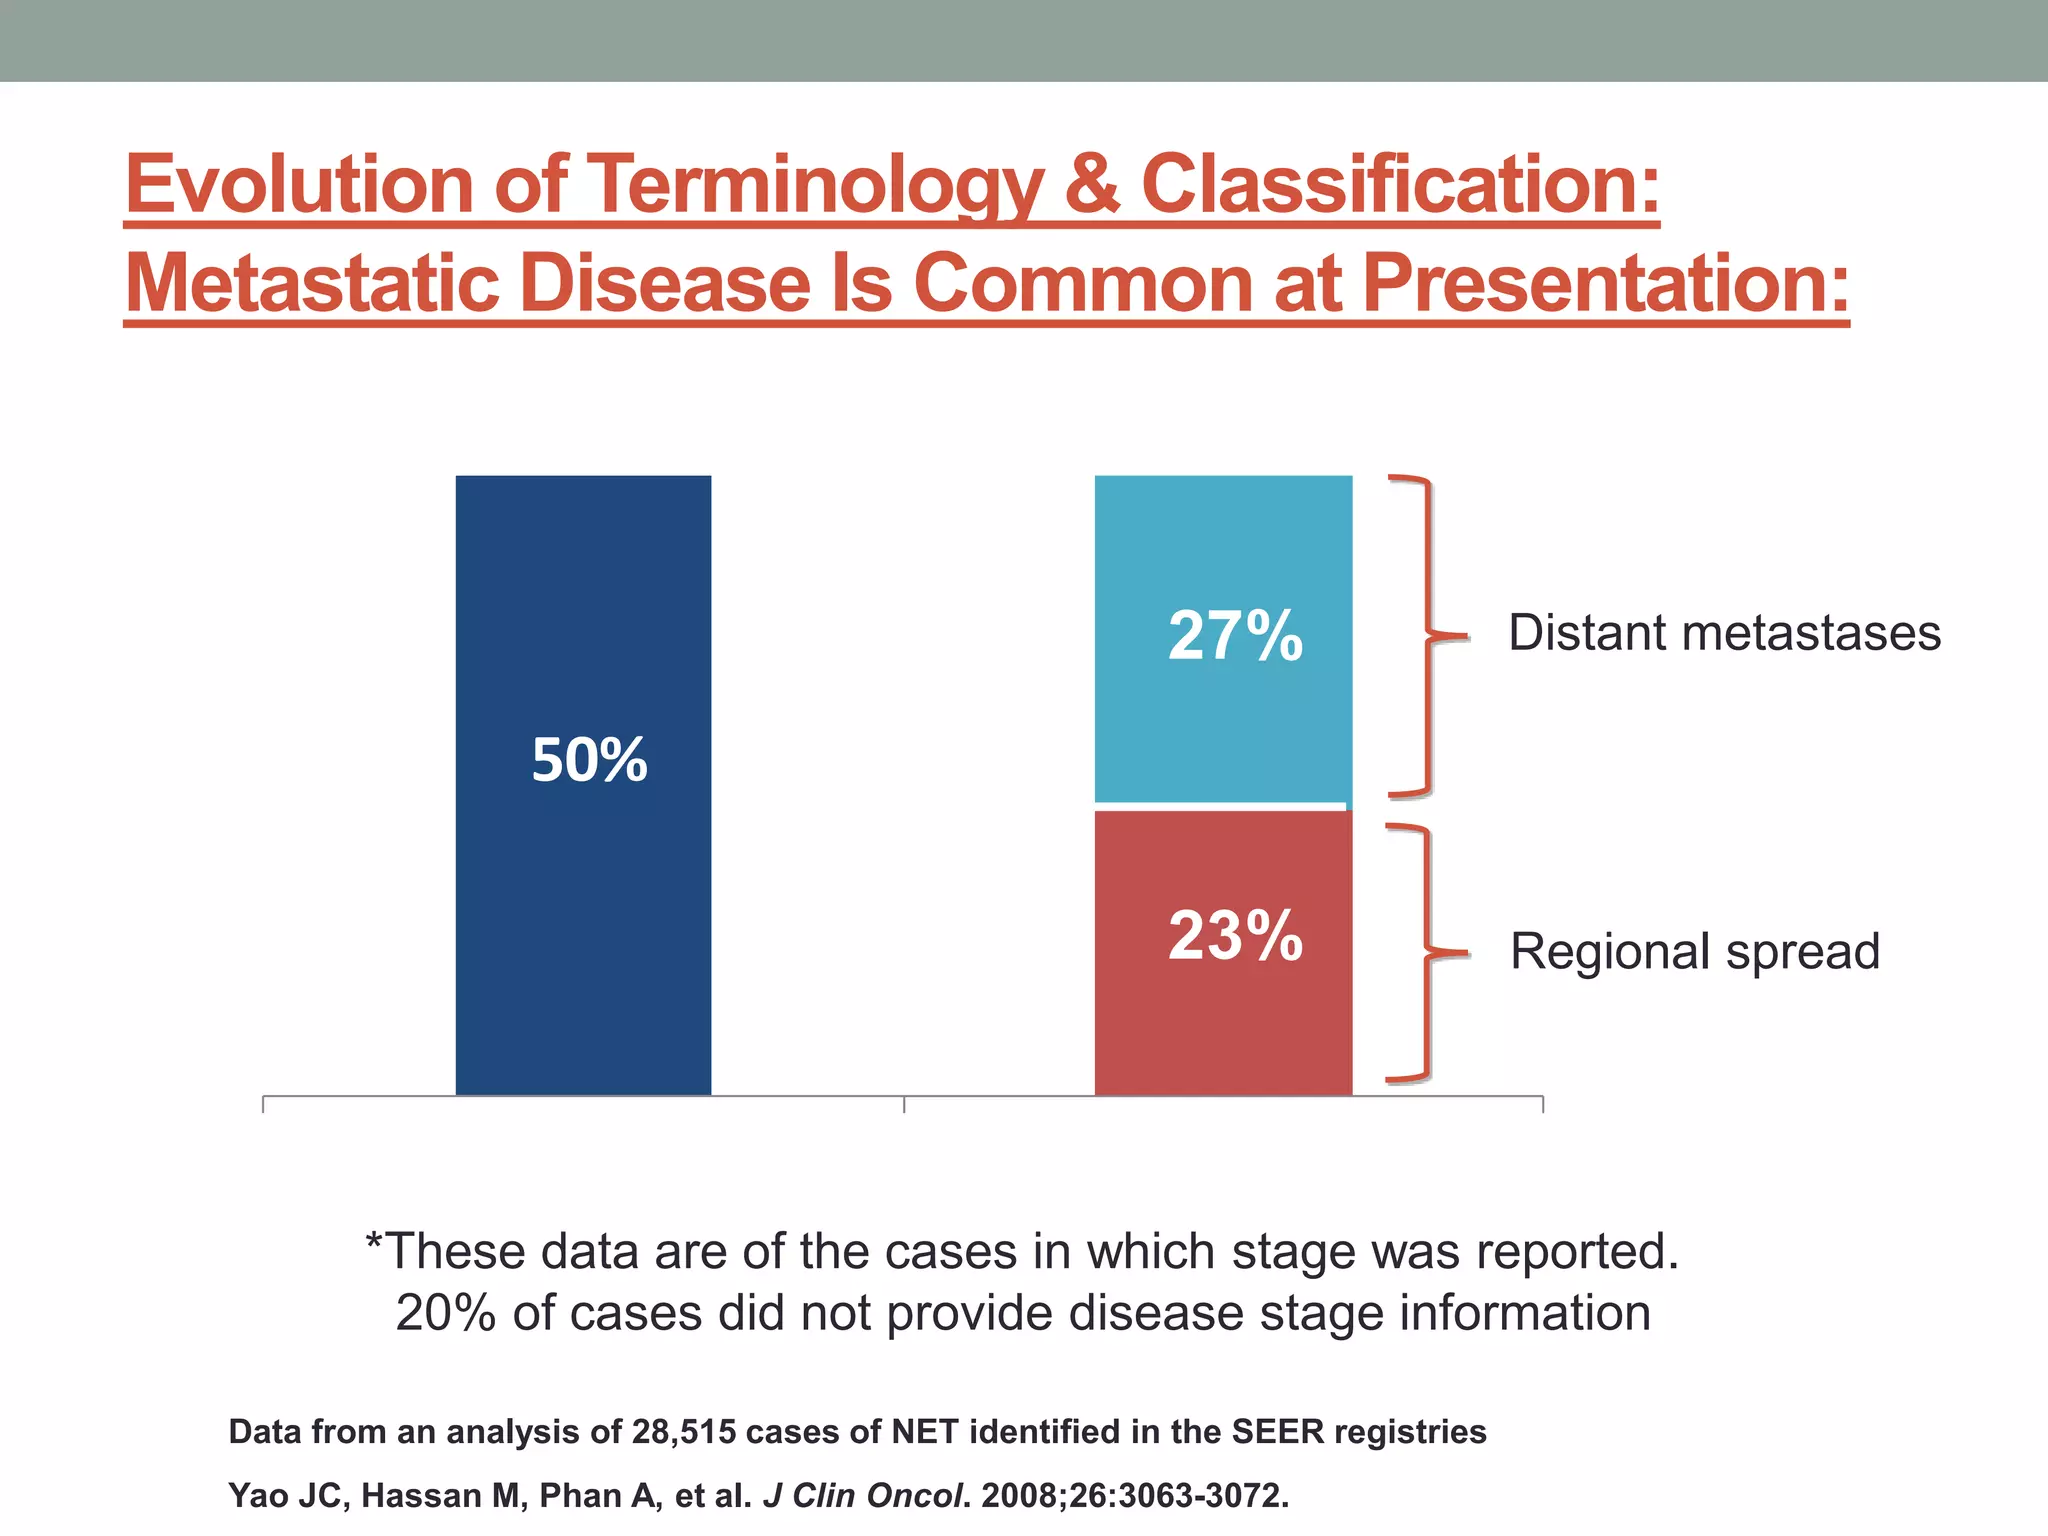
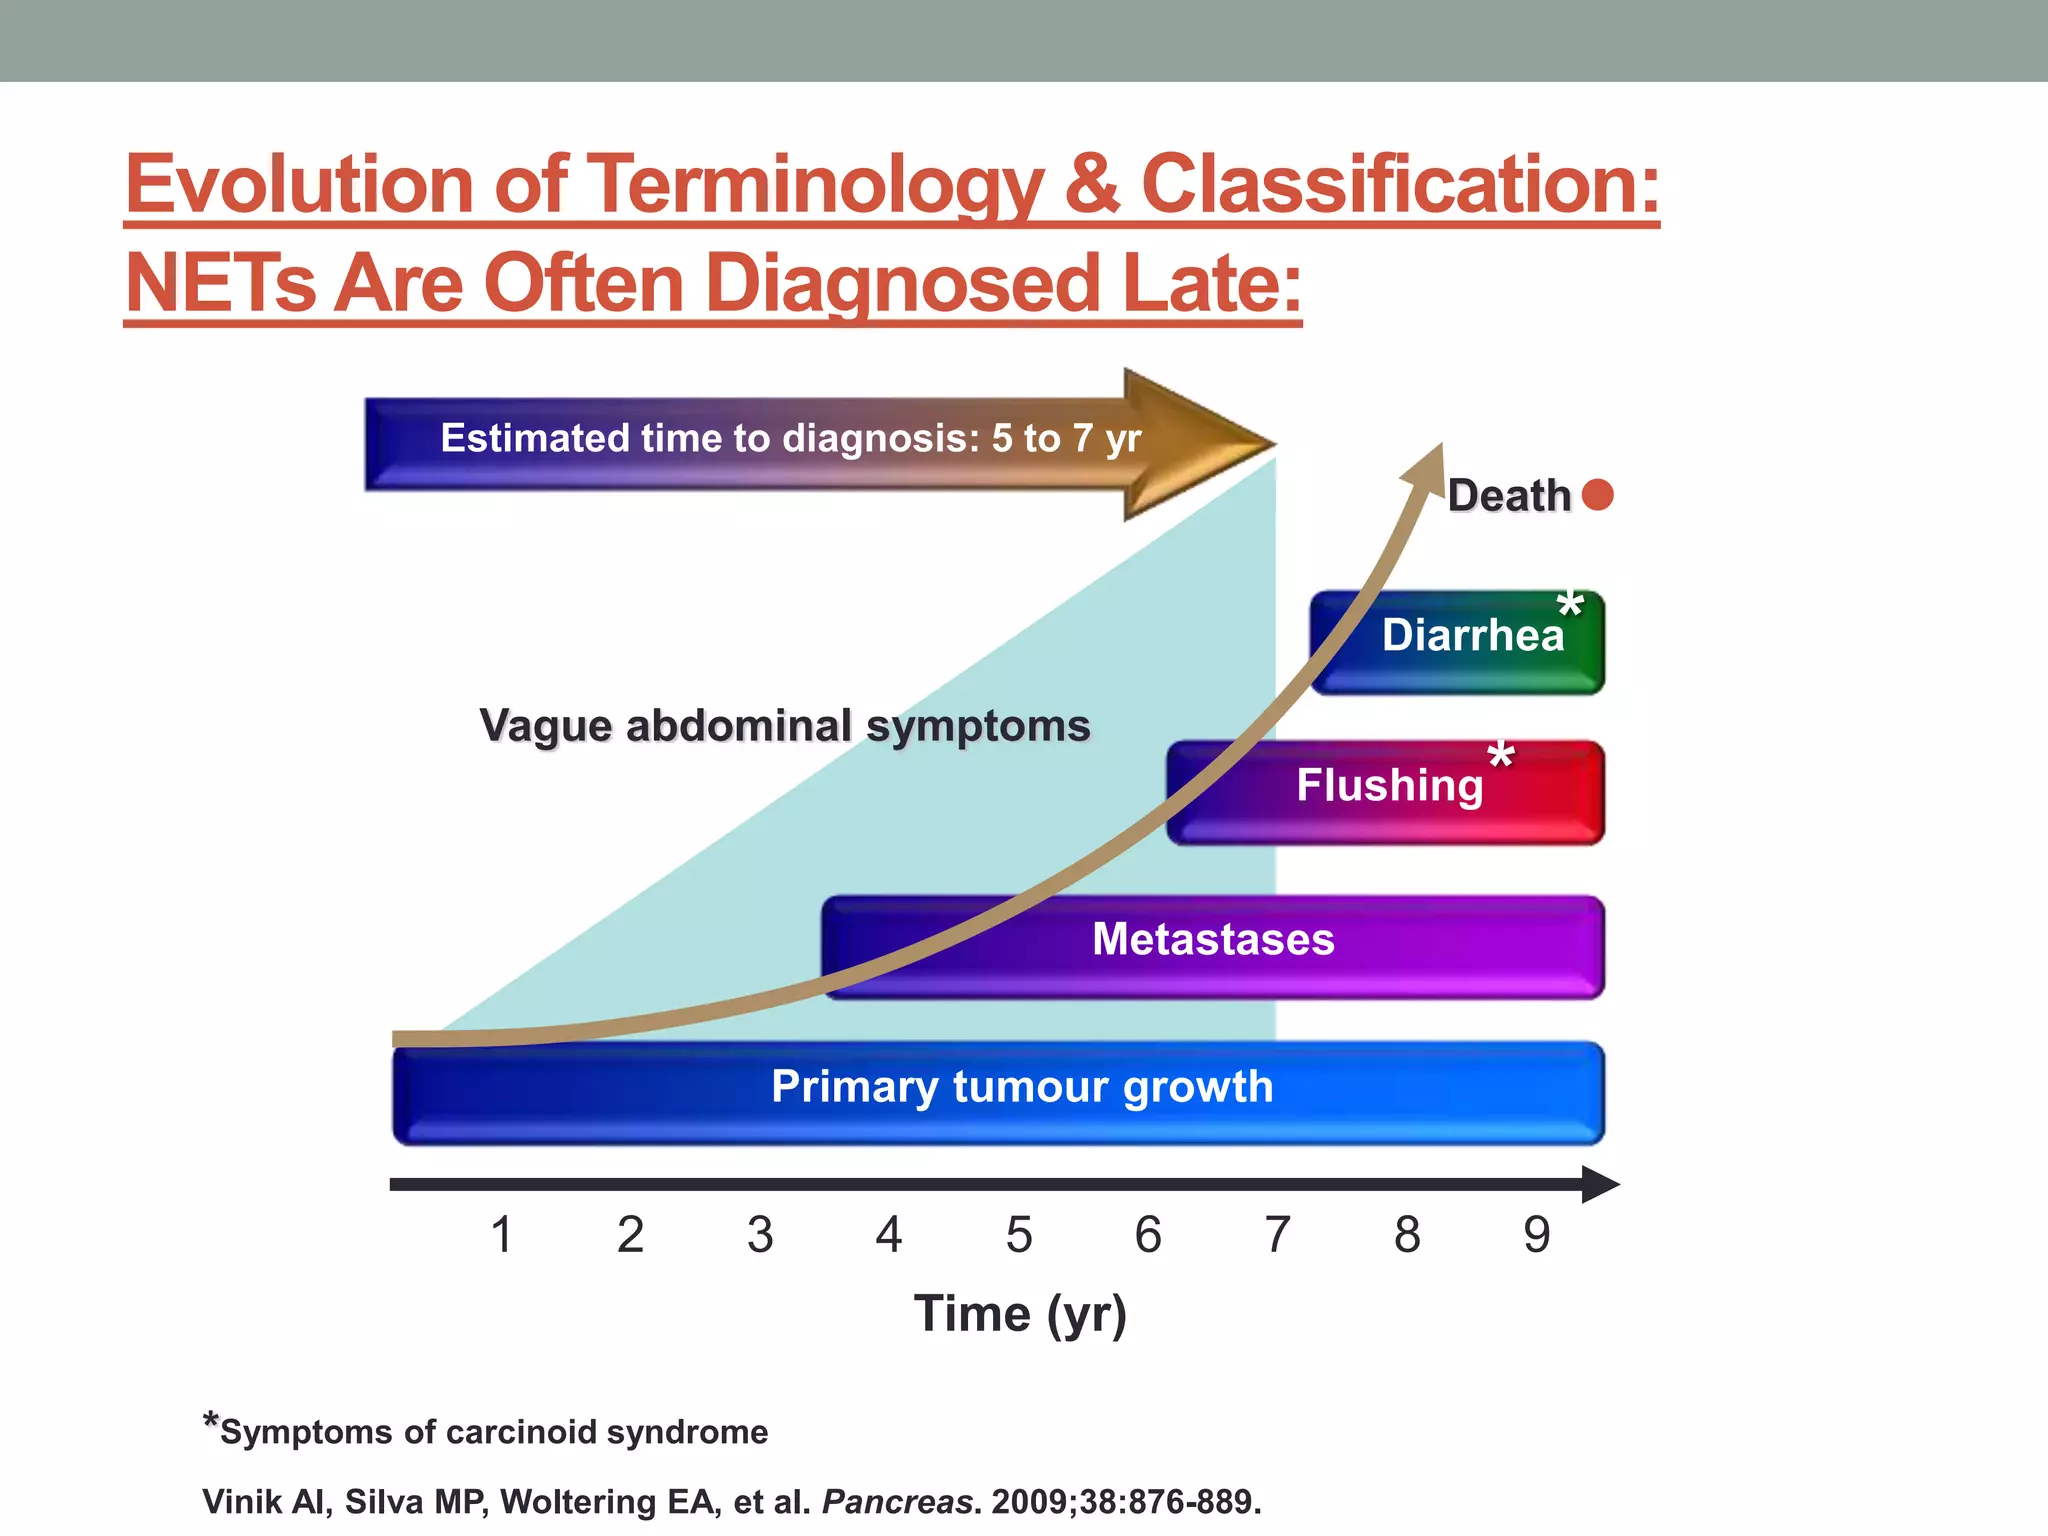
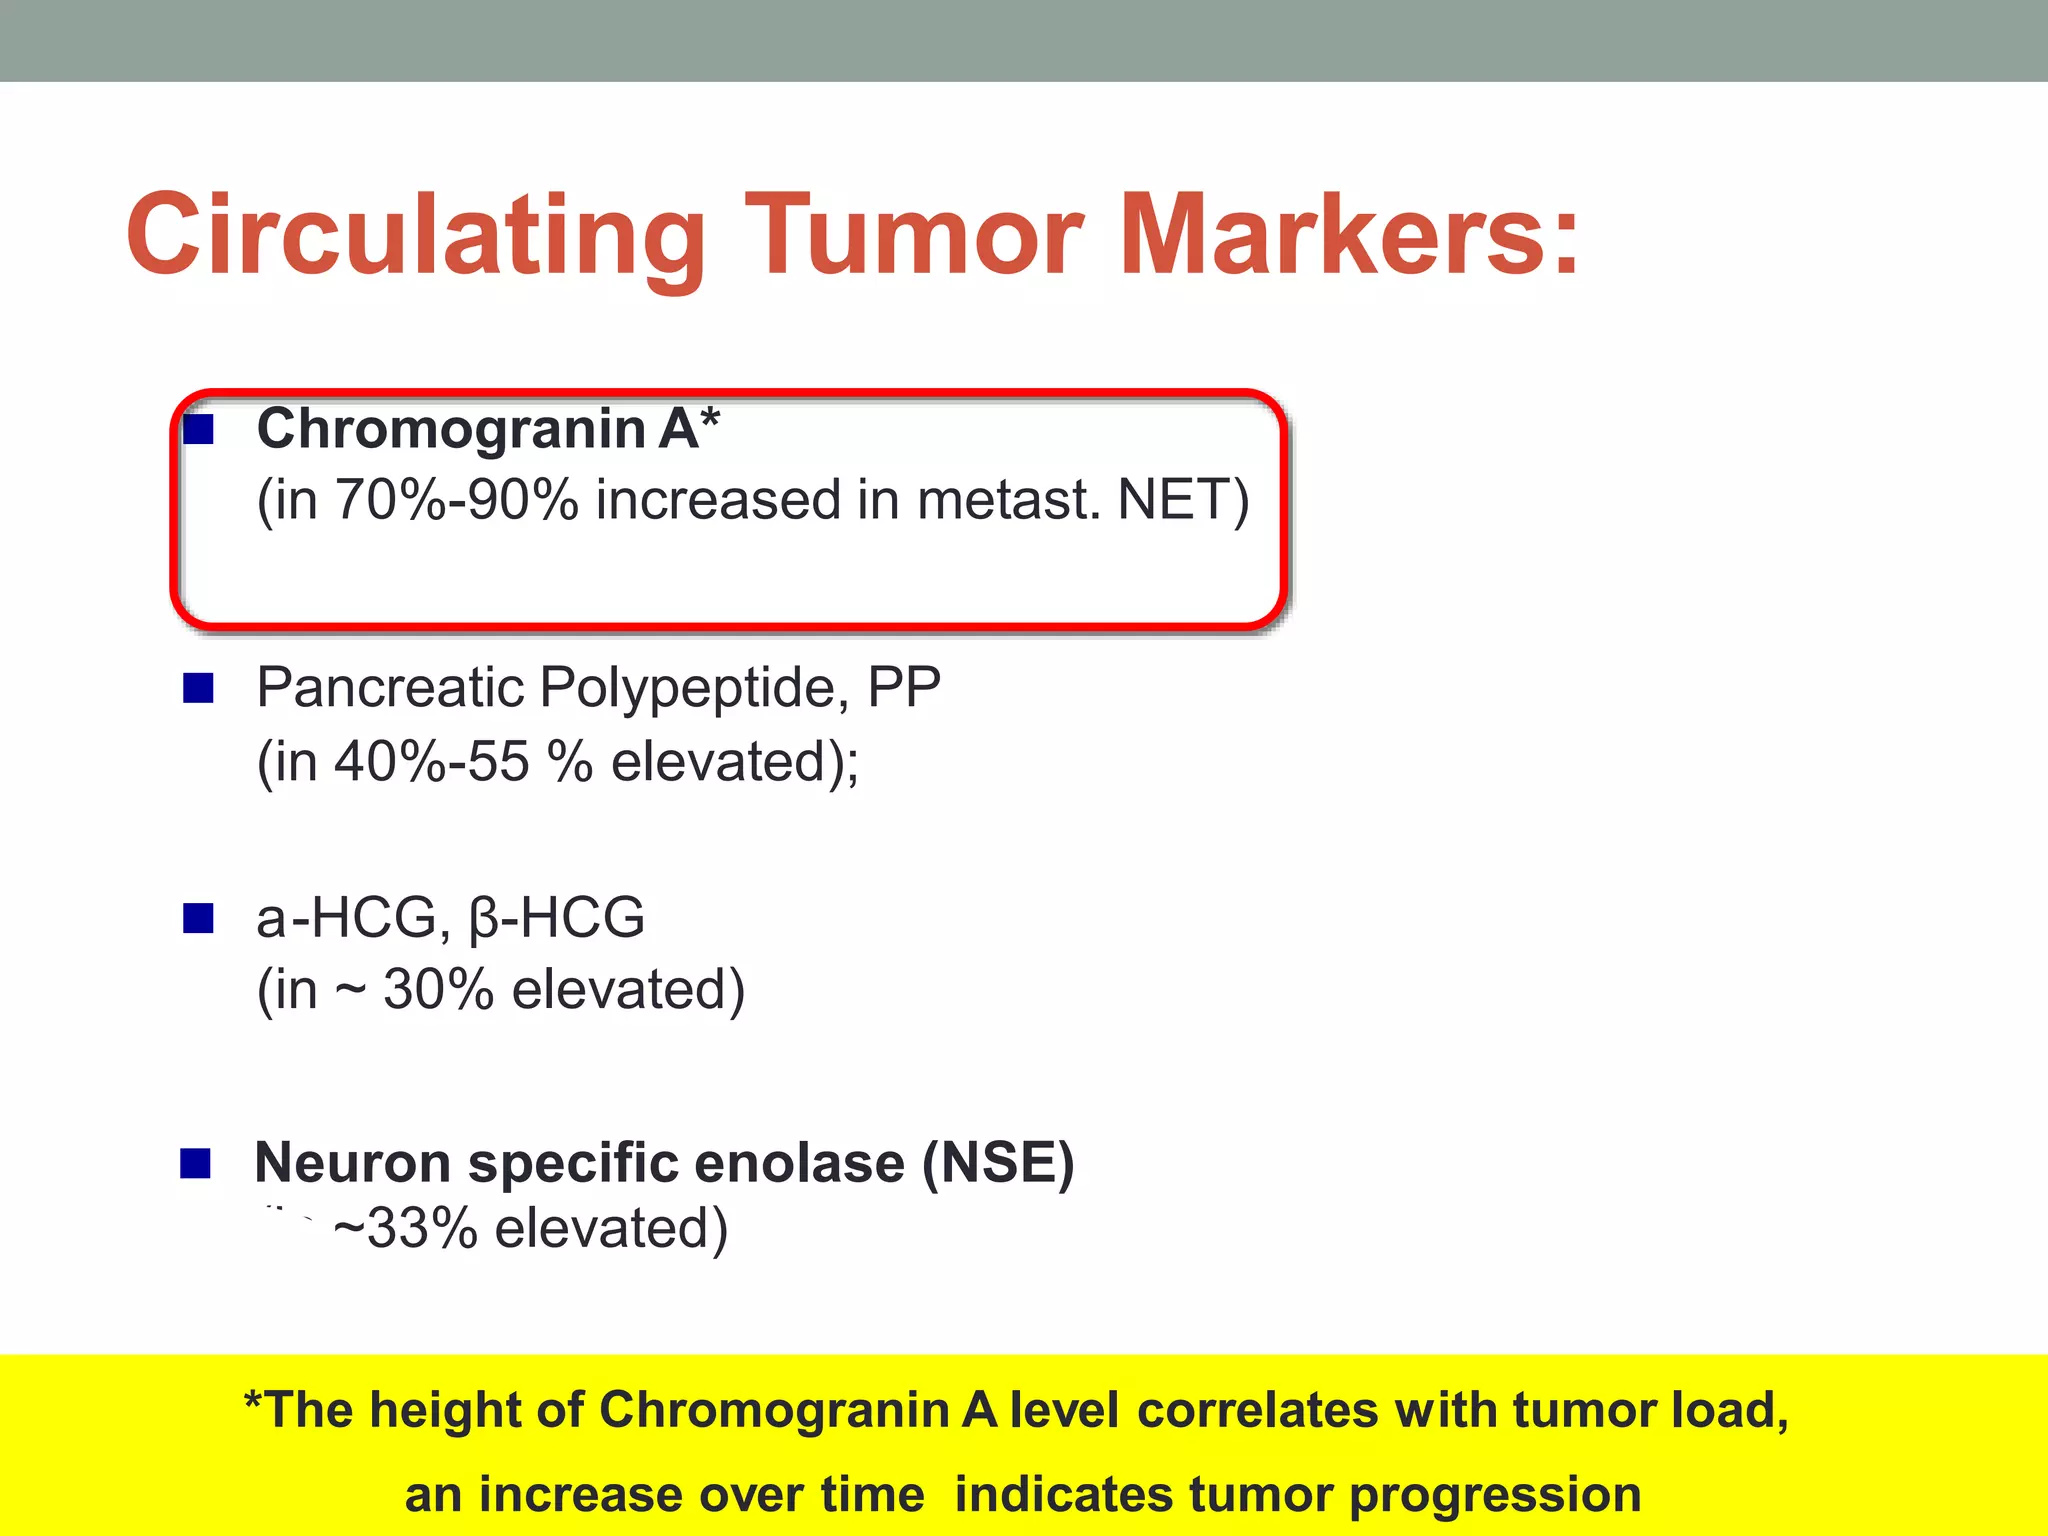
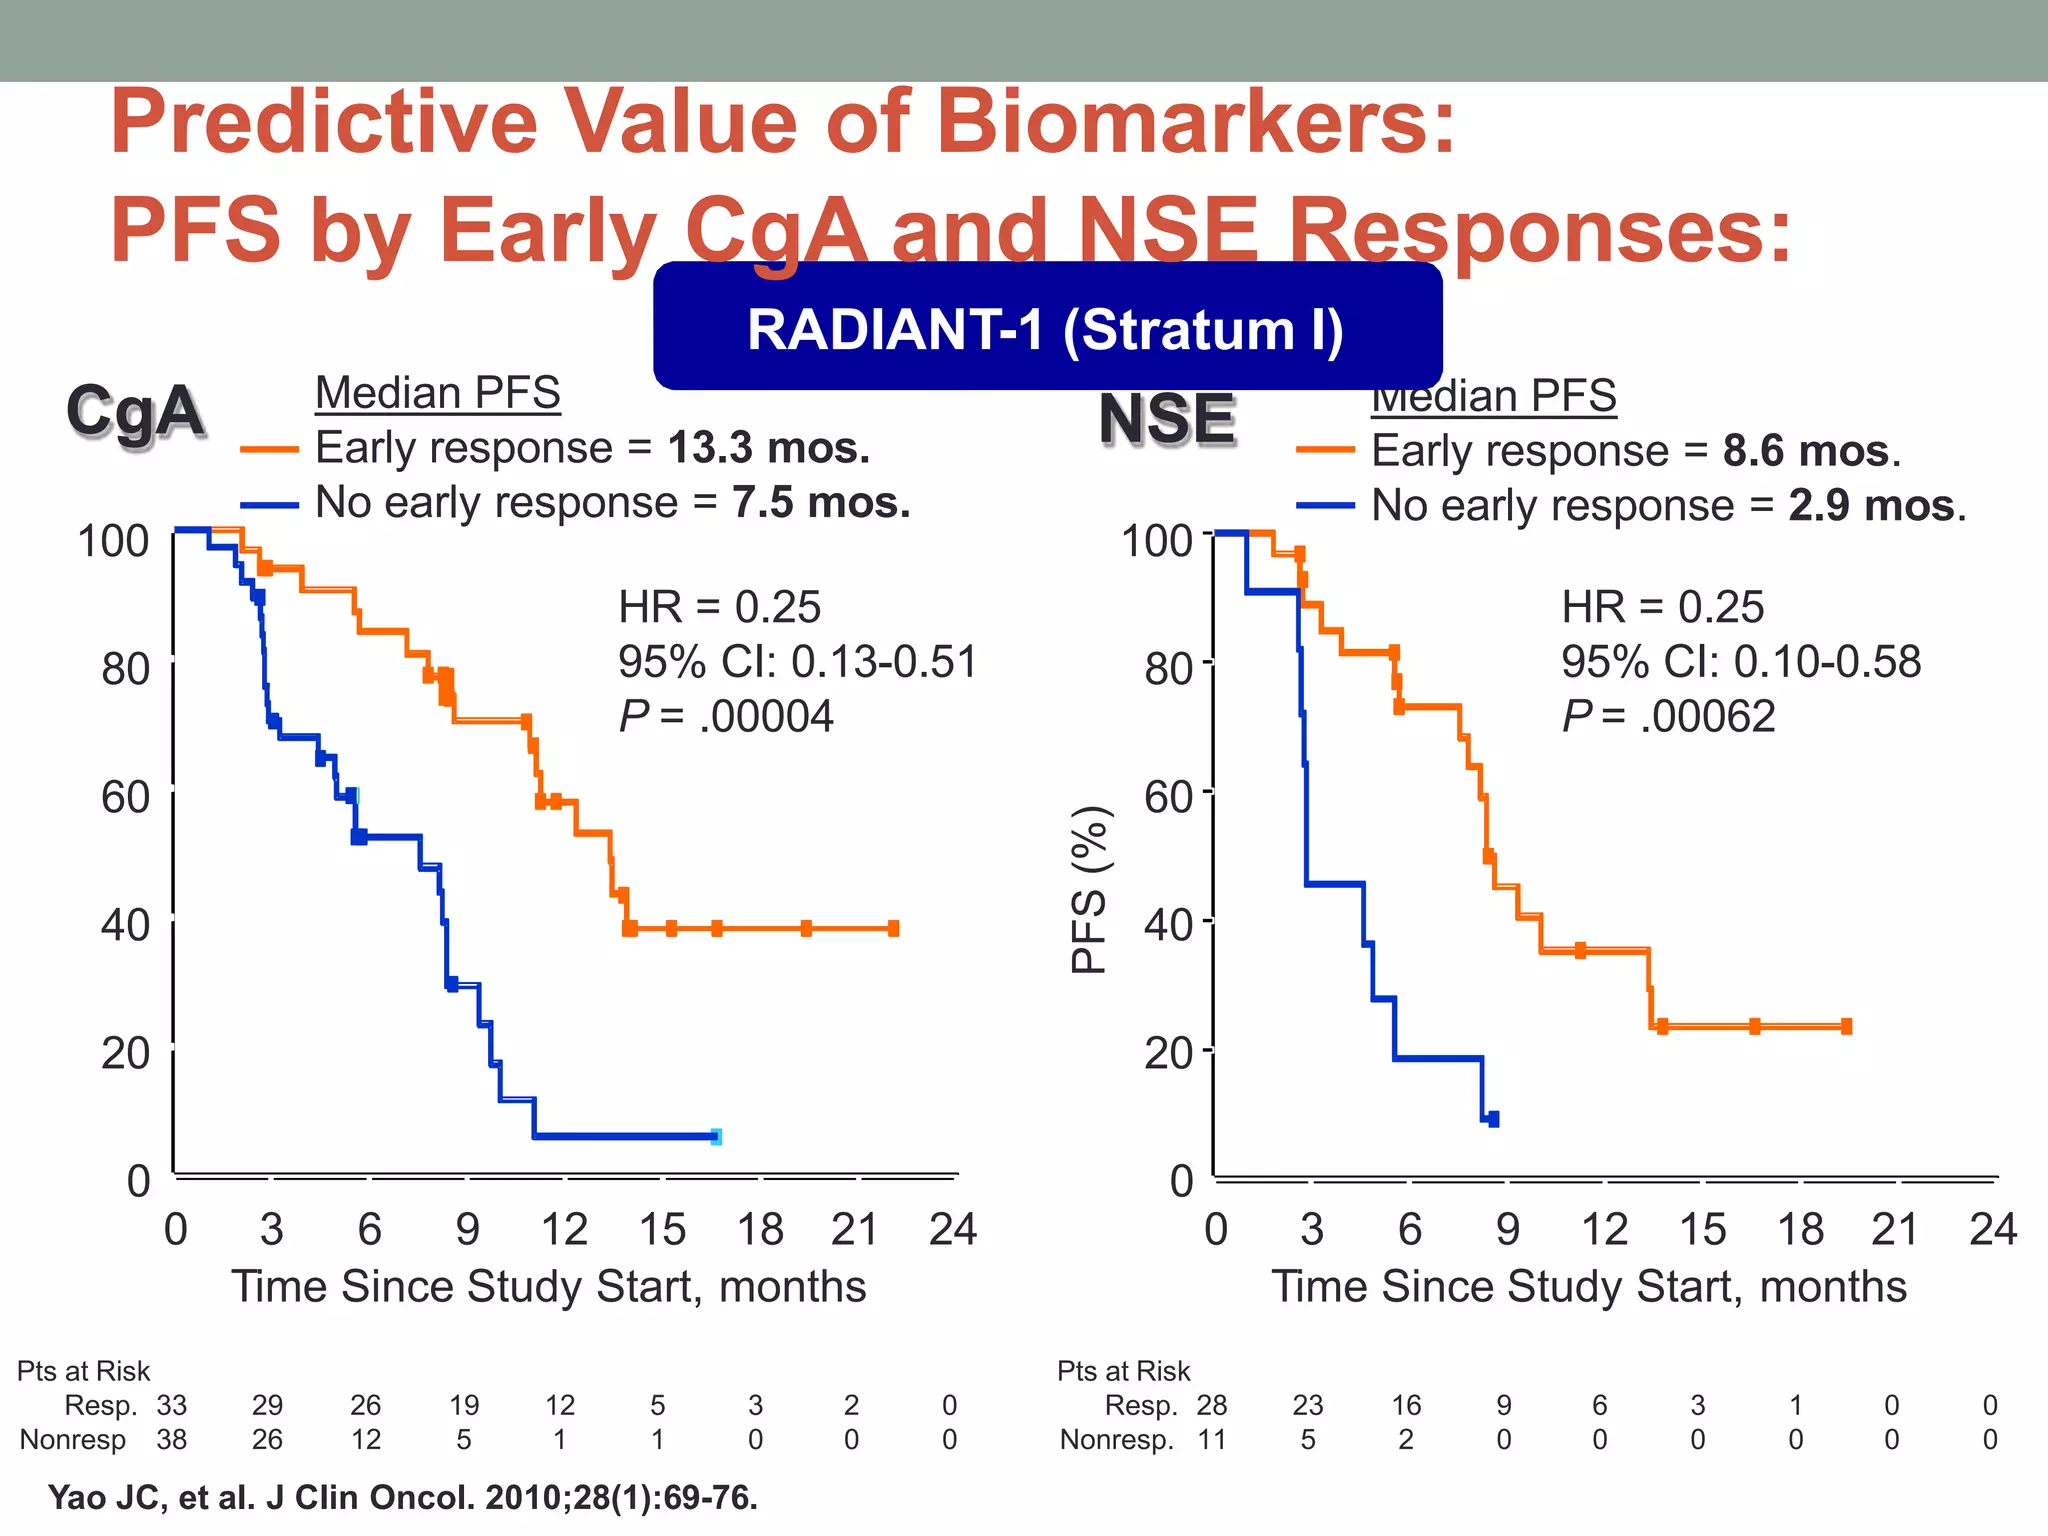
1) The document discusses the role of targeted therapy in neuroendocrine tumors. It covers topics such as the evolution of terminology and classification of NETs, the use of biomarkers and imaging in diagnosis and monitoring, and current therapeutic approaches including somatostatin analogs. 2) Somatostatin analogs like octreotide and lanreotide are effective in controlling hormonal symptoms in NET patients by binding to somatostatin receptors that are prevalent on many NETs. They have also shown inhibitory effects on tumor proliferation. 3) A phase III study showed octreotide LAR extended time to tumor progression compared to placebo in treatment-naïve patients with well-differentiated midgut NETs