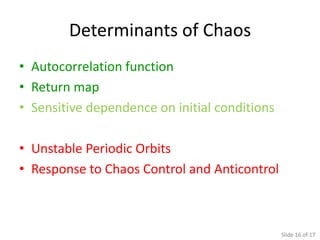
Slide 2 of 17
My MATLAB Simulation Data


                            Slide 3 of 17
My MATLAB Simulation Data


                            Slide 4 of 17
Time evolution of the overlaps:
                 3    0     0     1   0
                 3    0     0     1   0
                 3    0     0     1   0
                 3    0     0     1   0
                 3    0     0     1   0
                 3    0     0     1   0
                 0    3     1     0   1
                 0    3     1     0   1
                 0    3     1     0   1
                 0    3     1     0   1
                 0    3     1     0   1
                 0    3     1     0   1
                 0    1     3     0   0
                 0    1     3     0   0
                 0    1     3     0   0
                 0    1     3     0   0
                 0    1     3     0   0
                 0    1     3     0   0
                 1    0     0     3   0
                 1    0     0     3   0
                 1    0     0     3   0
                 1    0     0     3   0
                 1    0     0     3   0
                 1    0     0     3   0
                 0    1     0     0   3
                 0    1     0     0   3
                 0    1     0     0   3
                 0    1     0     0   3
                 0    1     0     0   3
                 0    1     0     0   3
                 3    0     0     1   0
                 3    0     0     1   0
                 3    0     0     1   0
                 3    0     0     1   0
                 3    0     0     1   0
                 3    0     0     1   0   Slide 5 of 17
Analyzing the Distributions


                              Slide 6 of 17
Analyzing the Distributions
Compare with a Monte Carlo simulation:


      But of course, the sequence also matters.
                                                  Slide 7 of 17
Logistic Equation: Time Series Plot
                  xi+1 = r xi (1-xi)


f(n)


                       n
                                             Slide 8 of 17
Logistic Equation: Graphical Iteration


Pts. on the return map


                                         Slide 9 of 17
Logistic Equation: First Return Map


f(n+1)


                         f(n)

                                               Slide 10 of 17
Logistic Equation: Return Map 2


f(n+2)


                      f(n)
                                           Slide 11 of 17
Logistic Map: Return Map 3


f(n+3)


                    f(n)
                                      Slide 12 of 17
Logistic Equation: Return Map 4


f(n+4)


                      f(n)
                                           Slide 13 of 17
Logistic Equation: Return Map 5


f(n+5)


                      f(n)
                                           Slide 14 of 17
Neural Network: First Return Map


                                   Slide 15 of 17
Determinants of Chaos
• Autocorrelation function
• Return map
• Sensitive dependence on initial conditions

• Unstable Periodic Orbits
• Response to Chaos Control and Anticontrol


                                               Slide 16 of 17
Sources
Physical Review E
pre.aps.org


Nature
nature.com


Chaos: the making of a new science
James Gleick

Python programming language
python.org

MATLAB® computing language
mathworks.in/products/matlab

Univ. of Yale online resources on chaos
classes.yale.edu/fractals/chaos/welcome.html

California State Univ. East Bay Hayward Statistics Dept. online resources
sci.csueastbay.edu/statistics/Resources/Essays/PoisExp.htm


                                                                            Slide 17 of 17

Stochastic Neural Network Model: Part 2