Downloaded 144 times
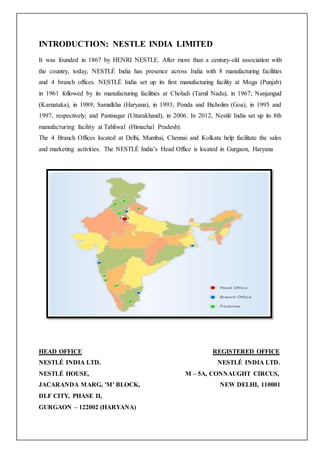


The document is a report on a study of the industrial performance practices at Nestle India Limited's Tahliwal plant, submitted for an MBA program. It outlines the company's history, operations, continuous excellence initiatives, and methods for optimizing performance through various management practices and key performance indicators. The report also includes research methodology, training experiences, and a SWOT analysis of the plant's performance and operational efficiency.
![14 Nestle Project[1]](https://cdn.slidesharecdn.com/ss_thumbnails/14-nestleproject1-091004010007-phpapp02-thumbnail.jpg?width=640&height=640&fit=bounds)


