Download to read offline
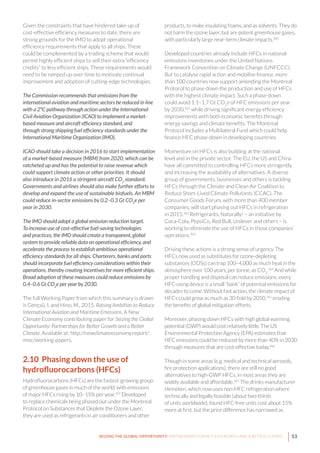
![41SEIZING THE GLOBAL OPPORTUNITY: PARTNERSHIPS FOR BETTER GROWTH AND A BETTER CLIMATE
of what is required.
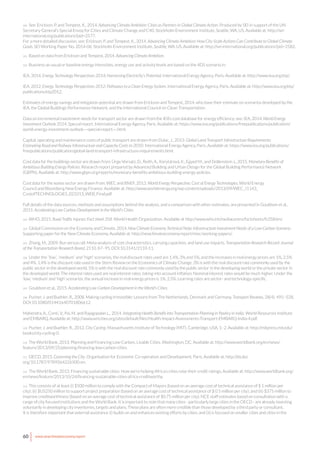
In 2014 China launched two pilot regional emissions
trading schemes (ETSs), bringing the total to seven; France
and Mexico implemented carbon taxes; Chile approved a
carbon tax, to start in 2018; and California and Quebec
linked their cap-and-trade programmes. In January 2015,
South Korea launched its ETS – one of the world’s largest
– and Portugal enacted a carbon tax. In April, Ontario
announced it will launch an ETS linked to the California
and Quebec schemes. Next year, China plans to transition
to a national carbon pricing system, and South Africa
plans to introduce a carbon tax. The European Union is
tightening its Emissions Trading System (EU ETS).204
After years of business opposition, many major companies,
including in high-emitting sectors such as oil and gas,
are now endorsing carbon pricing as well.205
They see it
as a way to drive efficiency and profitable new business
opportunities. More than 1,000 businesses and investors
signalled their support for carbon pricing at the UN
Climate Summit in September 2014, including BP, British
Airways, Cemex, Braskem, Royal Dutch Shell, Statkraft,
Unilever, Statoil and DONG Energy.206
In May, at the
Business & Climate Summit 2015 in Paris, 25 global
business networks representing more than 6.5 million
companies called for “robust and effective carbon pricing
mechanisms as a key component to gear investment and
orient consumer behaviour towards low-carbon solutions
and achieve global net emissions reduction at the least
economic costs”.207
In addition, at least 150 companies in
diverse sectors use an internal carbon price in assessing
investments.208
Major oil companies such as Shell, BP,
Exxon-Mobil and ConocoPhillips use a price of US$40
per tonne of CO2
e or more.209
The economic case
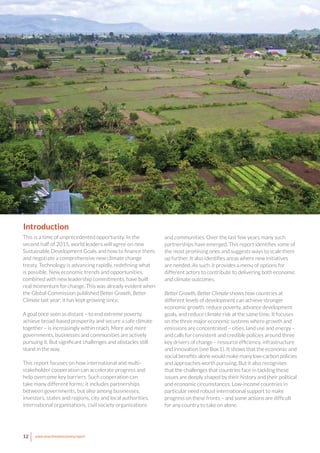
The growing support for carbon pricing reflects a
recognition that it is not only good climate policy, but also
a useful way to raise government revenue – one that is
less distorting than many existing taxes such as on labour
and business activities. The Canadian province of British
Columbia has used its carbon tax revenue, around 3% of
the total budget,210
to lower income and corporate taxes
and compensate low-income households. Quebec and
California use their permit auction revenues to fund low-
carbon technology advancement. EU ETS auction revenues
are used by Member States to fund innovation and climate-
and energy-related activities, among other things.211
The evidence on carbon pricing suggests that it is effective
at reducing emissions without harming the economy. In
the US, for example, the nine states that participate in the
Regional Greenhouse Gas Initiative (RGGI) have cut their
UNION
BRITISH
COLUMBIA
ONTARIO
NEW BRUNSWICK
BRAZIL
EUROPEAN
SOUTH
AFRICA
CHINA
KAZAKHSTAN
NEW
ZEALAND
SWITZERLAND
CHILE
UKRAINE
TURKEY
Saitama
Tokyo
Kyoto
Shanghai
Shenzhen
São Paulo
LATVIA
Beijing
Tianjin
Chongqing Shanghai
CALIFORNIA
OREGON
WASHINGTON
MANITOBA
QUÉBEC
PRINCE EDWARD
ISLANDNOVA
SCOTIA
HUBEI
GUANGDONG
FRANCE
MEXICO
THAILAND
JAPAN
ICELAND
IRELAND
NORWAY
SLOVENIA
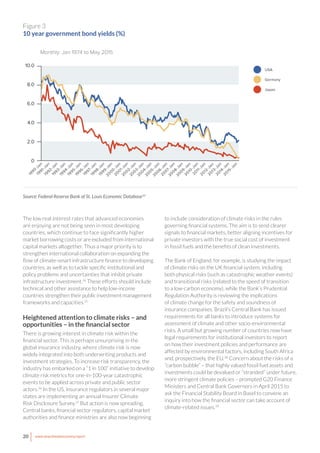
ETS implemented or scheduled for implementation
Carbon tax implemented or scheduled for implementation
ETS or carbon tax under consideration
ETS and carbon tax implemented or scheduled
ETS implemented or scheduled, carbon tax under consideration
Carbon tax implemented or scheduled, ETS under consideration
KOREA,
REP.
U.K.
DENMARK
SWEDEN
FINLAND
PORTUGAL
ALBERTA
R.G.G.I. [Regional Greenhouse Gas Initiative]
(Connecticut, Delaware, Maine, Maryland,
Massachussets, New Hampshire, New York,
Rhode Island, Vermont)
Rio de Janeiro
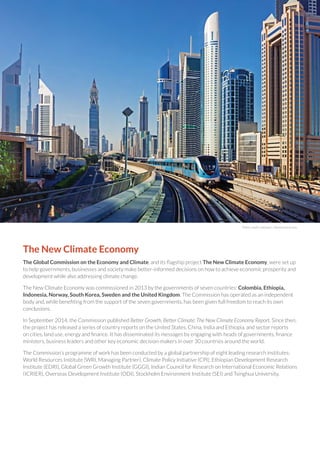
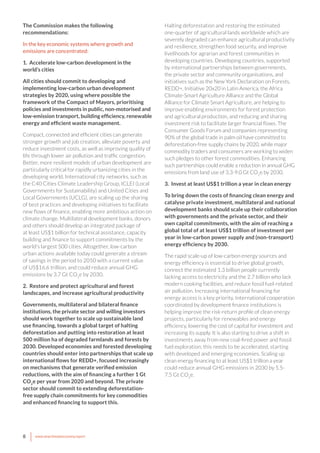
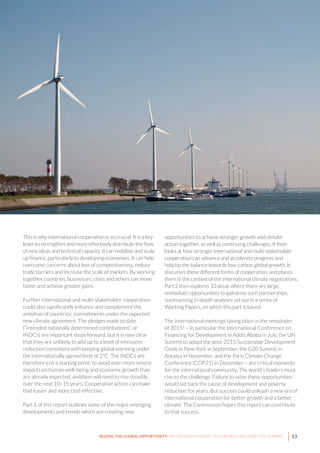
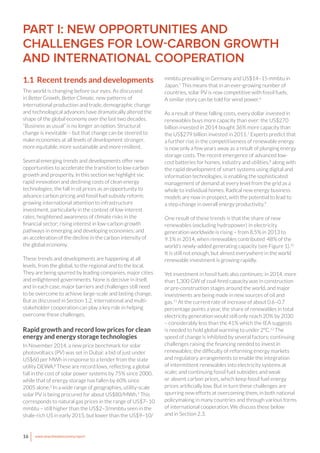
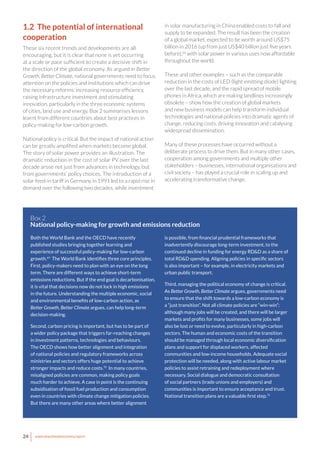
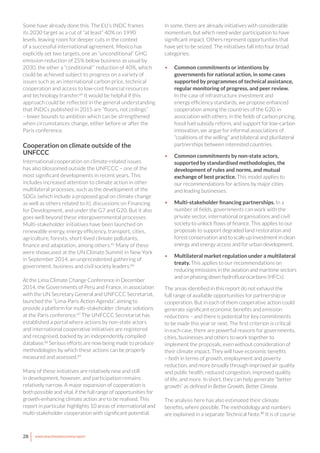
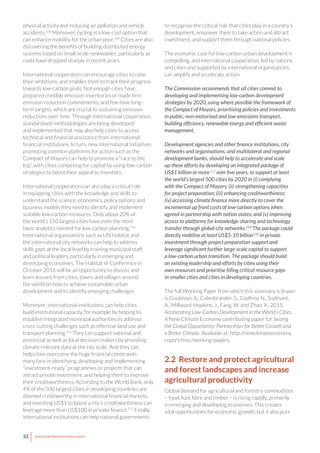
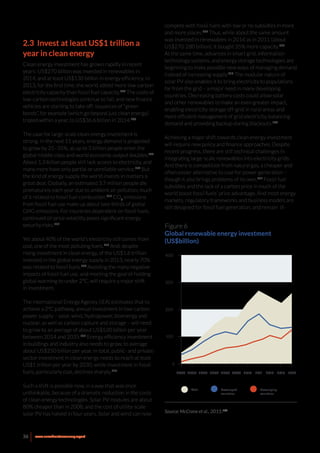
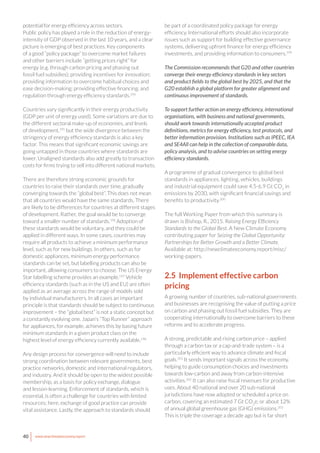
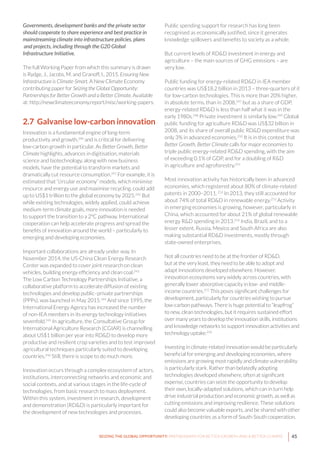
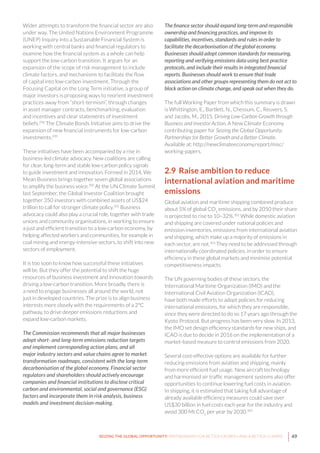
Figure 8
Summary of existing, emerging and potential carbon pricing instruments (emissions trading
schemes and tax).
Source: World Bank, 2015.212](https://image.slidesharecdn.com/nce-2015seizing-the-global-opportunityweb-150708211503-lva1-app6891/85/Seizing-the-Global-Opportunity-Partnerships-for-Better-Growth-and-a-Better-Climate-41-320.jpg)
![55SEIZING THE GLOBAL OPPORTUNITY: PARTNERSHIPS FOR BETTER GROWTH AND A BETTER CLIMATE
Endnotes
1 The full list of major international development meetings in 2015 includes the World Conference on Disaster Risk Reduction, which took place in
Sendai, Japan, in March.
2 Borgmann, M., 2014. Dubai’s DEWA procures the world’s cheapest solar energy ever: Riyadh, start your photocopiers. Apricum GmbH, 27 November.
Available at: http://www.apricum-group.com/dubais-dewa-procures-worlds-cheapest-solar-energy-ever-riyadh-start-photocopiers/.
3 See also: The Economist, 2015. Renewable Energy: Not a Toy. 11 April. Available at: http://www.economist.com/news/international/21647975-
plummeting-prices-are-boosting-renewables-even-subsidies-fall-not-toy.
4 van der Hoeven, M., 2015. Opportunity to act: Making smart decisions in a time of low oil prices. International Energy Agency presentation at the
Oxford Energy Colloquium. Available at: http://www.iea.org/newsroomandevents/speeches/150127_OxfordEnergyColloquiumspeech.pdf.
5 Quandl, n.d. Natural Gas Prices and Charts. Available at: https://www.quandl.com/c/markets/natural-gas [accessed 24 April 2015].
6 IRENA, 2015. Renewable Power Generation Costs in 2014. International Renewable Energy Agency, Masdar City. Available at: http://www.irena.org/
DocumentDownloads/Publications/IRENA_RE_Power_Costs_2014_report.pdf.
7 McCrone, A., Moslener, U., Usher, E., Grüning, C. and Sonntag-O’Brien, V. (eds.), 2015. Global Trends in Renewable Energy Investment 2015. Frankfurt
School-UNEP Collaborating Centre for Climate & Sustainable Energy Finance, United Nations Environment Programme, and Bloomberg New Energy
Finance. Available at: http://fs-unep-centre.org/publications/global-trends-renewable-energy-investment-2015.
8 Tesla Motors, 2015. Tesla Energy press kit. 30 April. Available at: http://www.teslamotors.com/presskit/teslaenergy.
See also: Naam, R., 2015. Why energy storage is about to get big – and cheap. Blog post, 14 April. Available at: http://rameznaam.com/2015/04/14/
energy-storage-about-to-get-big-and-cheap/.
9 Smith, N., 2015. Clean Energy Revolution is Ahead of Schedule. Bloomberg View, 8 April. Available at: http://www.bloombergview.com/
articles/2015-04-08/clean-energy-revolution-is-way-ahead-of-schedule.
10 McCrone et al., 2015. Global Trends in Renewable Energy Investment 2015.
11 Shearer, C., Ghio, N., Myllyvirta. L., and Nace, T., 2015. Boom and Bust: Tracking the Global Coal Plant Pipeline. Sierra Club. Available at: http://action.
sierraclub.org/site/DocServer/Coal_Tracker_report_final_3-9-15.pdf?docID=17381.
12 McCrone et al., 2015. Global Trends in Renewable Energy Investment 2015. IEA, 2014. World Energy Outlook 2014. International Energy Agency, Paris.
Available at: http://www.oecd-ilibrary.org/ content/book/weo-2014-en.
IEA, 2014. World Energy Outlook 2014. International Energy Agency, Paris. Available at: http://www.oecd-ilibrary.org/ content/book/weo-2014-en.
13 Liebreich, M., 2015. State of the Industry Keynote. Presented at the Bloomberg New Energy Finance Annual Summit, New York, 14 April. Available
at: http://about.bnef.com/presentations/liebreich-state-industry-keynote/.
14 Baffes, J., Kose, M.A., Ohnsorge, F. and Stocker, M., 2015. The Great Plunge in Oil Prices: Causes, Consequences and Policy Responses. World Bank Group,
Washington, DC. Available at: http://www.worldbank.org/content/dam/Worldbank/Research/PRN01_Mar2015_Oil_Prices.pdf.
15 Blanchard, O., and Arezki, R., 2014. Seven Questions About the Recent Oil Price Slump. iMFdirect – The IMF Blog. International Monetary Fund, 22
December. Available at: http://blog-imfdirect.imf.org/2014/12/22/seven-questions-about-the-recent-oil-price-slump/.
16 Klevnäs, P., Stern, N. and Frejova, J., 2015. Oil Prices and the New Climate Economy. New Climate Economy briefing paper. Global Commission on the
Economy and Climate and Stockholm Environment Institute, Stockholm. Available at: http://newclimateeconomy.report/misc/working-papers/.
17 Federal Reserve Bank of St. Louis Economic Database (FRED). Available at: http://research.stlouisfed.org/fred2/.
18 Ibid.
19 One estimate finds fossil fuel subsidies to have contributed a staggering 36% of global CO2
emissions in 1980–2010. See Stefanski, R., 2014. Dirty
Little Secrets: Inferring Fossil-Fuel Subsidies from Patterns in Emission Intensities. Laval University and University of Oxford, April 2014. Available at: http://
www.oxcarre.ox.ac.uk/files/OxCarreRP2014134%281%29.pdf.
On health impacts of outdoor air pollution, see WHO, 2014. Ambient (outdoor) Air Quality and Health. Fact Sheet No. 313. World Health Organization,
Geneva. Available at: http://www.who.int/ mediacentre/factsheets/fs313/en/.
20 The World Bank, 2015. Carbon Pricing Watch 2015: An Advance Brief from the State and Trends of Carbon Pricing 2015 Report, to Be Released Late
2015. Washington, DC. Available at: http://documents.worldbank.org/curated/en/2015/05/24528977/carbon-pricing-watch-2015-advance-brief-
state-trends-carbon-pricing-2015-report-released-late-2015.
21 The World Bank, 2015. Carbon Pricing Watch 2015: An Advance Brief from the State and Trends of Carbon Pricing 2015 Report, to Be Released
Late 2015. Washington, DC. Available at: http://documents.worldbank.org/curated/en/2015/05/24528977/carbon-pricing-watch-2015-advance-
brief-state-trends-carbon-pricing-2015-report-released-late-2015.
22 2013 data are from: IEA, 2014, World Energy Outlook 2014.
OECD figures are the estimated range for 2005–2011. See: OECD, 2013. Inventory of Estimated Budgetary Support and Tax Expenditures for Fossil Fuels
2013. Organisation for Economic Co-operation and Development, Paris. Available at: http://dx.doi.org/10.1787/9789264187610-en.
23 IEA, 2014, World Energy Outlook 2014.](https://image.slidesharecdn.com/nce-2015seizing-the-global-opportunityweb-150708211503-lva1-app6891/85/Seizing-the-Global-Opportunity-Partnerships-for-Better-Growth-and-a-Better-Climate-55-320.jpg)
![57SEIZING THE GLOBAL OPPORTUNITY: PARTNERSHIPS FOR BETTER GROWTH AND A BETTER CLIMATE
45 Zhang, C., Zadek, S., Chen, N. and Halle, M., 2015. Greening China’s Financial System: Synthesis Report. International Institute for Sustainable
Development and China Development Research Center. Available at: https://www.iisd.org/publications/greening-chinas-financial-system.
46 Zuckerman, J., Nelson, D. and Frejova, J., 2015. Investing at Least a Trillion Dollars a Year in Clean Energy. A New Climate Economy contributing paper
for Seizing the Global Opportunity: Partnerships for Better Growth and a Better Climate. Available at: http://newclimateeconomy.report/misc/working-papers.
47 Bank of America, 2014. Bank of America Announces $10 Billion Catalytic Finance Initiative to Accelerate Clean Energy Investments that Reduce
Carbon Emissions. Press release, 23 September. Available at: http://newsroom.bankofamerica.com/press-releases/corporate-and-investment-banking-
sales-and-trading-treasury-services/bank-america-ann.
Citi, n.d. Environmental Finance. Available at: http://www.citigroup.com/citi/environment/opportunities.htm [accessed 4 June, 2015].
48 The World Bank, 2012. Inclusive Green Growth: The Pathway to Sustainable Development. Washington, DC. Available at: http://siteresources.
worldbank.org/EXTSDNET/Resources/Inclusive_Green_Growth_May_2012.pdf.
See also: Green Growth Knowledge Platform: http://www.greengrowthknowledge.org.
Green Growth Best Practice Network, 2014. Green Growth in Practice: Lessons from Country Experiences. Available at: http://www.
greengrowthknowledge.org/resource/green-growth-practice-lessons-country-experiences.
49 Government of Rwanda, 2011. Green Growth and Climate Resilience: National Strategy for Climate Change and Low Carbon Development. Kigali. Available
at http://cdkn.org/wp-content/uploads/2010/12/Rwanda-Green-Growth-Strategy-FINAL1.pdf
50 Federal Democratic Republic of Ethiopia, 2011. Ethiopia’s Climate-Resilient Green Economy. Available at: http://www.undp.org/content/dam/ethiopia/
docs/Ethiopia%20CRGE.pdf.
Woldeyes, F. and Bishop, R., 2015. Unlocking the Power of Ethiopia’s Cities. Report by Ethiopia’s New Climate Economy Partnership. Ethiopian
Development Research Institute and Global Green Growth Institute, Addis Ababa. Available at: http://static.newclimateeconomy.report/wp-content/
uploads/2015/03/Unlocking-the-Power-of-Cities-in-Ethiopia.pdf
51 Africa Progress Panel, 2015. Power, People, Planet: Seizing Africa’s Energy and Climate Opportunities. Africa Progress Report 2015. Geneva Available at:
http://www.africaprogresspanel.org/publications/policy-papers/2015-africa-progress-report/.
52 Ibid.
53 Cheung, R., Delio, E., Lall, S., Bairiganjan, S., Fuente, D. and Singh, S., 2010. Power to the People: Investing in Clean Energy for the Base of the Pyramid in
India. Centre for Development Finance, Institute for Financial Management & Research, and World Resources Institute, Chennai, India. Available at:
http://www.wri.org/publication/power-people.
54 BP, 2015. BP Statistical Review of World Energy June 2015. Available at: http://www.bp.com/en/global/corporate/about-bp/energy-economics/
statistical-review-of-world-energy.html.
Green, F., and Stern, N., 2015. China’s “New Normal”: Structural Change, Better Growth, and Peak Emissions. Grantham Research Institute on Climate
Change and Environment and Centre for Climate Change Economics and Policy. Available at: http://www.lse.ac.uk/GranthamInstitute/wp-content/
uploads/2015/06/Chinas_new_normal_green_stern_June_2015.pdf.
55 IRENA, 2015. Renewable Energy Capacity Statistics 2015. International Renewable Energy Agency, Masdar City. Available at: http://www.irena.org/
DocumentDownloads/Publications/IRENA_RE_Capacity_Statistics_2015.pdf.
56 China Dialogue, 2011. China’s Green Revolution: Energy, Environment and the 12th Five-Year Plan. Beijing. Available at: https://www.chinadialogue.net/
UserFiles/File/PDF_ebook001.pdf.
57 The Green Growth Knowledge Platform (http://www.greengrowthknowledge.org/), the Low Emissions Development Global Partnership (http://
ledsgp.org/about/how), the Climate and Development Knowledge Network (http://cdkn.org) and the Global Green Growth Institute (http://www.gggi.
org) are among initiatives providing resources for learning and dissemination of best practice in low-carbon development and growth strategies.
58 IEA, 2015. World Energy Outlook 2015 Special Report on Energy and Climate Change. International Energy Agency, Paris. Available at: http://www.
worldenergyoutlook.org.
59 IEA, 2015. World Energy Outlook 2015 Special Report on Energy and Climate Change.
60 Bloomberg Business, 2015. China Carbon Emissions Decline as 2014 Global CO2
Stays Flat. 13 March. Available at: http://www.bloomberg.com/
news/articles/2015-03-13/china-s-carbon-emissions-drop-for-the-first-time-since-2001.
61 IEA, 2015. Energy Technology Perspectives 2015 – Mobilising Innovation to Accelerate Climate Action. International Energy Agency, Paris. Available at:
http://www.iea.org/etp/etp2015/.
The energy intensity of GDP provides a rough index of the efficiency of energy use, although it also reflects a variety of other influences such as
structural change in the economy. The carbon intensity of energy mainly reflects the proportion of fossil fuels in the overall energy fuel mix.
62 Data sources for Table 1 are:
The World Bank, n.d. GDP growth. World Development Indicators. Available at: http://data.worldbank.org/indicator/NY.GDP.MKTP.KD.ZG.
IEA, 2014. World Energy Balances 2014. International Energy Agency, Paris. Available at: http://www.iea.org/statistics/topics/energybalances/.
Global Carbon Project, 2014. Carbon Budget 2014: A Global Update of the Carbon Budget and Trends. Available at: http://www.globalcarbonproject.org/
carbonbudget/.](https://image.slidesharecdn.com/nce-2015seizing-the-global-opportunityweb-150708211503-lva1-app6891/85/Seizing-the-Global-Opportunity-Partnerships-for-Better-Growth-and-a-Better-Climate-57-320.jpg)
![58 www.newclimateeconomy.report
BP, 2014. BP Statistical Review of World Energy June 2014. London. Available at: http://www.bp.com/statisticalreview.
Where data are incomplete, NCE staff have made calculations and estimates. Growth rates are estimated by regression of log variables on a linear
time trend.
63 See: WTO, 2015. Modest trade recovery to continue in 2015 and 2016 following three years of weak expansion. World Trade Organization press
release, 14 April. Available at: https://www.wto.org/english/news_e/pres15_e/pr739_e.htm.
64 See, e.g.: Inman, P., 2015. World Bank’s Jim Kim global slowdown harm anti-poverty drive. The Guardian, 16 April. Business. Available at: http://www.
theguardian.com/business/2015/apr/16/world-banks-jim-kim-warns-global-slowdown-will-harm-anti-poverty-drive.
65 The World Bank, 2015. Poverty Overview. Available at: http://www.worldbank.org/en/topic/poverty/overview. [Last updated 6 April 2015.]
66 For a discussion of these issues, see: Gutierrez, M., McFarland, W. and Fonua, L., 2014. Zero Poverty … Think Again: Impact of Climate Change on
Development Efforts. Overseas Development Institute, London. Available at: http://www.odi.org/sites/odi.org.uk/files/odi-assets/publications-opinion-
files/8863.pdf.
See also: Granoff, I., Eis, J., Hoy, C., Watson, C., Khan, A., and Grist, N., 2014. Targeting Zero-Zero: Achieving Zero Extreme Poverty on the Path to Zero Net
Emissions. Overseas Development Institute, London. Available at: http://www.developmentprogress.org/sites/developmentprogress.org/files/case-
study-report/zero_zero_discussion_paper_full.pdf.
67 For an overview, see: UNEP, 2014. The Adaptation Gap Report 2014: A Preliminary Assessment Report. United Nations Environment Programme.
Available at: http://www.unep.org/climatechange/adaptation/gapreport2014/.
68 MarketsandMarkets, 2015. Solar Power Market by PV, CSP Technologies by Installations, Price, Cost, Trade Trends & Global Forecasts (2011-2016). Dallas, TX.
Available at: http://www.marketsandmarkets.com/PressReleases/solar-energy.asp.
69 Fay, M. Hallegatte, S., Vogt-Schlib, A., Rozenberg, J., Narloch, U. and Kerr, T., 2015. Decarbonizing Development: Three Steps to a Zero-Carbon Future. The World
Bank, Washington, DC. Available at: http://www.worldbank.org/content/dam/Worldbank/document/Climate/dd/decarbonizing-development-report.pdf.
OECD, IEA, ITF and NEA, 2015. Aligning Policies for a Low-Carbon Economy. Organisation for Economic Co-operation and Development, International
Energy Agency, Nuclear Energy Agency, and International Transport Forum, Paris. Available at: http://www.oecd.org/environment/aligning-policies-for-
a-low-carbon-economy-9789264233294-en.htm.
70 OECD, IEA, ITF and NEA, 2015. Aligning Policies for a Low-Carbon Economy.
71 ITUC, 2009. What’s Just Transition? International Trade Union Confederation, Brussels. Available at: http://www.ituc-csi.org/IMG/pdf/01-Depliant-
Transition5.pdf.
ITUC, 2015. Frontlines Briefing – Climate Justice: Unions4Climate Action. International Trade Union Confederation, Brussels. Available at: http://www.
ituc-csi.org/IMG/pdf/ituc_frontlines_climate_change_report_may_en.pdf.
72 See: The White House, 2014. Promoting Green Goods Trade to Address Climate Change. The White House Blog, 24 January. Available at: http://www.
whitehouse.gov/blog/2014/01/24/promoting-green-goods-trade-address-climate-change. See also Chapter 8 in Better Growth, Better Climate.
73 See Chapter 8 in Better Growth, Better Climate.
74 See: OECD, 2013. OECD Policy Guidance for Investment in Clean Energy Infrastructure, and OECD, 2015, Overcoming Barriers to International Investment in
Clean Energy.
75 Important questions remain to be resolved about what kinds of finance should count towards the US$100 billion commitment, particularly what can
legitimately be counted as “mobilised” by developed countries. See, e.g., Bodnar, P., Brown, J., and Nakhooda, S., 2015 (forthcoming). What Counts? Tools to
Help Define the $100 Billion Commitment. Climate Policy Initiative, Overseas Development Institute and World Resources Institute.
See also the Standing Committee on Finance, 2014. 2014 Biennial Assessment and Overview of Climate Finance Flows Report. United Nations Framework
Convention on Climate Change, Bonn. Available at: http://unfccc.int/cooperation_and_support/financial_mechanism/standing_committee/items/8034.php.
Westphal, M., Canfin, P., Ballesteros, A. and Morgan, J., 2015. Getting to $100 Billion: Climate Finance Scenarios and Projections to 2020. World Resources
Institute, Washington, DC. Available at: http://www.wri.org/publication/getting-100-billion-climate-finance-scenarios-and-projections-2020.
76 Ibid.
77 See the proposal for an “integrated roadmap to finance the low-carbon economy” set out in the report of the “Hollande Commission”: Canfin, P. and
Grandjean, A., 2015. Mobilizing Climate Finance: A Roadmap to Finance a Low-Carbon Economy. Government of France, Paris.
78 For a list of INDCs (and the full documents), see: http://www4.unfccc.int/submissions/indc/Submission%20Pages/submissions.aspx.
79 An assessment of the degree of effort of published INDCs is given at Climate Action Tracker, n.d. Tracking INDCs. Available at:
http://climateactiontracker.org/.
80 Belenky, M., n.d.. Paris Analysis: Mind the Gap. Climate Advisers. Available at: http://www.climateadvisers.com/mindthegap/ [accessed 4 June 2015]. See
also Climate Action Tracker: http://climateactiontracker.org.
2010 emissions estimate is from IPCC, 2014. Summary for Policymakers. In Climate Change 2014: Mitigation of Climate Change. Contribution of Working Group
III to the Fifth Assessment Report of the Intergovernmental Panel on Climate Change. O. Edenhofer, R. Pichs-Madruga, Y. Sokona, E. Farahani, S. Kadner, et al.
(eds.). Cambridge University Press, Cambridge, UK, and New York. Available at: https://www.ipcc.ch/report/ar5/wg3/.
81 New Climate Economy, 2015. Estimates of Emissions Reduction Potential for the 2015 Report: Technical Note. A technical note for Seizing the Global
Opportunity: Partnerships for Better Growth and a Better Climate. Available at: http://newclimateeconomy.report/misc/working-papers.](https://image.slidesharecdn.com/nce-2015seizing-the-global-opportunityweb-150708211503-lva1-app6891/85/Seizing-the-Global-Opportunity-Partnerships-for-Better-Growth-and-a-Better-Climate-58-320.jpg)
![61SEIZING THE GLOBAL OPPORTUNITY: PARTNERSHIPS FOR BETTER GROWTH AND A BETTER CLIMATE
developing world which may have less recourse to domestic resources and have more pronounced skill gaps. On creditworthiness, this is the estimate of
the assistance required per city to improve creditworthiness, not necessarily to reach creditworthiness.
114 We present only a very brief summary of the analysis here. For a detailed description, including assumptions, see Gouldson et al., 2015. Accelerating
Low-Carbon Development in the World’s Cities.
115 Based on the assumption that technical assistance for project preparation would represent 2.5-5% of total project costs after leveraged investments.
NCE estimates based on consultation with a range of city-focused institutions.
116 We assume the population growth rate to 2040 to be 0.86% per year, following the UN’s medium-variant estimate to 2050. Similarly, the urban
population is projected to grow about 1.6% per year over this period, and this can be used as a proxy for growth of the middle class to a lower bound of 3
billion. An upper bound is derived from an OECD estimate of 4.9 billion middle-class people in 2030. The central tendency of 4 billion seems reasonable,
recognising the uncertainties in predicting global household income distribution patterns 15 years in advance.
See: United Nations, 2012. World Population Prospects: The 2012 Revision. UN Department of Economic and Social Affairs, Population Division, New York.
Available at: http://esa.un.org/unpd/wpp/.
For the OECD estimate, see: Pezzini, M., 2012. An emerging middle class. OECD Yearbook 2012. Available at: http://www.oecdobserver.org/news/fullstory.
php/aid/3681/An_emerging_middle_class.html.
117 Searchinger, T., Hanson, C., Ranganathan, J., Lipinski, B., Waite, R., Winterbottom, R., Dinshaw, A. and Heimlich, R., 2013. Creating a Sustainable Food
Future: A Menu of Solutions to Sustainably Feed More than 9 Billion People by 2050. World Resources Report 2013–14: Interim Findings. World Resources
Institute, the World Bank, United Nations Environment Programme, and United Nations Development Programme, Washington, DC. Available at: http://
www.wri.org/publication/creating-sustainable-food-future-interim-findings.
Elias, P. and Boucher, D., 2014. Planting for the Future: How demand for wood products could be friendly to tropical forests. Union of Concerned Scientists,
Cambridge, MA. October. Available at: http://newgenerationplantations.org/multimedia/file/9f447ff6-5935-11e4-a16a-005056986313.
WWF, 2012. Chapter 4: Forests and Wood Products. In WWF Living Forest Report. Washington, DC. Available at: http://wwf.panda.org/about_our_earth/
deforestation/forest_publications_news_and_reports/living_forests_report/.
118 FAO, 2011. The State of the World’s Land and Water Resources for Food and Agriculture (SOLAW) – Managing Systems at Risk. Food and Agriculture
Organization of the United Nations, Rome. Available at: http://www.fao.org/nr/solaw/.
119 UNCCD, 2012. Some global facts & figures. United Nations Convention to Combat Desertification. Available at: http://www.unccd.int/en/programmes/
Event-and-campaigns/WDCD/Documents/DLDD%20Facts.pdf.
120 FAO, n.d. Land degradation assessment. Food and Agriculture Organization of the United Nations, Rome. Available at: http://www.fao.org/nr/land/
degradation/en/ [accessed 4 June 2015].
121 FAO, 2010. Global Forest Resources Assessments 2010. Food and Agriculture Organization of the United Nations, Rome. Available at: www.fao.org/
forestry/fra/en.
122 Minnemeyer, S., Laestadius, L., Sizer, N., Saint-Laurent, C. and Potapov, P., 2011. A World of Opportunity. Global Partnership on Forest Landscape
Restoration. Available at: http://www.wri.org/sites/default/files/world_of_opportunity_brochure_2011-09.pdf.
123 The Prince’s Charities International Sustainability Unit, 2015. Tropical Forests: A Review. London. Available at: http://www.pcfisu.org/wp-content/
uploads/2015/04/Princes-Charities-International-Sustainability-Unit-Tropical-Forests-A-Review.pdf.
124 FAO, n.d. Composition of agricultural area 1962–2012. FAO Stats. Food and Agriculture Organization of the United Nations, Rome. Available at:
http://faostat3.fao.org/faostat-gateway/go/to/browse/R/RL/E [accessed 14 August 2014].
125 Lawson, S., 2014. Consumer Goods and Deforestation: An Analysis of the Extent and Nature of Illegality in Forest Conversion for Agriculture and Timber
Plantations. Forest Trends, Washington, DC. Available at: http://www.forest-trends.org/documents/files/doc_4718.pdf.
126 Houghton, R. A., 2013. The emissions of carbon from deforestation and degradation in the tropics: past trends and future potential. Carbon Management,
4(5). 539–546. DOI:10.4155/cmt.13.41.
127 The per hectare estimates are from: TEEB, 2010. The Economics of Ecosystems and Biodiversity Ecological and Economic Foundations. R. Kumar, ed.
Earthscan, London and Washington. Available at: http://www.teebweb.org/publication/the-economics-of-ecosystems-and-biodiversity-teeb-ecological-
and-economic-foundations.
See also: Costanza, R., de Groot, R., Sutton, P., van der Ploeg, S., Anderson, S.J., Kubiszewski, I., Farber, S. and Turner, R.K., 2014. Changes in the global value
of ecosystem services. Global Environmental Change, 26. 152–158. DOI:10.1016/j.gloenvcha.2014.04.002.
UNEP, 2014. Building Natural Capital – How REDD+ Can Support a Green Economy. Report of the International Resource Panel. United Nations Environment
Programme, Nairobi. Available at: http://www.unep.org/resourcepanel/Publications/BuildingNaturalCapitalHowREDD/tabid/132320/Default.aspx.
128 For the full text of the New York Declaration on Forests, see: http://www.un-redd.org/portals/15/documents/ForestsDeclarationText.pdf. The New York
Declaration built on the Bonn Challenge of 2011, in which governments had pledged to put 150 million ha of forest into restoration by 2020. As of May
2015, 11 countries had made commitments covering 59.2 million ha. See: http://www.bonnchallenge.org.
Forest landscape restoration means re-growing whole forests on a large scale, but very often will involve reforesting tracts of land such as steep slopes, the
tops of hills, and river borders within a broader “mosaic landscape”, in addition to agroforestry. See: Wolosin, M., 2014. Quantifying the Benefits of the New
York Declaration on Forests. Climate Advisers. Available at: http://www.climateadvisers.com/quantifying-the-benefits-of-the-new-york-declaration-on-forests.
129 The Netherlands played a key leadership role in the development of climate-smart agriculture between 2011 and 2014.
See: https://www.wageningenur.nl/en/Dossiers/file/Dossier-Climate-Smart-Agriculture.htm.](https://image.slidesharecdn.com/nce-2015seizing-the-global-opportunityweb-150708211503-lva1-app6891/85/Seizing-the-Global-Opportunity-Partnerships-for-Better-Growth-and-a-Better-Climate-61-320.jpg)
![62 www.newclimateeconomy.report
130 See: http://www.cgiar.org and http://www.globalresearchalliance.org.
131 Ouya, D., 2014. A new alliance to spread climate smart agriculture among millions of smallholder farmers in Africa. Agroforestry World Blog, 8 December.
Available at: http://blog.worldagroforestry.org/index.php/2014/12/08/a-new-alliance-to-spread-climate-smart-agriculture-among-millions-of-
smallholder-farmers-in-africa/.
132 The global nature of supply chain commitments is critical to ensuring that forest loss and ecosystem destruction is reduced rather than simply displaced.
For example, there is evidence that traders in the EU have successfully eliminated Amazon deforestation from their soy supply in part by substituting soy
produced on newly cleared land in the neighbouring Cerrado.
See: Godar, J., Persson, U.M., Tizado, E.J. and Meyfroidt, P., 2015. Towards more accurate and policy relevant footprint analyses: Tracing fine-scale socio-
environmental impacts of production to consumption. Ecological Economics, 112, 25–35. DOI: 10.1016/j.ecolecon.2015.02.003.
133 Consumer Goods Forum, 2010. Deforestation Resolution. Approved by the Board of Directors in November 2010. Available at: http://www.
theconsumergoodsforum.com/strategic-focus/sustainability/board-resolution-on-deforestation.
134 See: http://www.tfa2020.com.
135 See: World Economic Forum, 2015. World Economic Forum to Host Tropical Forest Alliance 2020 Secretariat. Press release, 23 January.
Available at: http://www.weforum.org/news/world-economic-forum-host-tropical-forest-alliance-2020-secretariat.
136 FAO, 2011. The State of the World’s Land and Water Resources for Food and Agriculture.
A net 260 million ha of forest were eliminated in Africa, Asia, Central and South America combined between 1990 and 2012; a net 10 million ha of forest
were added in Europe and North America combined. See: http://faostat3.fao.org/download/G2/GF/E.
137 Parker, C., Cranford, M., Oakes, N. and Leggett, M. (eds.), 2012. The Little Biodiversity Finance Book. Global Canopy Programme, Oxford. Available at:
http://www.globalcanopy.org/sites/default/files/LittleBiodiversityFinanceBook_3rd%20edition.pdf. This citation gives estimates of “biodiversity finance”,
but this is taken as a good indicator of both conservation and landscape restoration finance.
138 Credit Suisse, WWF, and McKinsey & Co., 2014. Conservation Finance: Moving beyond donor funding toward an investor-driven approach. Available at:
https://www.credit-suisse.com/media/cc/docs/responsibility/conservation-finance-en.pdf.
139 Lowder, S., Carisma, B. and Skoet, J. 2012. Who Invests in Agriculture and How Much? An Empirical Review of the Relative Size of Various Investments in
Agriculture in Low- and Middle-Income Countries. ESA Working Paper No. 12-09. Food and Agriculture Organization of the United Nations, Rome. ESA
Working paper No. 12-09. Available at: http://www.fao.org/3/a-ap854e.pdf.
140 The Global Impact Investing Network (GIIN) is a non-profit organisation dedicated to increasing the effectiveness of impact investing; its website
contains useful definitions and a large amount of relevant information. See: http://www.thegiin.org/cgi-bin/iowa/aboutus/index.html.
A sense of the culture and dynamic of impact investing is also found at: Clark, C., Emerson, J. and Thornley, B., 2012. The Impact Investor: People & Practices
Delivering Exceptional Financial & Social Returns. Special Report. Insight at Pacific Community Ventures, Duke Case Center for the Advancement of Social
Entrepreneurship, and Impact Assets. San Francisco. Available at: http://www.pacificcommunityventures.org/uploads/reports-and-publications/The_Six_
Dynamics_of_Impact_Investing_October_2012_PCV_CASE_at_Duke_ImpactAssets.pdf.
141 From a limited sample of 51 private impact funds. See: NatureVest (an initiative of The Nature Conservancy) and EKO Asset Management Partners,
2014. Investing in Conservation: A landscape assessment of an emerging market. Available at: http://www.naturevesttnc.org/Reports/info.html. The NatureVest
survey was path-breaking, but by its own account skewed to investors based in North America.
142 Institutional or philanthropic investors such as those seeking to reduce poverty or mitigate GHG emissions would typically provide first-loss equity,
start-up capital and capacity-building. Impact investors would provide preferred equity, and private institutional investors more generally would provide
protected debt equity. Publicly funded institutional investors may be able to leverage private capital on a multiple of 4 to 5 for even smallholder investments
basis by accepting as low as a 20–25% first loss for being the junior equity partner in a stacked capital deal. This implies that the first 20–25% of overall
losses are absorbed by the first-loss investors, with a real chance that they will lose all their money before any of the other investors need to share in the
loss. The preferred equity investor is next in line for losses and right behind debt investors for benefits. The debt investor is paid first and is last in line to
lose its stake, but has a fixed and generally lower return.
143 UN-REDD Programme, 2010. Frequently Asked Questions and Answers – the UN-REDD Programme and REDD+. Available at: http://www.unep.org/
forests/Portals/142/docs/UN-REDD%20FAQs%20[11.10].pdf.
144 FCPF, 2015. FCPF Dashboard. Revised 30 April. Forest Carbon Partnership Facility. Available at: http://forestcarbonpartnership.org/sites/fcp/
files/2015/May/FCPF%20Readiness%20Progress__051515.pdf.
145 Höhne, N., Bals, C., Röser, F., Weischer, L., Hagemann, M., El Alaoui, A., Eckstein, D., Thomä, J. and Rossé, M., 2015. Developing Criteria to Align Investments
with 2°C Compatible Pathways. Prepared for the German Federal Environment Agency (UBA). NewClimate Institute, Germanwatch and 2° Investing Initiative.
Available at: http://newclimate.org/2015/06/09/developing-criteria-to-align-investments-with-2c-compatible-pathways/.
146 Norad, 2014. Real-Time Evaluation of Norway’s International Climate and Forest Initiative. Synthesising Report 2007–2013. Norad, Oslo. Available at:
http://www.oecd.org/derec/norway/Real-Time-Evaluation-of-Norway-International-Climate-and-Forest-Initiative-Synthesising-Report-2007-2013.pdf.
147 Liebreich, M., 2015. State of the Industry Keynote.
See also: Randall, T., 2015. Fossil Fuels Just Lost the Race Against Renewables. Bloomberg, 14 April. Available at: http://www.bloomberg.com/news/
articles/2015-04-14/fossil-fuels-just-lost-the-race-against-renewables.
148 Climate Bonds Initiative, 2014. History: Explosive growth in green bonds market. Available at: http://www.climatebonds.net/market/history.
149 IEA, 2014. World Energy Outlook 2014.](https://image.slidesharecdn.com/nce-2015seizing-the-global-opportunityweb-150708211503-lva1-app6891/85/Seizing-the-Global-Opportunity-Partnerships-for-Better-Growth-and-a-Better-Climate-62-320.jpg)
![63SEIZING THE GLOBAL OPPORTUNITY: PARTNERSHIPS FOR BETTER GROWTH AND A BETTER CLIMATE
150 IEA, n.d. Modern energy for all. Website article. International Energy Agency, Paris. Available at: http://www.worldenergyoutlook.org/resources/
energydevelopment [accessed 19 June 2015].
151 WHO, 2014. 7 million premature deaths annually linked to air pollution. 25 March. World Health Organization. Available at: http://www.who.int/
mediacentre/news/releases/2014/air-pollution/en/.
152 See, e.g., Klevnäs, P., Stern, N. and Frejova, J., 2015. Oil Prices and the New Climate Economy. New Climate Economy briefing paper. Global Commission on
the Economy and Climate and Stockholm Environment Institute, Stockholm. Available at: http://newclimateeconomy.report/misc/working-papers/.
153 IEA, 2014. World Energy Outlook 2014. See also Chapter 4 of Better Growth, Better Climate.
154 IEA, 2014. World Energy Investment Outlook 2014.
155 Ibid. Investment targets for 2030 were estimated based on current investment levels and IEA’s estimate of total investment needs over the period
2014–2035.
156 The IEA uses a slightly different definition of clean energy investment, including transport energy efficiency and biofuels. With this definition, clean
energy investments in the IEA’s 450 Scenario are US$0.9 trillion in 2020 and US$1.8 trillion in 2030. See: IEA, 2014. World Energy Outlook 2014 (p.93).
157 See: IRENA, 2015. Renewable Power Generation Costs in 2014. International Renewable Energy Agency, Abu Dhabi. Available at: http://www.irena.org/
menu/index.aspx?mnu=Subcat&PriMenuID=36&CatID=141&SubcatID=494.
For a detailed discussion, see also Klevnäs et al., 2015. Oil Prices and the New Climate Economy, and Chapter 4 of Better Growth, Better Climate.
158 McCrone et al., 2015. Global Trends in Renewable Energy Investment 2015.
159 Smith, N., 2015. Clean Energy Revolution is Ahead of Schedule. Bloomberg View, 8 April. Available at: http://www.bloombergview.com/
articles/2015-04-08/clean-energy-revolution-is-way-ahead-of-schedule.
160 Alliance for Rural Electrification, 2013. Using Batteries to Ensure Clean, Reliable and Affordable Universal Electricity Access: A Guide for Energy Decision-makers.
Available at: http://www.ruralelec.org/fileadmin/DATA/Documents/06_Publications/Position_papers/2013-06-11_ARE_Energy_Storage_Position_
Paper_2013_FINAL.pdf.
161 Natural gas can provide substantial air quality and GHG benefits when replacing coal in the power sector, but is still a fossil fuel with significant risk of
locking in long-term carbon emissions. For a detailed discussion, see: Lazarus, M., Tempest, K., Klevnäs, P. and Korsbakken, J. I., 2015. Natural Gas: Guardrails
for a Potential Climate Bridge. New Climate Economy contributing paper. Stockholm Environment Institute, Stockholm and Seattle, WA, US. Available at:
http://newclimateeconomy.report/misc/working-papers/.
162 McCrone et al., 2015. Global Trends in Renewable Energy Investment 2015.
163 For examples of supportive measures in the domestic arena, see: OECD, 2015. Policy Guidance for Investment in Clean Energy Infrastructure: Expanding
Access to Clean Energy for Green Growth and Development. Organisation for Economic Co-operation and Development, Paris. Available at: http://dx.doi.
org/10.1787/9789264212664-en.
OECD, 2015. Overcoming Barriers to International Investment in Clean Energy, Green Finance and Investment. Organisation for Economic Co-operation and
Development, Paris. Available at: http://dx.doi.org/10.1787/9789264227064-en.
164 Nelson, D., 2014. Roadmap to a Low Carbon Electricity System in the U.S. and Europe. Climate Policy Initiative, London.
Available at: http://climatepolicyinitiative.org/publication/roadmap-to-a-low-carbon-electricity-system-in-the-u-s-and-europe/.
165 See Chapter 6 in Better Growth, Better Climate.
166 YieldCos are publicly traded companies paying dividends to shareholders from portfolios of owned renewable energy projects. For a detailed discussions,
see Nelson, D., 2014. Roadmap to a Low Carbon Electricity System in the U.S. and Europe.
167 Climate Bonds Initiative, 2014. History: Exploding Growth in Green Bonds Market. Available at: http://www.climatebonds.net/market/history.
Berger, L., 2014. What You Need to Know About How Clean Energy YieldCos Work. Greentech Media, 10 July. Available at: http://www.greentechmedia.
com/articles/read/what-you-need-to-know-about-how-yieldcos-for-clean-energy-work.
168 See IMF, 2015. From Billions to Trillions: Mobilising Development Finance. International Monetary Fund. Press release, April 2015. Available at: http://
www.imf.org/external/np/sec/pr/2015/pr15170.htm
See also World Bank. Financing the post-2015 Development Agenda. April 2015. Available at: http://www.worldbank.org/mdgs/post2015.html
169 Buchner, B., Stadelmann, M., Wilkinson, J., Mazza, F., Rosenberg, A. and Abramskiehn, D., 2014. The Global Landscape of Climate Finance 2014. Climate
Policy Initiative. Available at: http://climatepolicyinitiative.org/publication/global-landscape-of-climate-finance-2012/. Note that this total includes funding for
adaptation, transport, and other climate-related investments not within the scope of this section.
170 AfDB, ADB, EBRD, EIB, IDB, IFC and World Bank, 2014. Joint Report on MDB Climate Finance 2013. African Development Bank, Asian Development
Bank, European Bank for Reconstruction and Development, European Investment Bank, Inter-American Development Bank, International Finance
Corporation and World Bank Group. http://www.afdb.org/fileadmin/uploads/afdb/Documents/Publications/Joint_Report_on_MDB_Climate_
Finance_2013_-_16_09_2014.pdf.
171 BNEF, 2013. Development Banks: Breaking the US$100 billion a year barrier. Bloomberg New Energy Finance, New York. Available at: http://about.bnef.
com/white-papers/development-banks-breaking-the-100bn-a-year-barrier/.
172 Morris, S. and Gleave, M., 2015. The World Bank at 75. CGD Policy Paper 058. Center for Global Development, Washington, DC. Available at: http://www.
cgdev.org/publication/world-bank-75.](https://image.slidesharecdn.com/nce-2015seizing-the-global-opportunityweb-150708211503-lva1-app6891/85/Seizing-the-Global-Opportunity-Partnerships-for-Better-Growth-and-a-Better-Climate-63-320.jpg)
![64 www.newclimateeconomy.report
173 For an estimate of global infrastructure investment needs, see McKinsey Global Institute, 2013. Infrastructure Productivity: How to Save $1 Trillion a Year.
McKinsey & Company. Available at: file:///C:/Users/Michael/Downloads/MGI_Infrastructure_Full_report_Jan2013.pdf
174 Humphrey, C., 2015 (forthcoming). Challenges and Opportunities for Multilateral Development Banks in 21st Century Infrastructure Finance. Global Green
Growth Institute and G24 special paper series on infrastructure finance and development.
175 IDFC, 2015. Development Banks Adopt Common Standards to Move Climate Finance Forward. Press release, 31 March. International Development
Finance Club, Paris. Available at: https://www.idfc.org/Downloads/Press/02_general/Press_Release_Conclusion_IDFC%20Climate_EN.pdf.
176 See: http://climatefinancelab.org.
177 Varadarajan, U., Nelson, D., Pierpont, B. and Hervé-Mignucci, M., 2011. The Impacts of Policy on the Financing of Renewable Projects: A Case Study Analysis.
Climate Policy Initiative, San Francisco, CA, US. Available at: http://climatepolicyinitiative.org/publication/the-impacts-of-policy-on-the-financing-of-
renewable-projects-a-case-study-analysis/.
See also UNDP, 2015. Derisking Renewable Energy Investment. United Nations Development Programme. Available at: http://www.undp.org/drei.
178 Hogarth, J.R. and Granoff, I., 2015. Speaking Truth to Power: Why Energy Distribution, More than Generation, is Africa’s Poverty Reduction Challenge, Overseas
Development Institute, London. Available at: http://www.odi.org/publications/9406-truth-power-energy-poverty-ambition-Africa.
179 See: UNEP, 2015. Increasing Private Capital Investment into Energy Access: The Case for Mini-Grid Pooling Facilities. United Nations Development
Programme, Nairobi. Available at: http://apps.unep.org/publications/index.php?option=com_pub&task=download&file=011541_en.
180 Africa Progress Panel, 2015. Power, People, Planet.
181 Energy consumption growth estimates vary between 49% to 2011 or 54% to 2012, depending on methodology and data sources. See BP, 2013. BP
Statistical Review of World Energy June 2013. London. Available at: http://www.bp.com/statisticalreview.
See also: IEA, 2013. World Energy Outlook 2013. International Energy Agency, Paris. Available at: http://www.worldenergyoutlook.org/publications/
weo-2013/.
World GDP in 2012 was US$73.3 trillion, up from US$36.3 trillion in 1990, in constant 2005 international dollars, purchasing power parity (PPP). See:
The World Bank, 2014. World Development Indicators 2014. 11 April 2014 release. (An updated release, not including constant 2005 international $ PPP
figures, is available at http://data.worldbank.org/data-catalog/world-development-indicators.)
182 See, e.g., IEA, 2014. Energy Efficiency Market Report 2014 – Market Trends and Medium-Term Prospects. International Energy Agency, Paris. Available at:
http://www.iea.org/bookshop/463-Energy_Efficiency_Market_Report_2014.
183 Copenhagen Centre on Energy Efficiency, n.d. Resources. Available at: http://www.energyefficiencycentre.org/Resources. [accessed 5 June 2015].
184 G20, 2014. G20 Energy Efficiency Action Plan: Voluntary Collaboration on Energy Efficiency. Available at: https://g20.org/wp-content/uploads/2014/12/
g20_energy_efficiency_action_plan.pdf.
185 Analysis based on data from: OICA, n.d. Production Statistics. Organisation Internationale des Constructeurs d’Automobiles. Available at: http://www.
oica.net/category/production-statistics/ [accessed 22 May 2015].
186 IEA, 2014. Capturing the Multiple Benefits of Energy Efficiency. International Energy Agency, Paris. Available at: http://www.iea.org/bookshop/475-
Capturing_the_Multiple_Benefits_of_Energy_Efficiency. The figures here are based on a net present value calculation.
187 Ibid.
188 IEA, 2013. Energy Efficiency Market Report 2013 – Market Trends and Medium-Term Prospects. International Energy Agency, Paris. Available at: https://
www.iea.org/publications/freepublications/publication/energy-efficiency-market-report-2013.html.
189 Klevnäs et al., 2015. Oil Prices and the New Climate Economy.
190 IEA, 2014. World Energy Outlook 2014.
191 IEA, 2015. Energy Technology Perspectives 2015.
192 Ibid.
193 IEA, 2014. Capturing the Multiple Benefits of Energy Efficiency.
194 IEA, 2011. 25 Energy Efficiency Policy Recommendations – 2011 Update. International Energy Agency, Paris. Available at: https://www.iea.org/
publications/freepublications/publication/25-energy-efficiency-policy-recommendations---2011-update.html.
195 A global assessment of energy productivity found the top-performing countries were Hong Kong, Colombia and Singapore. See: Ecofys, 2015. The 2015
Energy Productivity and Economic Prosperity Index. How Efficiency Will Drive Growth, Create Jobs and Spread Wellbeing Throughout Society. Available at: http://
www.ecofys.com/files/files/the-2015-energy-productivity-and-economic-prosperity-index.pdf.
196 There is a particularly strong case for convergence around testing and measurement standards, in order to minimise the regulatory burden on
businesses in meeting differing requirements in different jurisdictions.
197 See: https://www.energystar.gov.
198 Kimuna, O., 2009. Japanese Top Runner Approach for Energy Efficiency Standards, SERC Discussion Paper 09035. Available at: http://criepi.denken.or.jp/jp/
serc/discussion/09035.html.
199 The World Bank, 2011. Energy Efficiency: Lessons Learned from Success Stories. Washington, DC. Available at: https://openknowledge.worldbank.org/
handle/10986/12236.](https://image.slidesharecdn.com/nce-2015seizing-the-global-opportunityweb-150708211503-lva1-app6891/85/Seizing-the-Global-Opportunity-Partnerships-for-Better-Growth-and-a-Better-Climate-64-320.jpg)
![65SEIZING THE GLOBAL OPPORTUNITY: PARTNERSHIPS FOR BETTER GROWTH AND A BETTER CLIMATE
200 This excludes standards in electricity production where further savings are possible. For example, the UK has implemented standards on electricity
production to improve efficiency.
201 There are no carbon pricing schemes in place with rules that automatically increase the carbon price over time.
202 To be fully effective, a carbon price needs to be part of a well-aligned and integrated package of policies for market failures that hold back low-carbon
investment and change.
See: OECD, 2015. Aligning Policies for a Low-Carbon Economy. Produced in cooperation with the International Energy Agency, International
Transport Forum, and Nuclear Energy Agency. Organisation for Economic Co-operation and Development, Paris. Available at: http://dx.doi.
org/10.1787/9789264233294-en.
See also Chapter 5 in Better Growth, Better Climate.
203 The World Bank, 2015. Carbon Pricing Watch 2015: An advance brief from the State and Trends of Carbon Pricing 2015 report, to be released late 2015.
Washington, DC. Available at: http://documents.worldbank.org/curated/en/2015/05/24528977/carbon-pricing-watch-2015-advance-brief-state-trends-
carbon-pricing-2015-report-released-late-2015.
204 For a survey and analysis of the structure and level of energy taxes in OECD and selected other countries, see: OECD, 2015. Taxing Energy
Use 2015: OECD and Selected Partner Economies. Organisation for Economic Co-operation and Development. Available at: http://dx.doi.
org/10.1787/9789264232334-en.
205 For example, see the 29 May 2015 letter to the United Nations Framework Convention on Climate Change (UNFCCC) Secretariat and the COP21
Presidency: http://s08.static-shell.com/content/dam/shell-new/local/corporate/corporate/downloads/pdf/media/speeches/2015/letter-to-unfccc.pdf.
206 Support for carbon pricing is being expressed publicly in a variety of ways. Ahead of the UN Climate Summit in September 2014, 73 countries, 22
sub-national jurisdictions and more than 1,000 companies and investors expressed their support for a price on carbon. See: The World Bank, 2014.
73 Countries and Over 1,000 Businesses Speak Out in Support of a Price on Carbon. 22 September. Available at: http://www.worldbank.org/en/news/
feature/2014/09/22/governments-businesses-support-carbon-pricing.
In addition, more than 360 investors, representing over US$24 trillion in assets, called on governments to commit to “provide stable, reliable and
economically meaningful carbon pricing that helps redirect investment commensurate with the scale of the climate change challenge”. See: Global Investor
Statement on Climate Change, 2014. Available at: http://investorsonclimatechange.org/.
207 Business & Climate Summit 2015. Business & Climate Summit conclusions: towards a low-carbon society. Press release, 21 May. Paris. Available at:
http://www.businessclimatesummit.com/press-room/
208 CDP, 2014. Global Corporate Use of Carbon Pricing: Disclosures to Investors. New York. Available at: https://www.cdp.net/CDPResults/global-price-on-
carbon-report-2014.pdf.
209 Ibid.
210 See Part II, Enabling a low-carbon transition: prices and more, in: Fay, M., Hallegatte, S., Vogt-Schilb, A., Rozenberg, J., Narloch, U., and Kerr, T., 2015.
Decarbonizing Development: Three Steps to a Zero-Carbon Future. The World Bank, Washington, DC. Available at: http://hdl.handle.net/10986/21842.
211 European Commission, n.d. Auctioning. Available at: http://ec.europa.eu/clima/policies/ets/cap/auctioning/index_en.htm [accessed 15 June 2015].
212 The World Bank, 2015. Carbon Pricing Watch 2015.
213 Fairfield, N., 2014. Best of Both Worlds? Northeast Cut Emissions and Enjoyed Growth. The New York Times. 6 June. Available at: http://www.nytimes.
com/2014/06/06/upshot/best-of-both-worlds-northeast-cut-emissions-and-enjoyed-growth.html.
214 Elgie, S. and McClay, J., 2013. BC’s carbon tax shift is working well after four years. Canadian Public Policy, 39 (Supplement 2). 1–10. DOI:10.3138/
CPP.39.Supplement2.S1.
215 IEA, 2014, World Energy Outlook 2014.
216 This is the estimated range for 2005–2011. See: OECD, 2013. Inventory of Estimated Budgetary Support and Tax Expenditures for Fossil Fuels 2013.
Organisation for Economic Co-operation and Development, Paris. Available at: http://dx.doi.org/10.1787/9789264187610-en.
217 Clements, B.J., Coady, D., Fabrizio, S., Gupta, S., and Serge, T., 2013. Energy Subsidy Reform: Lessons and Implications. International Monetary Fund,
Washington, DC. Available at: http://www.elibrary.imf.org/page/energysubsidylessons.
218 The World Bank, 2014. Transitional Policies to Assist the Poor While Phasing Out Inefficient Fossil Fuel Subsidies that Encourage Wasteful Consumption.
Contribution by the World Bank to G20 Finance Ministers and Central Bank Governors, September. Available at: http://www.oecd.org/site/tadffss/
reports-to-g20-fossil-fuel-subsidies.htm.
219 Lower oil prices have led to stronger calls from industry to increase fossil fuel production subsidies, e.g. in the UK.
220 Klevnäs et al., 2015. Oil Prices and the New Climate Economy.
221 See: G20, 2013. G20 Leaders’ Declaration. St. Petersburg, Russia, September. Available at: https://g20.org/wp-content/uploads/2014/12/Saint_
Petersburg_Declaration_ENG_0.pdf.
See also: G20, 2014. G20 Leaders’ Communiqué. Brisbane, Australia, 15–16 November. Available at: https://g20.org/wp-content/uploads/2014/12/
brisbane_g20_leaders_summit_communique.pdf.
222 See: http://www.carbonpricingleadership.org.
223 See: http://www.thepmr.org/content/supporting-action-climate-change-mitigation [accessed 15 June 2015].](https://image.slidesharecdn.com/nce-2015seizing-the-global-opportunityweb-150708211503-lva1-app6891/85/Seizing-the-Global-Opportunity-Partnerships-for-Better-Growth-and-a-Better-Climate-65-320.jpg)
![68 www.newclimateeconomy.report
275 EEA, 2014. Annual European Union Greenhouse Gas Inventory 1990–2012 and Inventory Report 2014. European Environment Agency, Copenhagen.
Available at: http://www.eea.europa.eu//publications/european-union-greenhouse-gas-inventory-2014. See Table ES.3, which shows France’s emissions in
2012 were 490.1 Mt CO2
e, and the Netherlands’ were 191.7 Mt CO2
e.
276 Ceres, 2014. Power Forward 2.0: How American Companies Are Setting Clean Energy Targets and Capturing Greater Business Value. Available at: http://www.
ceres.org/resources/reports/power-forward-2.0-how-american-companies-are-setting-clean-energy-targets-and-capturing-greater-business-value/view.
277 For example, the average IRR for low-carbon energy installations was 6% in the EU, where it was the most common project type, 12% in the US, 10%
in South Africa, and 20% in India. Measures to improve energy efficiency in industrial processes, meanwhile, had an average IRR of 19% in the EU, 81% in
the US, 46% in South Africa, and 7% in India. Energy efficiency in buildings had negative returns in the EU and South Africa, -21% and -7%, respectively, but
positive returns in the US and India, averaging 13%.
See: We Mean Business, 2014. The Climate Has Changed: Why Bold, Low Carbon Action Makes Good Business Sense. Report prepared by CDP. Available at:
https://www.cdp.net/Documents/we-mean-business-the-climate-has-changed.pdf.
278 Ambec, S. and Lanoie, P., 2008. Does It Pay to Be Green? A Systematic Overview. The Academy of Management Perspectives, 22(4). 45–62.
DOI:10.5465/AMP.2008.35590353.
Khan, M., Srafeim, G. and Yoon, A., 2015. Corporate Sustainability: First Evidence on Materiality. HBS Working Paper 15-073. Harvard Business School,
Cambridge, MA, US. Available at: http://hbswk.hbs.edu/item/7755.html.
279 CDP, 2014. The A List: The CDP Climate Leadership Performance Index 2014. Available at: https://www.cdp.net/CDPResults/CDP-climate-performance-
leadership-index-2014.pdf. Note that comparing the CDP index against a mainstream index entails differences in index size, sector weighting and regional
allocation. This comparison has not been risk-weighted to capture these factors.
280 CDP, 2014. The A List (see p.14). The CDP Climate Leadership Index includes 187 major companies from around the world in 12 different sectors
taking the strongest action on climate change.
281 Global Investor Coalition on Climate Change, 2013. Global Investor Survey on Climate Change: 3rd annual report on actions and progress. Available at:
http://www.ceres.org/resources/reports/global-investor-survey-on-climate-change-2013/view.
282 CDP, 2015 (forthcoming). CDP Policy Briefing: Corporate Ambition and Action on Climate Change.
283 BP, 2015. Shareholder resolution. Available at: http://www.bp.com/en/global/corporate/investors/annual-general-meeting/notice-of-meeting/
shareholder-resolution.html [accessed 23 April 2015].
284 Carbon Trust, 2015. Titans or Titanics? Understanding the business response to climate change and resource scarcity. Carbon Trust. London. Available
at: http://www.carbontrust.com/resources/reports/advice/titans-or-titanics.
285 Only 70% of the companies reporting to CDP’s climate change program in 2014 had set either an intensity or an absolute target with almost 400
companies setting both. The CDP sample of 2,345 responding companies, including 83% of the Global 500. See: CDP, 2015 (forthcoming). CDP Policy
Briefing: Corporate Ambition and Action on Climate Change.
286 We Mean Business, 2014. The Climate Has Changed.
287 A recent analysis, based on data disclosed to CDP, notes that “No fewer than 81% of the world’s 500 largest companies reported in 2014 as having
emission reduction or energy-specific targets”, but “most of those targets are not of a magnitude to meet the threat posed by climate change. Either they do
not cover a meaningful percentage of the organization’s emissions, or they are insufficiently long-term, or they are simply not ambitious enough.”
See: CDP, 2015. Mind the Science. Report for the We Mean Business coalition, with contributions from WWF, the UN Global Compact and the World
Resources Institute. Paris. See figure on p.7 for a detailed breakdown. Available at: https://www.cdp.net/Documents/technical/2015/mind-the-science-
report-2015.pdf.
288 See: http://www.ghgprotocol.org.
289 CDP, World Resources Institute and WWF, 2015. Sectoral Decarbonization Approach (SDA): A Method for Setting Corporate Emission Reduction Targets in
Line with Climate Science. Version 1, May 2015. A product of the Science Based Targets Initiative. Available at: http://sciencebasedtargets.org/wp-content/
uploads/2015/05/Sectoral-Decarbonization-Approach-Report.pdf.
See also the Science Based Targets Initiative website: http://sciencebasedtargets.org.
290 See: http://there100.org.
291 Clark, G.L., Feiner, A. and Viehs, M., 2014. From the Stockholder to the Stakeholder: How Sustainability Can Drive Financial Outperformance. University
of Oxford, Arabesque Partners. Available at: http://www.smithschool.ox.ac.uk/library/reports/SSEE_Arabesque_Paper_16Sept14.pdf
See also the UN Environment Programme Finance Initiative: http://www.unepfi.org and the Global Sustainable Investment Alliance: http://www.gsi-
alliance.org.
292 See: http://montrealpledge.org.
293 See: http://unepfi.org/pdc/.
294 See: http://lctpi.wbcsdservers.org.
295 See: http://www.tfa2020.com.
296 See: http://www.cisl.cam.ac.uk/business-action/sustainable-finance/banking-environment-initiative/programme/soft-commodities/soft-commodities.](https://image.slidesharecdn.com/nce-2015seizing-the-global-opportunityweb-150708211503-lva1-app6891/85/Seizing-the-Global-Opportunity-Partnerships-for-Better-Growth-and-a-Better-Climate-68-320.jpg)
![69SEIZING THE GLOBAL OPPORTUNITY: PARTNERSHIPS FOR BETTER GROWTH AND A BETTER CLIMATE
297 Climate-related initiatives in the oil and gas sector include:
The Climate Clean Air Coalition Oil & Gas Initiative: http://www.unep.org/ccac/Initiatives/CCACOilGasInitiative/tabid/794015/Default.aspx.
The Oil and Gas Climate Initiative: http://www.un.org/climatechange/summit/wp-content/uploads/sites/2/2014/07/INDUSTRY-oil-and-gas-climate-
initiative_REV.pdf; see also this May 2015 press release: http://www.eni.com/en_IT/media/press-releases/2015/05/OGCI_tackles_improved_emissions_
management_and_transition_to_lower_carbon_energy.shtml.
The World Bank Zero Flaring by 2030: http://www.worldbank.org/en/programs/zero-routine-flaring-by-2030.
298 See: http://www.fclt.org.
299 See: http://www.climatebonds.net.
300 See: http://www.wemeanbusinesscoalition.org. One of the coalition’s activities is to press for businesses to lobby governments in a transparent and
accountable manner. See: http://www.wemeanbusinesscoalition.org/content/responsible-corporate-engagement-climate-policy.
See also: Metzger, E., Dagnet, Y., Putt del Pino, S., Morgan, J., Karbassi, L., Huusko, H., Castellanos Silveira, F., et al., 2013. Guide for Responsible Corporate
Engagement in Climate Policy. A Caring for Climate Report UN Global Compact, United Nations Framework Convention on Climate Change, United Nations
Environment Programme, World Resources Institute, CDP, WWF, Ceres and The Climate Group. Available at: http://www.wri.org/publication/guide-
responsible-corporate-engagement-climate-policy.
301 UN Climate Summit, 2014. Economic Drivers: Global Investors Action Statement. New York. 23 September. Available at: http://www.un.org/
climatechange/summit/wp-content/uploads/sites/2/2014/09/FINANCING-Global-Investors.pdf.
302 Aviation accounts for approximately 2% of global CO2
emissions from fossil fuel use. See: ICAO, 2013. ICAO Environmental Report 2013: Aviation and
Climate Change. International Civil Aviation Organization, Montreal. Available at: http://cfapp.icao.int/Environmental-Report-2013/
Shipping accounts for approximately 3% of global CO2
emissions from fossil fuel use. See: IMO, 2014. Third IMO GHG Study 2014. International
Maritime Organization, London. Available at: http://www.imo.org/OurWork/Environment/PollutionPrevention/AirPollution/Pages/Greenhouse-Gas-
Studies-2014.aspx.
The IPCC and IEA report slightly different percentages. See: IEA, 2014. CO2
Emissions from Fuel Combustion: Highlights 2014. International Energy Agency,
Paris. Available at: https://www.iea.org/publications/freepublications/publication/co2-emissions-from-fuel-combustion-highlights-2014.html.
Also: Sims, R., Schaeffer, R., Creutzig, F., Cruz-Núñez, X., D’Agosto, M., et al., 2014. Chapter 8: Transport. In Climate Change 2014: Mitigation of Climate
Change. Contribution of Working Group III to the Fifth Assessment Report of the Intergovernmental Panel on Climate Change. O. Edenhofer, R. Pichs-Madruga, Y.
Sokona, E. Farahani, S. Kadner, et al. (eds.). Cambridge University Press, Cambridge, UK, and New York. Available at: https://www.ipcc.ch/report/ar5/wg3/.
One reason why the IPCC estimates differ is that the IPCC includes forestry and land use in its total GHG emissions figure, while the IMO and ICAO do
not. The IEA figures only account for international activity, not domestic, and thus are lower than total global emissions from these two sectors. The IMO
analysis combines IEA data on fuel use with separate, bottom-up data to arrive at its figures.
For the forward-looking estimate, see: UNEP, 2011. Bridging the Emissions Gap: A UNEP Synthesis Report. United Nations Environment Programme, Nairobi.
Available at: http://www.unep.org/pdf/UNEP_bridging_gap.pdf. The 10-32% range depends on the emission reductions achieved elsewhere, as well as the
growth in emissions from international aviation and shipping.
303 The share of international activity was 65% in aviation in 2010, and 84% in shipping in 2012. See: ICAO, 2013. ICAO Environmental Report 2013, and
IMO, 2014. Third IMO GHG Study 2014.
304 ICCT, 2011. Reducing Greenhouse Gas Emissions from Ships. White Paper Number 11. International Council on Clean Transportation. Available at:
http://www.theicct.org/reducing-ghg-emissions-ships.
305 ATAG, 2014. Aviation: Benefits Beyond Borders. Air Transport Action Group, Geneva. Available at: http://aviationbenefits.org/media/26786/ATAG__
AviationBenefits2014_FULL_LowRes.pdf. (Data attributed to Oxford Economics.)
306 IATA, 2015. Fact Sheet: Industry Statistics. Updated June 2015. International Air Transport Association, Montreal. Available at: http://www.iata.org/
pressroom/facts_figures/fact_sheets/Documents/fact-sheet-industry-facts.pdf.
307 ATAG, 2014. Aviation: Benefits Beyond Borders.
308 IPCC, 2014. Kahn Ribeiro, S., S. Kobayashi, M. Beuthe, J. Gasca, D. Greene, D. S. Lee, Y. Muromachi, P. J. Newton, S. Plotkin, D. Sperling, R. Wit, P. J.
Zhou, 2007: Transport and its infrastructure. In Climate Change 2007: Mitigation. Contribution of Working Group III to the Fourth Assessment Report of
the Intergovernmental Panel on Climate Change [B. Metz, O.R. Davidson, P.R. Bosch, R. Dave, L.A. Meyer (eds)], Cambridge University Press, Cambridge,
United Kingdom and New York, NY, USA. Available at: http://www.ipcc.ch/pdf/assessment-report/ar4/wg3/ar4-wg3-chapter5.pdf
ICAO, 2013. ICAO Environmental Report 2013.
Moreover, when its non-CO2
impacts are factored-in, it contributes 4.9% of the Earth’s warming effect. Source: WWF and Vivid Economics, 2012. Aviation
Report: Market Based Mechanisms to Curb Greenhouse Gas Emissions from International Aviation. Available at: http://awsassets.panda.org/downloads/aviation_
main_report_web_simple.pdf.
309 ICAO, 2013. ICAO Environmental Report 2013.
310 Ibid.
311 Jardine, C.N., 2013. A Methodology for Offsetting Aviation Emissions. The Environmental Change Institute, University of Oxford. Available at:
http://www.eci.ox.ac.uk/research/energy/downloads/aviation-climatecare.pdf.](https://image.slidesharecdn.com/nce-2015seizing-the-global-opportunityweb-150708211503-lva1-app6891/85/Seizing-the-Global-Opportunity-Partnerships-for-Better-Growth-and-a-Better-Climate-69-320.jpg)
![70 www.newclimateeconomy.report
312 European Commission, 2013. Evaluation of Directive 2009/12/EC on airport charges. Final Report. Available at: http://ec.europa.eu/transport/modes/air/
studies/doc/airports/2013-09-evaluation-of-directive-2009-12-ec-on-airport-charges.pdf.
See also: IETA and EDF, 2013. Norway, The World’s Carbon Markets: A Case Study Guide to Emissions Trading. Updated May 2013. International Emissions
Trading Association and Environmental Defense Fund. Available at: http://www.ieta.org/assets/Reports/EmissionsTradingAroundTheWorld/edf_ieta_
norway_case_study_may_2013.pdf.
Keen, M., Parry, I. and Strand, J., 2013. Planes, Ships, and Taxes: Charging for International Aviation and Maritime Emissions. Economic Policy, 28(76). 701-
749. DOI: 10.1111/1468-0327.12019.
313 US EPA, 2015. Proposed Finding that Greenhouse Gas Emissions from Aircraft Cause or Contribute to Air Pollution that May Reasonably Be Anticipated
to Endanger Public Health and Welfare and Advance Notice of Proposed Rulemaking. EPA-HQ-OAR-2014-0828. US Environmental Protection Agency,
Washington, DC. Available at: http://www.epa.gov/otaq/documents/aviation/aircraft-ghg-pr-anprm-2015-06-10.pdf.
314 European Union, 2009. Directive 2008/101/EC of the European Parliament and of the Council. Official Journal of the European Union. Available at:
http://eur-lex.europa.eu/legal-content/EN/TXT/PDF/?uri=CELEX:32008L0101&from=EN.
315 Keen, M., Parry, I. and Strand, J., 2013. Planes, Ships, and Taxes: Charging for International Aviation and Maritime Emissions. Economic Policy, 28(76).
701-749. Available at: http://dx.doi.org/10.1111/1468-0327.12019.
316 Fuel costs’ share in 2014 and 2015 is projected to be lower, 26–28%, due to lower oil prices. See: IATA, 2014. Fuel Fact Sheet, last updated December
2014. Available at: http://www.iata.org/pressroom/facts_figures/fact_sheets/documents/fuel-fact-sheet.pdf.
317 ICCT, 2014. U.S. Domestic Airline Fuel Efficiency Ranking, 2013. White paper. International Council on Clean Transportation, Washington, DC. Available
at: http://www.theicct.org/sites/default/files/publications/ICCT_USairline-ranking_2013.pdf.
318 Karp, G., 2014. Winglets go a long way to give airlines fuel savings. Chicago Tribune. 4 March. Available at: http://articles.chicagotribune.com/2014-03-
04/business/ct-airline-winglets-0302-biz-20140304_1_fuel-savings-jet-fuel-southwest-airlines.
319 European Federation for Transport and Environment, 2010. Grounded: How ICAO Failed to Tackle Aviation and Climate Change and What Should Happen
Now. Available at: http://www.transportenvironment.org/sites/te/files/media/2010_09_icao_grounded.pdf.
The report states: “According to the provisions of Article 2.2 [of the Kyoto Protocol]: ‘Parties included in Annex I shall pursue limitation or reduction of
emissions of greenhouse gases...from aviation and marine bunker fuels, working through the International Civil Aviation Organization and the International Maritime
Organization, respectively’. Unlike other sectors, responsibility for cutting international aviation emissions was not given to individual countries (parties).
Instead reductions should be achieved by Annex 1 Parties working through international bodies that regulate these modes of transport – ICAO for aviation
and IMO for maritime transport.”
320 European Federation for Transport and Environment, 2010. Grounded.
Bows-Larkin, A., 2014. All adrift: aviation, shipping, and climate change policy. Climate Policy, online 6 December. DOI: 10.1080/14693062.2014.965125.
This analysis treats international aviation as an average country to create an emissions pathway that would meet 2°C, then compares it to projected
emissions from international aviation.
321 UN Climate Summit, 2014. Transport Aviation Action Plan. Available at: http://www.un.org/climatechange/summit/wp-content/uploads/
sites/2/2014/09/TRANSPORT-Aviation-Action-plan.pdf.
322 ICCT, 2014. Could ICAO’s CO2
Standard Not Actually Cover Any Aircraft? Yes, If Nobody’s Watching. Blog post, 9 December. International Council on
Clean Transportation, Available at: http://www.theicct.org/blogs/staff/could-icaos-co2-standard-not-cover-any-aircraft.
323 ICAO, 2013. 38th ICAO Assembly meeting press release.
324 ICAO, 2013. Report on the Assessment of Market-based Measures, 2013. Available at: http://www.icao.int/Meetings/GLADs-2015/Documents/10018_
cons_en.pdf (p.2-1).
325 Hemmings, B., 2013. Global deal or no deal? Your free guide to the ICAO Assembly, Transport and Environment, Available at: http://www.
transportenvironment.org/publications/global-deal-or-no-deal-your-free-guide-icao-assembly.
326 ICAO, 2013. ICAO Environmental Report 2013.
327 ICAO, 2013. Report of the Assessment of Market-based Measures. International Civil Aviation Organization, Montreal. Available at: http://www.icao.int/
Meetings/GLADs-2015/Documents/10018_cons_en.pdf.
328 ICAO, 2013. Report of the Assessment of Market-based Measures.
WWF and Vivid Economics, 2012. Aviation Report: Market Based Mechanisms to Curb Greenhouse Gas Emissions from International Aviation. Available at:
http://www.vivideconomics.com/publications/aviation-report-market-based-mechanisms-to-curb-greenhouse-gas-emissions-from-international-aviation.
329 ICAO, 2013. Report of the Assessment of Market-based Measures.
330 Ibid.
331 ICS, n.d. Key Facts. International Chamber of Shipping. Available at: http://www.ics-shipping.org/shipping-facts/key-facts [accessed 5 May 2015].
332 UNCTAD, 2014. Review of Maritime Transport 2014. United Nations Conference on Trade and Development, Geneva. Available at: http://unctad.org/en/
PublicationsLibrary/rmt2014_en.pdf.
333 For the 2012 figures, see: IMO, 2014. Third IMO GHG Study 2014.
For the 1996 figures, see: IMO, 2000. Study of Greenhouse Gas Emissions from Ships. Issue 2. March. International Maritime Organization, London. Available
at: http://cleantech.cnss.no/wp-content/uploads/2011/05/2000-IMO-Study-of-Greenhouse-Gas-Emissions-from-Ships.pdf.](https://image.slidesharecdn.com/nce-2015seizing-the-global-opportunityweb-150708211503-lva1-app6891/85/Seizing-the-Global-Opportunity-Partnerships-for-Better-Growth-and-a-Better-Climate-70-320.jpg)
![71SEIZING THE GLOBAL OPPORTUNITY: PARTNERSHIPS FOR BETTER GROWTH AND A BETTER CLIMATE
Total CO2
emissions for 2012 are estimated at 34.5 Gt. See: Olivier, J. G. J., Janssens-Maenhout, G., Muntean, M. and Peters, J. A. H. W., 2013. Trends in
Global CO2
Emissions: 2013 Report. PBL Netherlands Environmental Assessment Agency, The Hague. Available at: http://www.pbl.nl/en/publications/
trends-in-global-co2-emissions-2013-report48.pdf. http://www.pbl.nl/sites/default/files/cms/publicaties/pbl-2013-trends-in-global-co2-emissions-2013-
report-1148.pdf
334 IMO, 2014. Third IMO GHG Study, 2014.
335 ICCT, 2014. Another Look Into the Crystal Ball. Blog post, 14 March. International Council on Clean Transportation. Available at: http://www.theicct.
org/blogs/staff/another-look-crystal-ball-imo.
336 According to the Third IMO GHG Study, an additional 15 MtCO2
e come from refrigerant and air conditioning gases on ships.
337 IMO, 2014. Third IMO GHG Study 2014. The discrepancy is due to different estimation methods (top-down vs. bottom-up).
338 The remainder is marine diesel oil (MDO), with marginal usage of liquefied natural gas (LNG). See: IMO, 2014. Third IMO GHG Study 2014.
339 IMO, 2015. The Existing Shipping Fleet’s CO2
Efficiency. International Maritime Organization, London. Available at: ftp://ftp.dpn.minambiente.it/MEPC68/
MEPC%2068-INF.24-Rev.1%20-%20The%20Existing%20Shipping%20Fleet%27s%20CO2%20Efficiency%20%28Secretariat%29.pdf.
ICCT, 2013. Long-term Potential for Increased Shipping Efficiency through the Adoption of Industry-Leading Practices. White paper. International Council on
Clean Transportation., Washington, DC. Available at: http://www.theicct.org/sites/default/files/publications/ICCT_ShipEfficiency_20130723.pdf.
340 Smith, T., O’Keeffe, E., Aldous, L. and Agnolucci, P., 2013. Assessment of Shipping’s Efficiency Using Satellite AIS Data. UCL Energy Institute, University
College London. Prepared for the International Council on Clean Transportation. Available at: http://lowcarbonshipping.co.uk/files/ucl_admin/Smith_et_
al__2013_World_fleet_efficiency.pdf.
341 Smith, T., O’Keeffe, E., Aldous, L. and Agnolucci, P., 2013. Assessment of Shipping’s Efficiency Using Satellite AIS Data.
342 Seas at Risk, 2010. Going Slow to Reduce Emissions. Available at: http://www.seas-at-risk.org/images/pdf/GoingSlowToReduceEmissions_1.pdf.
343 Smith et al., 2013. Assessment of Shipping’s Efficiency Using Satellite AIS Data.
344 Faber, J., and ‘t Hoen, M., 2015. Historical Trends in Ship Design Efficiency. Prepared for Seas At Risk and Transport & Environment. CE Delft, Delft.
Available at: http://www.transportenvironment.org/publications/study-historical-trends-ship-design-efficiency.
345 Actual efficiency gains can vary significantly based on ship type and operating conditions, and independent testing in realistic conditions is relatively
rare. Savings and payback periods also fluctuate with the price of fuel.
346 International Council on Clean Transportation, 2011. Reducing Greenhouse Gas Emissions from Ships. White Paper Number 11. Available at:http://www.
theicct.org/sites/default/files/publications/ICCT_GHGfromships_jun2011.pdf.
347 Corbett, J.J., Winebrake, J.J., Comer, B. and Green, E., 2011. Energy and GHG Emissions Savings Analysis of Fluoropolymer Foul Release Hull Coating. Energy
and Environmental Research Associates, LLC. Available at: http://www.theengineer.co.uk/Journals/1/Files/2011/2/21/20110215b%20International%20
Paint%20Report.pdf.
The incremental cost above traditional coatings is only US$180,000, which would make the payback period even shorter.
348 Stulgis, V., Smith, T., Rehmatulla, N., Powers, J. and Hoppe, J., 2014. Hidden Treasure: Financial Models for Retrofits. Carbon War Room, Washington.
Available at: http://lowcarbonshipping.co.uk/files/ucl_admin/CWR_Shipping_Efficiency_Finance_Report.pdf.
Rehmatulla, N. and Smith, T., forthcoming. Barriers to energy efficiency in shipping: A triangulated approach to investigate the principal agent problem.
Accepted for publication in Energy Policy.
Maddox Consulting, 2012. Analysis of market barriers to cost effective GHG emission reductions in the maritime transport sector. Available at: http://ec.europa.
eu/clima/policies/transport/shipping/docs/market_barriers_2012_en.pdf.
349 Carbon War Room and RightShip, n.d. Shipping Efficiency. Available at: http://www.shippingefficiency.org [accessed 4 June 2015].
350 Clean Shipping Index, n.d. About the Clean Shipping Index. Available at: http://www.cleanshippingindex.com/about/ [accessed 5 May 2015].
351 Stulgis et al., 2014. Hidden Treasure: Financial Models for Retrofits.
352 IMO, 2010. Control of Greenhouse Gas Emissions from Ships Engaged in International Trade. Position note. International Maritime Organization, London.
Available at: http://www.imo.org/OurWork/Environment/PollutionPrevention/AirPollution/Documents/COP%2016%20Submissions/IMO%20note%20
COP%2016.pdf.
353 The EEDI applies to the majority of new ships, but not all. Ships with less than 400 gross tonnage are also exempt. The ships covered by the EEDI
represent approximately 85% of the CO2
emissions from international shipping. For more information, see: IMO, n.d. Energy Efficiency Measures. Available
at: http://www.imo.org/OurWork/Environment/PollutionPrevention/AirPollution/Pages/Technical-and-Operational-Measures.aspx.
354 IMO, 2012. 2012 Guidelines for the Development of a Ship Energy Efficiency Management Plan (SEEMP). Annex 9, Resolution MEPC.213(63).
Marine Environment Protection Committee of the International Maritime Organization. Available at: http://www.imo.org/KnowledgeCentre/
IndexofIMOResolutions/Documents/MEPC%20-%20Marine%20Environment%20Protection/213%2863%29.pdf.
355 Bazari and Longva, 2011. Assessment of IMO Mandated Energy Efficiency Measures for International Shipping.
IMO Secretariat, 2011. UNFCCC Subsidiary Body for Scientific and Technical Advice (SBSTA 35). Agenda item 9(a) – Emissions from fuel used for
international aviation and maritime transport. Submission to the 35th Meeting of the UNFCCC Subsidiary Body for Scientific and Technical Advice (SBSTA
35). Agenda item 9(a). International Maritime Organization Available at: http://www.imo.org/OurWork/Environment/PollutionPrevention/AirPollution/
Documents/COP%2017/Statements/IMO%20SBSTA%2035%20As%20delivered%2029.11.11.pdf.](https://image.slidesharecdn.com/nce-2015seizing-the-global-opportunityweb-150708211503-lva1-app6891/85/Seizing-the-Global-Opportunity-Partnerships-for-Better-Growth-and-a-Better-Climate-71-320.jpg)
![72 www.newclimateeconomy.report
356 IMO, 2014. Third IMO GHG Study 2014.
357 IMO, 2015. Reduction of GHG Emissions from Ships: Setting a Reduction Target and Agreeing Associated Measures for International Shipping. MEPC 68/5/1.
Marine Environment Protection Committee of the International Maritime Organization. Available at: http://www.lowcarbonshipping.co.uk/files/Ben_
Howett/MEPC_68-5-1_-_Setting_a_reduction_target_and_agreeing_associated_measures_for_international_shipping_28Marshall_Islands29.pdf.
358 ICCT, 2013. Long-term Potential for Increased Shipping Efficiency through the Adoption of Industry-Leading Practices.
359 Overall, HFC emissions are growing at a rate of 8–9% per year, but the focus of mitigation efforts is on widely used HFCs with high global warming
potential (GWP), with the cutoff usually set at 1,000 over 100 years (that is, 1,000 times the warming impact of CO2
over 100 years).
See: Velders, G. J. M., Ravishankara, A. R., Miller, M. K., Molina, M. J., Alcamo, J., Daniel, J. S., Fahey, D. W., Montzka, S. A. and Reimann, S., 2012. Preserving
Montreal Protocol climate benefits by limiting HFCs. Science, 335. 922–923. DOI:10.1126/science.1216414.
See also: WMO, 2010. Scientific Assessment of Ozone Depletion: 2010. Global Ozone Research and Monitoring Project—Report No. 52. World
Meteorological Organization. Available at: http://ozone.unep.org/new_site/en/scientific_assessment_2010.php.
360 Myhre, G., Shindell, D., Bréon, F.-M., Collins, W., Fuglestvedt, J. et al., 2013. Anthropogenic and natural radiative forcing. In Climate Change 2013: The
Physical Science Basis. Contribution of Working Group I to the Fifth Assessment Report of the Intergovernmental Panel on Climate Change. T. F. Stocker, D. Qin, G.-K.
Plattner, M. Tignor, S. K. Allen, et al. (eds.). Cambridge University Press, Cambridge, UK, and New York. Available at: https://www.ipcc.ch/report/ar5/wg1/.
361 New Climate Economy, 2015. Estimates of Emissions Reduction Potential for the 2015 Report: Technical Note. A technical note for Seizing the Global
Opportunity: Partnerships for Better Growth and a Better Climate. Available at: http://newclimateeconomy.report/misc/working-papers.
362 The Consumer Goods Forum, 2012. The CGF Good Practices About HFC-Free Refrigeration and Energy Efficiency. Available at: http://ausref.org.au/
index.php/resources/downloads/category/7-engo-reports?download=17:cgf-refrigeration-progress-report.
363 Refrigerants, Naturally!, n.d. About Us. Available at: http://www.refrigerantsnaturally.com/about-us [accessed 29 April 2015].
364 The numbers given are for HFCs’ 100-year global warming potential (GWP). The average GWP for HFCs currently used as substitutes for ODSs is
1,600, weighted by usage. See: Myhre et al., 2013. Anthropogenic and natural radiative forcing.
365 Velders, G. J. M., Solomon, S. and Daniel, J. S., 2014. Growth of climate change commitments from HFC banks and emissions. Atmospheric Chemistry and
Physics, 14. 4563–4572. DOI:10.5194/acp-14-4563-2014.
See also: UNEP, 2011. HFCs: A Critical Link in Protecting Climate and the Ozone Layer. Synthesis Report, United Nations Environment Programme, Nairobi.
Available at: http://www.unep.org/publications/contents/pub_details_search.asp?ID=6224.
366 Meek, K., 2015. Reducing HFCs in the US would benefit consumers and the climate. WRI blog. World Resources Institute, Washington, DC, 3 March.
Available at: http://www.wri.org/blog/2015/03/reducing-hfcs-us-would-benefit-consumers-and-climate.
367 Carvalho, S., Andersen, S. O., Brack, D. and Sherman, N. J., 2014. Alternatives to High-GWP Hydrofluorocarbons. Institute for Governance & Sustainable
Development. Available at: http://www.igsd.org/documents/HFCSharpeningReport.pdf.
368 See: Hydrocarbons 21, 2013. Heineken’s successful rollout of HC coolers- exclusive interview with Maarten ten Houten. 4 December. Available at:
http://www.hydrocarbons21.com/news/viewprintable/4760.
369 See: The Coca-Cola Company, 2014. Coca-Cola Installs 1 Millionth HFC-Free Cooler Globally, Preventing 5.25MM Metric Tons of CO2
. Press release,
22 January. Available at: http://www.coca-colacompany.com/innovation/coca-cola-installs-1-millionth-hfc-free-cooler-globally-preventing-525mm-
metrics-tons-of-co2.
370 UNEP and CCAC, 2014. Low-GWP Alternatives in Commercial Refrigeration: Propane, CO2
and HFO Case Studies. United Nations Environment Programme
and Climate and Clean Air Coalition to Reduce Short-Lived Climate Pollutants, Paris. Available at: http://www.unep.org/ccac/portals/50162/docs/Low-
GWP_Alternatives_in_Commercial_Refrigeration-Case_Studies-Final.pdf.
371 UNEP, 2011. HFCs: A Critical Link in Protecting Climate and the Ozone Layer.
372 Velders et al., 2012. Preserving Montreal Protocol climate benefits by limiting HFCs.
373 US EPA, 2013. Global Mitigation of Non-CO2
Greenhouse Gases: 2010–2030. Section IV.2.3.3. US Environmental Protection Agency, Washington, DC.
Available at: http://www.epa.gov/climatechange/Downloads/EPAactivities/MAC_Report_2013-IV_Industrial.pdf.
374 Shah, N., Wei, M. and Phadke, A., 2015. Energy Efficiency Benefits in Implementing Low Global Warming Potential Refrigerants in Air Conditioning – Some
Preliminary Results. Presentation before the Open-Ended Working Group of the Montreal Protocol, Bangkok, Thailand, 23 April 2015. Available at:
http://conf.montreal-protocol.org/meeting/oewg/oewg-35/pubs/SitePages/Home.aspx.
375 Phadke, A., Adhyankar, N. and Shah, N., 2013. Avoiding 100 New Power Plants by Increasing Efficiency of Room Air Conditioners in India: Opportunities and
Challenges. Lawrence Berkeley National Laboratory. Available at: http://www.superefficient.org/en/Resources/~/media/Files/EEDAL%20Papers%20-%20
2013/031_Shah_finalpaper_EEDAL13.pdf.
376 US EPA, 2014. Benefits of Addressing HFCs under the Montreal Protocol. EPA 430-R-14-005. US Environmental Protection Agency, Washington, DC.
Available at: http://www.epa.gov/ozone/downloads/Benefits_of_Addressing_HFCs_under_the_Montreal_Protocol-July2014MASTER_REV4.pdf.
377 Velders et al., 2012. Preserving Montreal Protocol climate benefits by limiting HFCs.
378 The CCAC has developed a guidance note to help countries identify specific actions on HFCs and other short-lived climate pollutants (SLCPs) that may
be included in their INDCs. See: CCAC, 2015. Guidance Note on Short-Lived Climate Pollutants for Intended Nationally Determined Contributions. Climate and
Clean Air Coalition to Reduce Short-Lived Climate Pollutants, Paris. Available at: http://www.ccacoalition.org/docs/pdf/Guidance_note_on_SLCPs_for_
INDCs-16march2015.pdf.](https://image.slidesharecdn.com/nce-2015seizing-the-global-opportunityweb-150708211503-lva1-app6891/85/Seizing-the-Global-Opportunity-Partnerships-for-Better-Growth-and-a-Better-Climate-72-320.jpg)
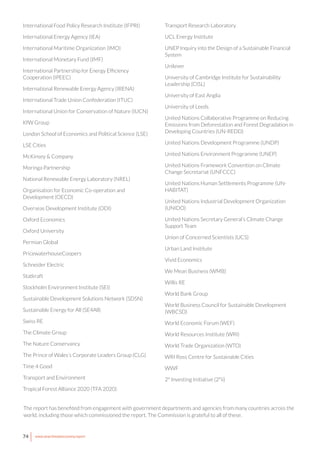

The 2015 New Climate Economy report encourages better economic growth alongside addressing climate change, emphasizing international cooperation for sustainable development. Key opportunities identified include partnerships across various sectors to enhance resource efficiency, infrastructure investment, and innovation, aiming to reduce greenhouse gas emissions significantly. The report also outlines ten actionable areas for stronger climate action, suggesting a strong international agreement at COP21 could catalyze a transition to a low-carbon economy.