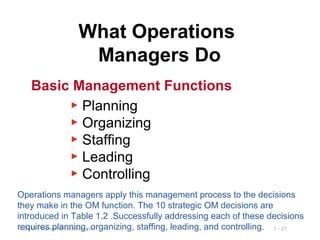
This document provides an overview and introduction to operations management. It discusses key concepts like what operations management is, the distinction between goods and services, and productivity. It uses examples from companies like Hard Rock Cafe to illustrate operations management in practice. The learning objectives are defined as understanding definitions of operations management, differences between goods and services, and factors that impact productivity. Key responsibilities of operations managers are outlined as planning, organizing, staffing, leading, and controlling strategic decisions around areas like process design and supply chain management.

![1 - 20© 2014 Pearson Education, Inc.
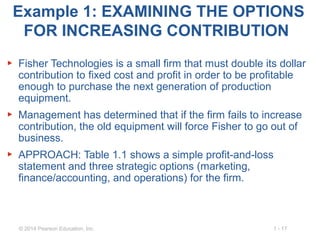
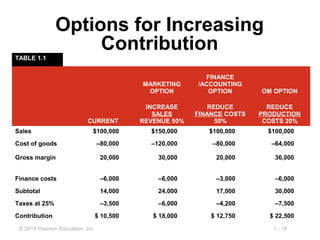
Example 1: EXAMINING THE OPTIONS
FOR INCREASING CONTRIBUTION
▶ SOLUTION: Given the conditions of our brief example, Fisher
Technologies has increased contribution from $10,500 to
$22,500.
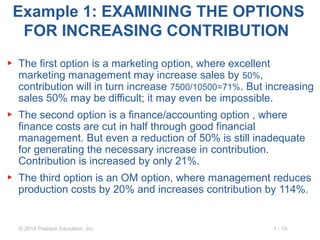
▶ INSIGHT: The OM option not only yields the greatest
improvement in contribution but also may be the only feasible
option. Increasing sales by 50% and decreasing finance cost
by 50% may both be virtually impossible. Reducing operations
cost by 20% may be difficult but feasible.
▶ LEARNING EXERCISE: What is the impact of only a 15%
decrease in costs in the OM option?
▶ [Answer: A $19,500 contribution; an 86% increase.]
▶ Example1 underscores the importance of the effective
operations activity of a firm. Development of increasingly
effective operations is the approach taken by many companies
as they face growing global competition.](https://image.slidesharecdn.com/mych01-171021211036/85/My-ch01-20-320.jpg)


![Operational Management Chapter - [01].ppt](https://cdn.slidesharecdn.com/ss_thumbnails/op01-240303184106-469fa322-thumbnail.jpg?width=640&height=640&fit=bounds)


