Download as PDF, PPTX
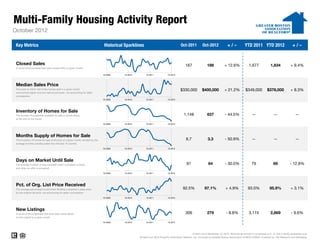
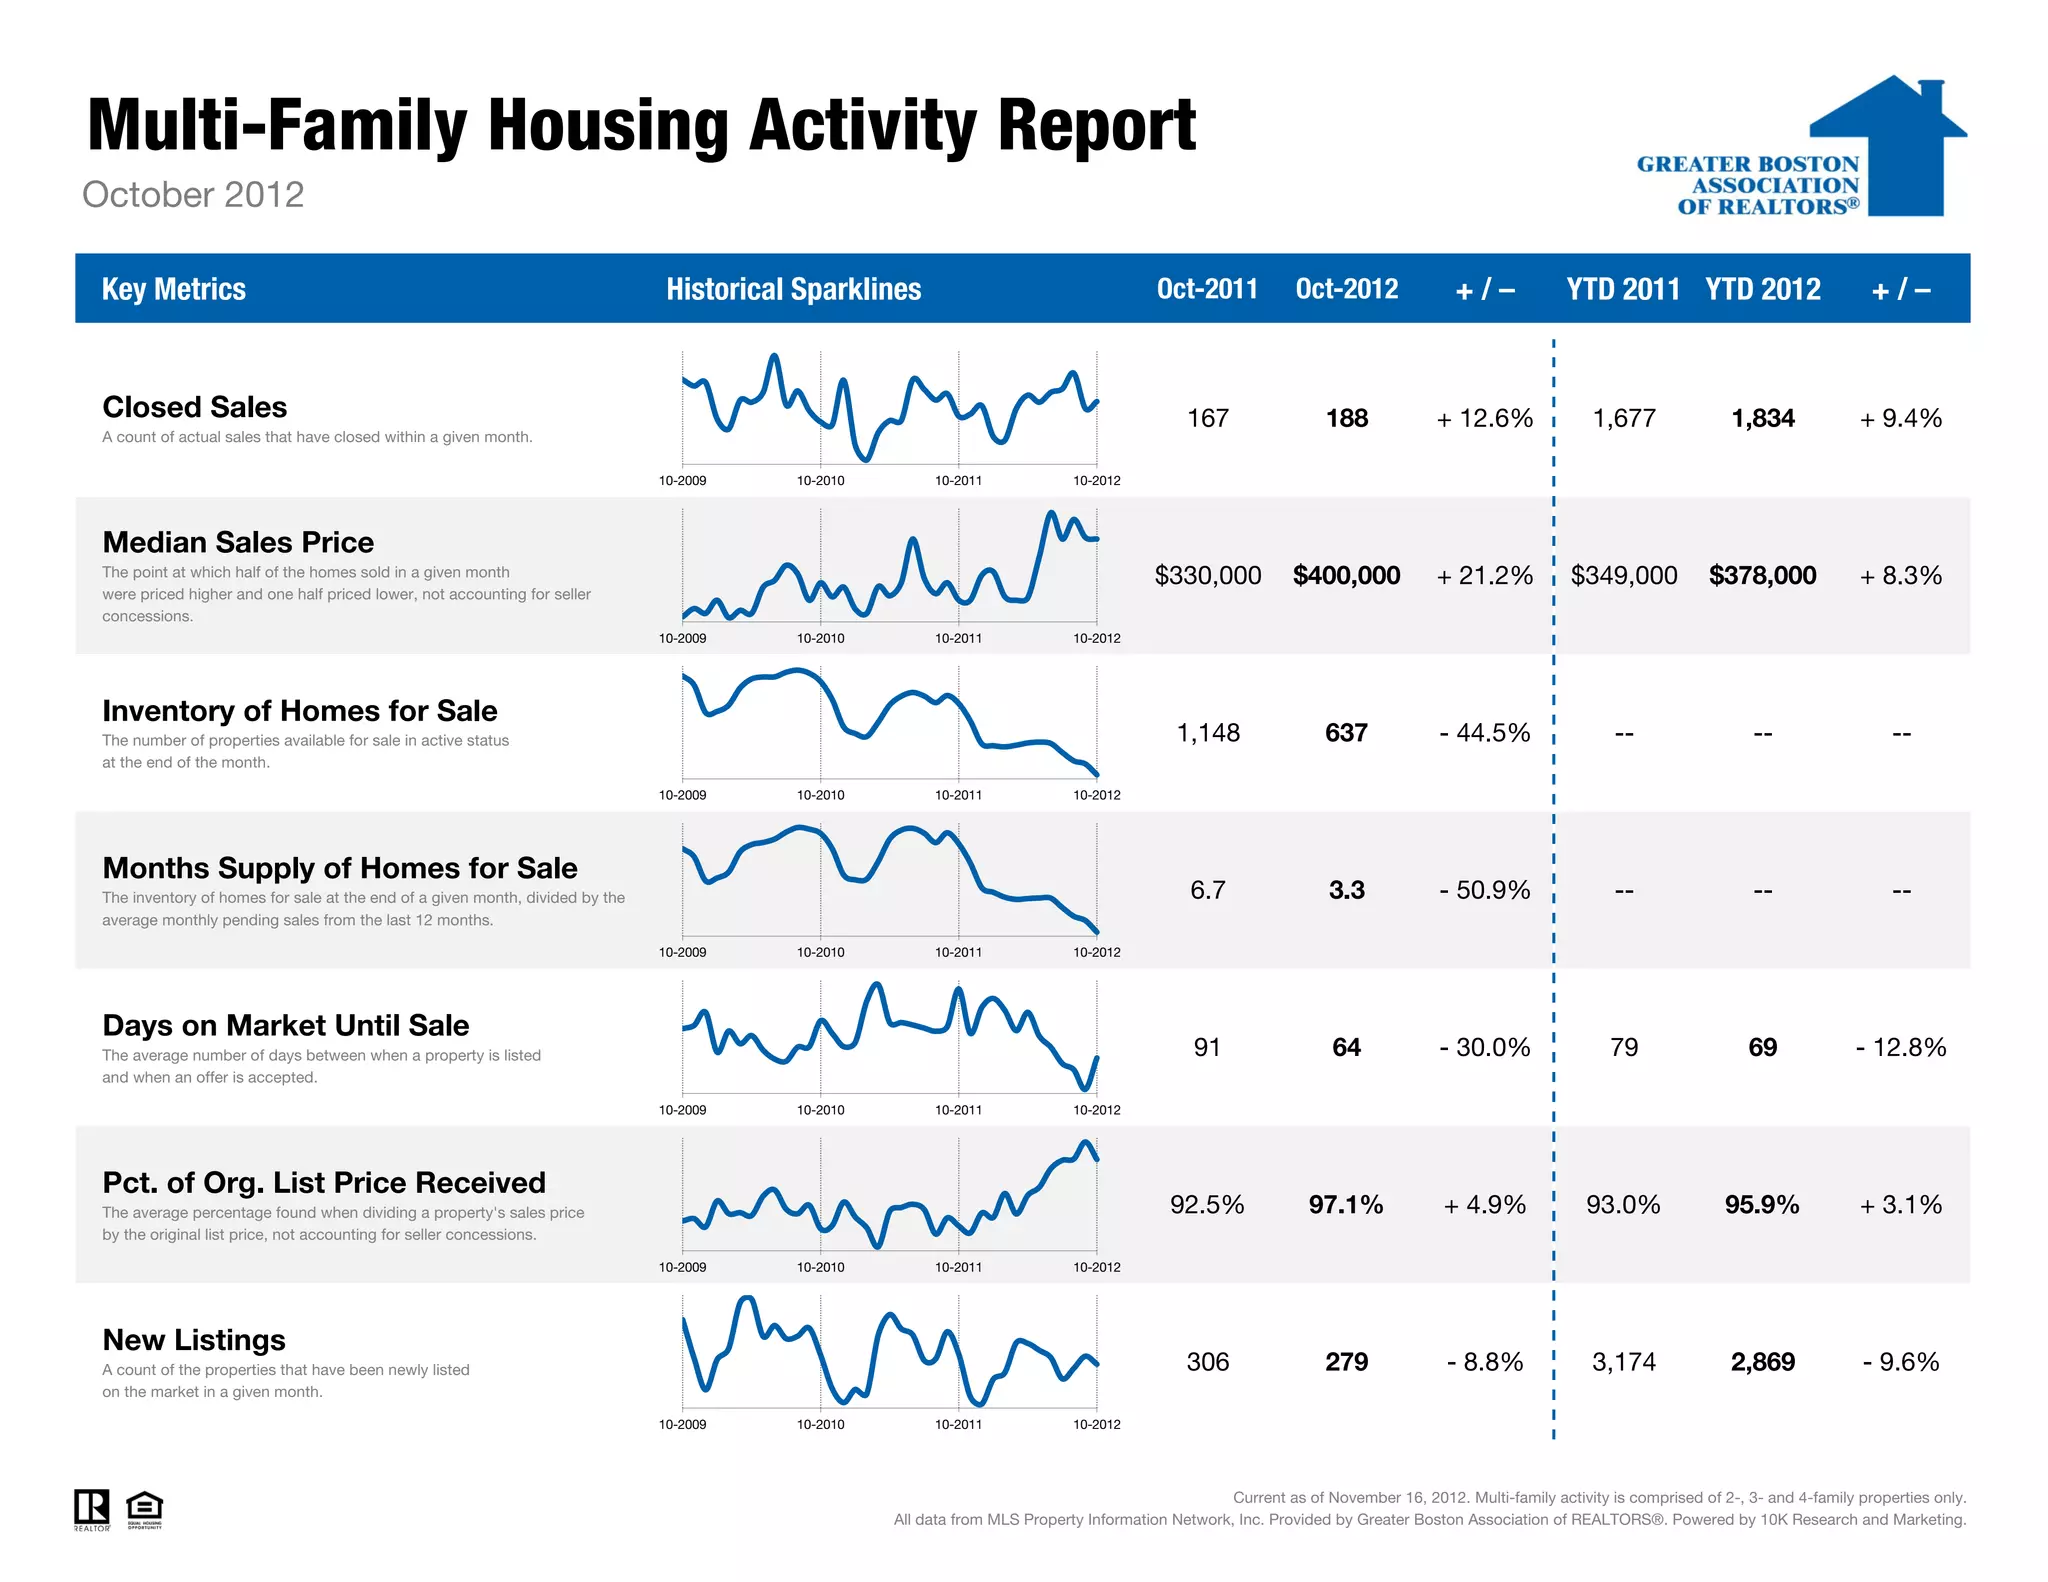
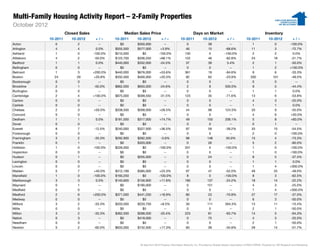
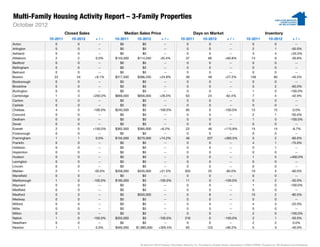
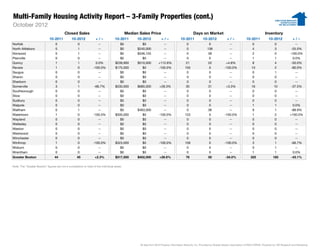
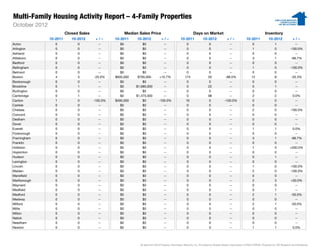
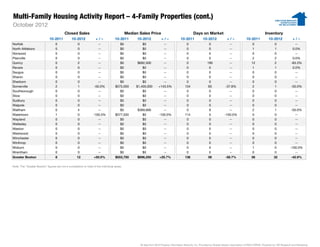

The report summarizes multi-family housing activity for October 2012. Key metrics such as closed sales, median sales price, inventory, and days on market are presented alongside year-over-year comparisons. Closed sales increased 12.6% from October 2011 while median sales price rose 21.2%. Inventory declined sharply by 44.5% and months supply fell by 50.9%, indicating a tighter market. Days on market also decreased by 30%, showing quicker sales.


