Kohinoor Flats In Hinjewadi Phase 2 | Homes Built To Suit Your Needs
October 2012 MLS Statistics
1. October 2012
Area Delimited by Entire OK State MLS
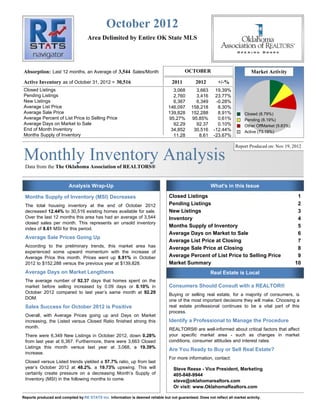
Absorption: Last 12 months, an Average of 3,544 Sales/Month OCTOBER Market Activity
Active Inventory as of October 31, 2012 = 30,516 2011 2012 +/-%
Closed Listings 3,068 3,663 19.39%
Pending Listings 2,760 3,416 23.77%
New Listings 6,367 6,349 -0.28%
Average List Price 146,097 158,218 8.30%
Average Sale Price 139,828 152,288 8.91% Closed (8.79%)
Average Percent of List Price to Selling Price 95.27% 95.85% 0.61% Pending (8.19%)
Average Days on Market to Sale 92.29 92.37 0.10% Other OffMarket (9.83%)
End of Month Inventory 34,852 30,516 -12.44% Active (73.19%)
Months Supply of Inventory 11.28 8.61 -23.67%
Report Produced on: Nov 19, 2012
Monthly Inventory Analysis
Data from the The Oklahoma Association of REALTORS®
Analysis Wrap-Up What's in this Issue
Months Supply of Inventory (MSI) Decreases Closed Listings 1
The total housing inventory at the end of October 2012 Pending Listings 2
decreased 12.44% to 30,516 existing homes available for sale. New Listings 3
Over the last 12 months this area has had an average of 3,544 Inventory 4
closed sales per month. This represents an unsold inventory
Months Supply of Inventory 5
index of 8.61 MSI for this period.
Average Days on Market to Sale 6
Average Sale Prices Going Up
Average List Price at Closing 7
According to the preliminary trends, this market area has Average Sale Price at Closing 8
experienced some upward momentum with the increase of
Average Price this month. Prices went up 8.91% in October Average Percent of List Price to Selling Price 9
2012 to $152,288 versus the previous year at $139,828. Market Summary 10
Average Days on Market Lengthens Real Estate is Local
The average number of 92.37 days that homes spent on the
market before selling increased by 0.09 days or 0.10% in Consumers Should Consult with a REALTOR®
October 2012 compared to last year’s same month at 92.29 Buying or selling real estate, for a majority of consumers, is
DOM. one of the most important decisions they will make. Choosing a
Sales Success for October 2012 is Positive real estate professional continues to be a vital part of this
process.
Overall, with Average Prices going up and Days on Market
increasing, the Listed versus Closed Ratio finished strong this Identify a Professional to Manage the Procedure
month. REALTORS® are well-informed about critical factors that affect
There were 6,349 New Listings in October 2012, down 0.28% your specific market area - such as changes in market
from last year at 6,367. Furthermore, there were 3,663 Closed conditions, consumer attitudes and interest rates.
Listings this month versus last year at 3,068, a 19.39%
Are You Ready to Buy or Sell Real Estate?
increase.
For more information, contact:
Closed versus Listed trends yielded a 57.7% ratio, up from last
year’s October 2012 at 48.2%, a 19.73% upswing. This will Steve Reese - Vice President, Marketing
certainly create pressure on a decreasing Month’s Supply of 405-848-9944
Inventory (MSI) in the following months to come. steve@oklahomarealtors.com
Or visit: www.OklahomaRealtors.com
Reports produced and compiled by RE STATS Inc. Information is deemed reliable but not guaranteed. Does not reflect all market activity.
2. Monthly Inventory Analysis
Data from the The Oklahoma Association of
REALTORS®
October 2012
Closed Sales as of Nov 12, 2012
Closed Listings Report Produced on: Nov 19, 2012
Area Delimited by Entire OK State MLS
OCTOBER YEAR TO DATE (YTD)
2008 2009 2010 2011 2012 2008 2009 2010 2011 2012
3,859 3,663 37,397 36,602
3,468
3,068 34,002
2,672 31,513 31,899
1 Year 1 Year
+19.39% +14.74%
2 Year 2 Year
+37.09% +16.15%
5 YEAR MARKET ACTIVITY TRENDS 5yr OCT AVG = 3,346 3 MONTHS
5,000 High A 4,313
Jul 2008 = 4,369 U
4,000
Low G
3,000 Jan 2010 = 1,852 S 3,405
E
Closed Listings
2,000 Closed Listings
this P -21.05%
1,000 month at 3,663,
above the 5 yr OCT O 3,663
C
0
Jun 2008 Dec 2008Jun 2009 Dec 2009Jun 2010 Dec 2010Jun 2011 Dec 2011Jun 2012 average of 3,346 T 7.58%
CLOSED LISTINGS & BEDROOMS DISTRIBUTION BY PRICE
Distribution of Closed Listings by Price Range % AVDOM 2 Beds 3 Beds 4 Beds 5 Beds+
$25,000
and less 225 6.14% 149.5 152 62 10 1
$25,001
$50,000 360 9.83% 93.7 161 173 25 1
$50,001
$100,000 730 19.93% 96.5 234 429 62 5
$100,001
Contact an experienced REALTOR
Ready to Buy or Sell Real Estate?
$150,000 904 24.68% 84.5 193 592 111 8
$150,001
$200,000 630 17.20% 76.5 106 363 155 6
$200,001
$275,000 433 11.82% 94.8 66 177 174 16
$275,001
and up 381 10.40% 91.5 54 80 205 42
Total Closed Units: 3,663 92.4 966 1876 742 79
Total Closed Volume: 557,829,690 105.96M 251.96M 170.02M 29.89M
Average Closed Price: $152,288 $109,689 $134,306 $229,139 $378,373
Reports produced and compiled by RE STATS Inc. Information is deemed reliable but not guaranteed. Does not reflect all market activity. pp. 1
Steve Reese 405-848-9944 steve@oklahomarealtors.com
3. Monthly Inventory Analysis
Data from the The Oklahoma Association of
REALTORS®
October 2012
Pending Listings as of Nov 12, 2012
Pending Listings Report Produced on: Nov 19, 2012
Area Delimited by Entire OK State MLS
OCTOBER YEAR TO DATE (YTD)
2008 2009 2010 2011 2012 2008 2009 2010 2011 2012
3,607 3,416 37,470 36,849
35,986
2,766 2,760 32,084
2,425 31,583
1 Year 1 Year
+23.77% +16.67%
2 Year 2 Year
+40.87% +14.85%
5 YEAR MARKET ACTIVITY TRENDS 5yr OCT AVG = 2,995 3 MONTHS
6,000 High A 3,281
Apr 2010 = 5,192 U
5,000
Low G
4,000
Dec 2008 = 2,202 S 2,612
3,000 E
Pending Listings
2,000
Pending Listingsthis P -20.39%
month at 3,416,
above the 5 yr OCT O 3,416
1,000
0
C
Jun 2008 Dec 2008Jun 2009 Dec 2009Jun 2010 Dec 2010Jun 2011 Dec 2011Jun 2012 average of 2,995 T 30.78%
PENDING LISTINGS & BEDROOMS DISTRIBUTION BY PRICE
Distribution of Pending Listings by Price Range % AVDOM 2 Beds 3 Beds 4 Beds 5 Beds+
$25,000
and less 184 5.39% 68.6 118 54 11 1
$25,001
$50,000 315 9.22% 99.0 149 144 18 4
$50,001
$100,000 754 22.07% 89.3 246 455 45 8
$100,001
Contact an experienced REALTOR
Ready to Buy or Sell Real Estate?
$150,000 790 23.13% 78.6 152 523 111 4
$150,001
$200,000 574 16.80% 90.6 91 318 152 13
$200,001
$275,000 398 11.65% 76.8 62 148 177 11
$275,001
and up 401 11.74% 92.2 64 100 203 34
Total Pending Units: 3,416 122.3 882 1742 717 75
Total Pending Volume: 551,337,865 111.87M 237.63M 175.18M 26.66M
Average Listing Price: $154,355 $126,841 $136,411 $244,320 $355,449
Reports produced and compiled by RE STATS Inc. Information is deemed reliable but not guaranteed. Does not reflect all market activity. pp. 2
Steve Reese 405-848-9944 steve@oklahomarealtors.com
4. Monthly Inventory Analysis
Data from the The Oklahoma Association of
REALTORS®
October 2012
New Listings as of Nov 12, 2012
New Listings Report Produced on: Nov 19, 2012
Area Delimited by Entire OK State MLS
OCTOBER YEAR TO DATE (YTD)
2008 2009 2010 2011 2012 2008 2009 2010 2011 2012
6,544 73,563 73,848
6,405 6,367 6,349 71,885 71,823
6,162 68,179
1 Year 1 Year
-0.28% +2.82%
2 Year 2 Year
-0.87% +2.73%
5 YEAR MARKET ACTIVITY TRENDS 5yr OCT AVG = 6,365 3 MONTHS
9,000 High A 7,603
8,000 Mar 2010 = 8,973 U
7,000
Low G
6,000
5,000
Dec 2008 = 4,303 S 6,280
4,000 E
New Listings
3,000
New Listings this P -17.40%
2,000 month at 6,349,
1,000 below the 5 yr OCT O 6,349
C
0
Jun 2008 Dec 2008Jun 2009 Dec 2009Jun 2010 Dec 2010Jun 2011 Dec 2011Jun 2012 average of 6,365 T 1.10%
NEW LISTINGS & BEDROOMS DISTRIBUTION BY PRICE
Distribution of New Listings by Price Range % 2 Beds 3 Beds 4 Beds 5 Beds+
$25,000
and less 395 6.22% 319 64 11 1
$25,001
$50,000 586 9.23% 355 202 26 3
$50,001
$100,000 1,391 21.91% 530 750 101 10
$100,001
Contact an experienced REALTOR
Ready to Buy or Sell Real Estate?
$150,000 1,367 21.53% 276 933 150 8
$150,001
$200,000 967 15.23% 176 539 230 22
$200,001
$325,000 942 14.84% 170 358 366 48
$325,001
and up 701 11.04% 112 160 318 111
Total New Listed Units: 6,349 1938 3006 1202 203
Total New Listed Volume: 1,232,292,804 342.06M 451.84M 329.94M 108.45M
Average New Listed Listing Price: $219,364 $176,500 $150,314 $274,494 $534,234
Reports produced and compiled by RE STATS Inc. Information is deemed reliable but not guaranteed. Does not reflect all market activity. pp. 3
Steve Reese 405-848-9944 steve@oklahomarealtors.com
5. Monthly Inventory Analysis
Data from the The Oklahoma Association of
REALTORS®
October 2012
Active Inventory as of Nov 12, 2012
Active Inventory Report Produced on: Nov 19, 2012
Area Delimited by Entire OK State MLS
END OF OCTOBER ACTIVE DURING OCTOBER
2008 2009 2010 2011 2012 2008 2009 2010 2011 2012
34,755 34,845 41,395 41,938
32,198 38,750 38,032
30,516
29,155 36,171
1 Year 1 Year
-12.42% -9.31%
2 Year 2 Year
-12.20% -8.12%
5 YEAR MARKET ACTIVITY TRENDS 5yr OCT AVG = 32,294 3 MONTHS
Active Inventory
40,000 High A 32,292
Aug 2011 = 35,731 U
30,000 Low G
Jan 2008 = 26,730 S 31,741
20,000 E
Inventory this P -1.71%
10,000 month at 30,516,
below the 5 yr OCT O 30,516
C
0
Jun 2008Dec 2008Jun 2009Dec 2009Jun 2010Dec 2010Jun 2011Dec 2011Jun 2012 average of 32,294 T -3.86%
INVENTORY & BEDROOMS DISTRIBUTION BY PRICE
Distribution of Inventory by Price Range % AVDOM 2 Beds 3 Beds 4 Beds 5 Beds+
$25,000
and less 2,549 8.35% 360.8 2,386 134 23 6
$25,001
$50,000 3,948 12.94% 244.5 3,211 647 75 15
$50,001
$75,000 3,327 10.90% 149.3 1,921 1,218 168 20
$75,001
Contact an experienced REALTOR
Ready to Buy or Sell Real Estate?
$150,000 9,080 29.75% 126.0 3,123 4,987 890 80
$150,001
$200,000 4,180 13.70% 129.1 1,073 2,067 960 80
$200,001
$325,000 4,128 13.53% 125.7 1,011 1,424 1,480 213
$325,001
and up 3,304 10.83% 158.9 841 653 1,284 526
Total Active Inventory by Units: 30,516 167.4 13,566 11,130 4,880 940
Total Active Inventory by Volume: 5,670,050,074 1.96B 1.76B 1.41B 532.07M
Average Active Inventory Listing Price: $185,806 $144,821 $157,990 $289,942 $566,029
Reports produced and compiled by RE STATS Inc. Information is deemed reliable but not guaranteed. Does not reflect all market activity. pp. 4
Steve Reese 405-848-9944 steve@oklahomarealtors.com
6. Monthly Inventory Analysis
Data from the The Oklahoma Association of
REALTORS®
October 2012
Active Inventory as of Nov 12, 2012
Months Supply of Inventory Report Produced on: Nov 19, 2012
Area Delimited by Entire OK State MLS
MSI FOR OCTOBER INDICATORS FOR OCTOBER 2012
2008 2009 2010 2011 2012 Inventory Closed Absorption MSI MSI %
11.0 11.3 42,532
30,516 8.6 11.615%
8.8 8.9 8.6
1 Year 3,544
End of Closed Average Months Percent
-23.65% Month Last Closed per Supply Months
2 Year Active 12 Month over of Supply of
-21.90% Inventory Months 12 Months Inventory Inventory
5 YEAR MARKET ACTIVITY TRENDS 5yr OCT AVG = 9.7 3 MONTHS
20 High A 9.2
Jun 2011 = 12.2 U
Low G
Jan 2008 = 6.6 S 9.1
10 E
Months Supply
Months Supply this P -1.56%
month at 8.6,
below the 5 yr OCT O 8.6
C
0
Jun 2008 Dec 2008 Jun 2009 Dec 2009 Jun 2010 Dec 2010 Jun 2011 Dec 2011 Jun 2012 average of 9.7 T -5.20%
MONTHS SUPPLY & BEDROOMS DISTRIBUTION BY PRICE
Distribution of Active Inventory by Price Range and MSI % MSI 2 Beds 3 Beds 4 Beds 5 Beds+
$20,000
and less 1,656 5.43% 11.7 16.4 1.9 2.8 8.6
$20,001
$50,000 4,841 15.86% 11.1 18.4 3.7 3.3 5.6
$50,001
$80,000 4,130 13.53% 9.2 14.1 6.3 6.9 9.9
$80,001
Contact an experienced REALTOR
Ready to Buy or Sell Real Estate?
$150,000 8,277 27.12% 6.9 10.7 5.8 6.0 8.0
$150,001
$210,000 4,569 14.97% 7.1 11.3 6.5 5.8 8.5
$210,001
$340,000 3,959 12.97% 8.1 14.8 8.1 6.3 8.4
$340,001
and up 3,084 10.11% 16.0 37.6 16.3 11.7 15.0
MSI: 8.6 14.7 6.1 6.8 10.9
Total Active Inventory: 30,516 13,566 11,130 4,880 940
Reports produced and compiled by RE STATS Inc. Information is deemed reliable but not guaranteed. Does not reflect all market activity. pp. 5
Steve Reese 405-848-9944 steve@oklahomarealtors.com
7. Monthly Inventory Analysis
Data from the The Oklahoma Association of
REALTORS®
October 2012
Closed Sales as of Nov 12, 2012
Average Days on Market to Sale Report Produced on: Nov 19, 2012
Area Delimited by Entire OK State MLS
OCTOBER YEAR TO DATE (YTD)
2008 2009 2010 2011 2012 2008 2009 2010 2011 2012
96 93
92 92 90
86 87
79 85 84
1 Year 1 Year
+0.10% -3.19%
2 Year 2 Year
-3.95% +6.76%
5 YEAR MARKET ACTIVITY TRENDS 5yr OCT AVG = 89 3 MONTHS
Average Days on Market
200 High A 84
Mar 2011 = 103 U
Low G
Apr 2010 = 77 S 90
100 E
Average DOM this P 6.36%
month at 92,
above the 5 yr OCT O 92
C
0
Jun 2008 Dec 2008Jun 2009 Dec 2009Jun 2010 Dec 2010Jun 2011 Dec 2011Jun 2012 average of 89 T 2.84%
AVERAGE DOM OF CLOSED SALES & BEDROOMS DISTRIBUTION BY PRICE
Distribution of Average Days on Market to Sale by Price Range % AVDOM 2 Beds 3 Beds 4 Beds 5 Beds+
$25,000
and less 225 6.14% 149.5 187.1 68.5 76.2 181.0
$25,001
$50,000 360 9.83% 93.7 124.4 69.6 65.0 36.0
$50,001
$100,000 730 19.93% 96.5 108.1 91.3 85.1 149.8
$100,001
Contact an experienced REALTOR
Ready to Buy or Sell Real Estate?
$150,000 904 24.68% 84.5 123.0 72.5 84.8 45.5
$150,001
$200,000 630 17.20% 76.5 100.0 68.8 78.7 73.8
$200,001
$275,000 433 11.82% 94.8 125.5 96.1 83.7 73.9
$275,001
and up 381 10.40% 91.5 120.0 68.9 90.7 102.2
Average Closed DOM: 92.4 127.2 77.7 84.1 91.7
Total Closed Units: 3,663 966 1876 742 79
Total Closed Volume: 557,829,690 105.96M 251.96M 170.02M 29.89M
Reports produced and compiled by RE STATS Inc. Information is deemed reliable but not guaranteed. Does not reflect all market activity. pp. 6
Steve Reese 405-848-9944 steve@oklahomarealtors.com
8. Monthly Inventory Analysis
Data from the The Oklahoma Association of
REALTORS®
October 2012
Closed Sales as of Nov 12, 2012
Average List Price at Closing Report Produced on: Nov 19, 2012
Area Delimited by Entire OK State MLS
OCTOBER YEAR TO DATE (YTD)
2008 2009 2010 2011 2012 2008 2009 2010 2011 2012
158,218 156,107
148,322 149,481 149,214 150,653
146,097 147,194
141,825 144,709
1 Year 1 Year
+8.30% +3.62%
2 Year 2 Year
+5.84% +6.06%
5 YEAR MARKET ACTIVITY TRENDS 5yr OCT AVG = 149K 3 MONTHS
Average List Price
200,000 High A 163,895
Aug 2012 = 163,895 U
Low G
Nov 2008 = 136,425 S 158,619
100,000 E
Average LPrice this P -3.22%
month at 158,218,
above the 5 yr OCT O 158,218
C
0
Jun 2008Dec 2008Jun 2009Dec 2009Jun 2010Dec 2010Jun 2011Dec 2011Jun 2012 average of 148,789 T -0.25%
AVERAGE LIST PRICE OF CLOSED SALES & BEDROOMS DISTRIBUTION BY PRICE
Distribution of Average List Price at Closing by Price Range % AVL$ 2 Beds 3 Beds 4 Beds 5 Beds+
$25,000
and less 176 4.80% 17,536 21,667 20,034 22,625 10,000
$25,001
$50,000 354 9.66% 38,405 40,977 43,174 44,533 44,900
$50,001
$100,000 742 20.26% 77,656 77,702 82,597 81,867 86,580
$100,001
Contact an experienced REALTOR
Ready to Buy or Sell Real Estate?
$150,000 906 24.73% 128,810 132,786 130,148 133,187 135,587
$150,001
$200,000 630 17.20% 175,350 182,788 176,232 183,470 185,700
$200,001
$275,000 434 11.85% 235,285 239,962 241,773 241,645 246,848
$275,001
and up 421 11.49% 417,964 431,226 407,965 408,616 587,371
Average List Price: $158,218 $116,149 $138,911 $236,455 $396,277
Total Closed Units: 3,663 966 1876 742 79
Total List Volume: 579,551,690 112.20M 260.60M 175.45M 31.31M
Reports produced and compiled by RE STATS Inc. Information is deemed reliable but not guaranteed. Does not reflect all market activity. pp. 7
Steve Reese 405-848-9944 steve@oklahomarealtors.com
9. Monthly Inventory Analysis
Data from the The Oklahoma Association of
REALTORS®
October 2012
Closed Sales as of Nov 12, 2012
Average Sold Price at Closing Report Produced on: Nov 19, 2012
Area Delimited by Entire OK State MLS
OCTOBER YEAR TO DATE (YTD)
2008 2009 2010 2011 2012 2008 2009 2010 2011 2012
152,288 150,145
143,025 142,890 144,212 144,321
136,697 139,828 139,295 141,304
1 Year 1 Year
+8.91% +4.03%
2 Year 2 Year
+6.58% +6.26%
5 YEAR MARKET ACTIVITY TRENDS 5yr OCT AVG = 143K 3 MONTHS
Average Sold Price
200,000 High A 157,895
Aug 2012 = 157,895 U
Low G
Nov 2008 = 130,599 S 152,714
100,000 E
Average SPrice this P -3.28%
month at 152,288,
above the 5 yr OCT O 152,288
C
0
Jun 2008Dec 2008Jun 2009Dec 2009Jun 2010Dec 2010Jun 2011Dec 2011Jun 2012 average of 142,946 T -0.28%
AVERAGE SOLD PRICE OF CLOSED SALES & BEDROOMS DISTRIBUTION BY PRICE
Distribution of Average Sold Price at Closing by Price Range % AVS$ 2 Beds 3 Beds 4 Beds 5 Beds+
$25,000
and less 225 6.14% 17,379 17,178 17,967 17,627 9,000
$25,001
$50,000 360 9.83% 38,295 37,434 38,874 39,923 36,000
$50,001
$100,000 730 19.93% 76,720 72,942 78,420 78,940 80,180
$100,001
Contact an experienced REALTOR
Ready to Buy or Sell Real Estate?
$150,000 904 24.68% 127,487 127,952 127,103 128,296 133,475
$150,001
$200,000 630 17.20% 174,409 174,504 172,583 178,283 183,198
$200,001
$275,000 433 11.82% 234,801 232,198 233,567 236,564 240,009
$275,001
and up 381 10.40% 412,947 402,521 390,535 394,709 558,058
Average Closed Price: $152,288 $109,689 $134,306 $229,139 $378,373
Total Closed Units: 3,663 966 1876 742 79
Total Closed Volume: 557,829,690 105.96M 251.96M 170.02M 29.89M
Reports produced and compiled by RE STATS Inc. Information is deemed reliable but not guaranteed. Does not reflect all market activity. pp. 8
Steve Reese 405-848-9944 steve@oklahomarealtors.com
10. Monthly Inventory Analysis
Data from the The Oklahoma Association of
REALTORS®
October 2012
Closed Sales as of Nov 12, 2012
Average Percent of List Price to Selling Price Report Produced on: Nov 19, 2012
Area Delimited by Entire OK State MLS
OCTOBER YEAR TO DATE (YTD)
2008 2009 2010 2011 2012 2008 2009 2010 2011 2012
96.30% 96.39%
95.85% 96.06% 95.89% 96.02%
95.59%
95.19% 95.27% 95.50%
1 Year 1 Year
+0.61% +0.55%
2 Year 2 Year
+0.70% +0.14%
5 YEAR MARKET ACTIVITY TRENDS 5yr OCT AVG=95.64% 3 MONTHS
Average List/Sell Price
97 High A 96.24%
Sep 2008 = 96.70% U
Low G
96
Jan 2011 = 94.69% S 96.36%
E
95
Average List/Sell this P 0.12%
month at 95.85%,
above the 5 yr OCT O 95.85%
C
94
Jun 2008 Dec 2008 Jun 2009 Dec 2009 Jun 2010 Dec 2010 Jun 2011 Dec 2011 Jun 2012 average of 95.64% T -0.53%
AVERAGE L/S% OF CLOSED SALES & BEDROOMS DISTRIBUTION BY PRICE
Distribution of $avgmed L/S % by Price Range % AVL/S% 2 Beds 3 Beds 4 Beds 5 Beds+
$25,000
and less 225 6.14% 88.21% 84.72% 98.16% 79.33% 90.00%
$25,001
$50,000 360 9.83% 92.44% 93.03% 91.96% 92.39% 80.18%
$50,001
$100,000 730 19.93% 95.17% 94.45% 95.23% 97.72% 92.49%
$100,001
Contact an experienced REALTOR
Ready to Buy or Sell Real Estate?
$150,000 904 24.68% 97.40% 96.72% 97.78% 96.51% 98.46%
$150,001
$200,000 630 17.20% 97.60% 96.02% 98.12% 97.41% 98.61%
$200,001
$275,000 433 11.82% 97.47% 97.01% 97.10% 98.05% 97.30%
$275,001
and up 381 10.40% 96.49% 94.56% 96.70% 97.15% 95.41%
Average List/Sell Ratio: 95.90% 93.49% 96.63% 96.96% 95.90%
Total Closed Units: 3,663 966 1876 742 79
Total Closed Volume: 557,829,690 105.96M 251.96M 170.02M 29.89M
Reports produced and compiled by RE STATS Inc. Information is deemed reliable but not guaranteed. Does not reflect all market activity. pp. 9
Steve Reese 405-848-9944 steve@oklahomarealtors.com
11. Monthly Inventory Analysis
Data from the The Oklahoma Association of
REALTORS®
October 2012
Inventory as of Nov 12, 2012
Market Summary Report Produced on: Nov 19, 2012
Area Delimited by Entire OK State MLS
Inventory Inventory Market Activity Market Activity
New Listings Closed Sales
6,349 = 16.67% 3,663 = 8.79%
Start Inventory Pending Sales
31,743 3,416 = 8.19%
Total Inventory
Other Off Market
Units 4,100 = 9.83%
38,092
Volume Active Inventory
$7,075,951,562 30,516 = 73.19%
Absorption: Last 12 months, an Average of 3,544 Sales/Month OCTOBER Year To Date
Active Inventory as of October 31, 2012 = 30,516 2011 2012 +/-% 2011 2012 +/-%
Closed Sales 3,068 3,663 19.39% 31,899 36,602 14.74%
Pending Sales 2,760 3,416 23.77% 31,583 36,849 16.67%
New Listings 6,367 6,349 -0.28% 71,823 73,848 2.82%
Average List Price 146,097 158,218 8.30% 150,653 156,107 3.62%
Average Sale Price 139,828 152,288 8.91% 144,321 150,145 4.03%
Average Percent of List Price to Selling Price 95.27% 95.85% 0.61% 95.50% 96.02% 0.55%
Average Days on Market to Sale 92.29 92.37 0.10% 92.78 89.82 -3.19%
Monthly Inventory 34,852 30,516 -12.44% 34,852 30,516 -12.44%
Months Supply of Inventory 11.28 8.61 -23.67% 11.28 8.61 -23.67%
2011 2011
OCTOBER MARKET 2012 AVERAGE PRICES 2012
New Listings Pending Listings List Price Sale Price
6,367 6,349 158,218
152,288
3,416 146,097
2,760 139,828
-0.28% +23.77% +8.30% +8.91%
2011 2011
INVENTORY 2012 AVERAGE L/S% & DOM 2012
Active Inventory Monthly Supply of Inventory % of List to Sale Price Days on Market to Sale
34,852 11.28 95.85% 92.37
30,516 8.61 95.27% 92.29
-12.44% -23.67% +0.61% +0.10%
Reports produced and compiled by RE STATS Inc. Information is deemed reliable but not guaranteed. Does not reflect all market activity. pp. 10
Steve Reese 405-848-9944 steve@oklahomarealtors.com