November 2014 Multi-family Housing Activity Report – Boston, MA Real Estate
•
1 like•300 views

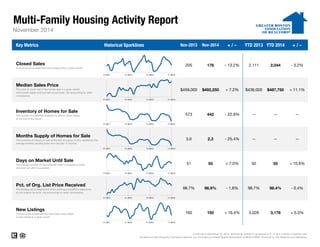
The document is a multi-family housing activity report that provides key metrics and historical data for 2-, 3-, and 4-family properties. It shows that in November 2014 compared to the previous year, median sales prices increased slightly, closed sales decreased, inventory decreased substantially, and days on market increased slightly. Overall multi-family housing market activity was down compared to the previous year.

Recommended
Recommended
More Related Content
What's hot
What's hot (20)
Similar to November 2014 Multi-family Housing Activity Report – Boston, MA Real Estate
Similar to November 2014 Multi-family Housing Activity Report – Boston, MA Real Estate (12)
More from Unit Realty Group
More from Unit Realty Group (20)
Recently uploaded
Recently uploaded (20)
November 2014 Multi-family Housing Activity Report – Boston, MA Real Estate
- 1. Multi-Family Housing Activity Report Key Metrics Historical Sparklines Nov-2013 Nov-2014 + / – YTD 2013 YTD 2014 + / – 2,044 - 3.2% Median Sales Price The point at which half of the homes sold in a given month were priced higher and one half priced lower, not accounting for seller concessions. $459,000 2,111 November 2014 Closed Sales A count of actual sales that have closed within a given month. 205 178 - 13.2% -- $492,250 + 7.2% $439,000 $487,750 + 11.1% -- -- --- 25.4% Inventory of Homes for Sale The number of properties available for sale in active status at the end of the month. 573 442 - 22.9% -- Days on Market Until Sale The average number of days between when a property is listed and when an offer is accepted. 51 55 + 7.0% 50 55 98.4% Current as of December 16, 2014. Multi-family activity is comprised of 2-, 3- and 4-family properties only. All data from MLS Property Information Network, Inc. Provided by Greater Boston Association of REALTORS®. Powered by 10K Research and Marketing. -- - 0.4% New Listings A count of the properties that have been newly listed on the market in a given month. 165 192 + 16.4% 3,026 3,178 + 5.0% + 10.6% Months Supply of Homes for Sale The inventory of homes for sale at the end of a given month, divided by the average monthly pending sales from the last 12 months. 3.0 2.3 Pct. of Org. List Price Received The average percentage found when dividing a property's sales price by the original list price, not accounting for seller concessions. 98.7% 96.9% - 1.8% 98.7% 11-2011 11-2012 11-2013 11-2014 11-2011 11-2012 11-2013 11-2014 11-2011 11-2012 11-2013 11-2014 11-2011 11-2012 11-2013 11-2014 11-2011 11-2012 11-2013 11-2014 11-2011 11-2012 11-2013 11-2014 11-2011 11-2012 11-2013 11-2014
- 2. All data from MLS Property Information Network, Inc. Provided by Greater Boston Association of REALTORS®. Powered by 10K Research and Marketing. Multi-Family Housing Activity Report – 2-Family Properties 11-2013 11-2014 + / – 11-2013 11-2014 + / – 11-2013 11-2014 + / – 11-2013 11-2014 + / – Acton 0 0 -- $0 $0 -- 0 0 -- 0 1 -- Arlington 2 4 + 100.0% $935,600 $687,500 - 26.5% 5 19 + 270.0% 4 1 - 75.0% Ashland 1 1 0.0% $270,000 $309,395 + 14.6% 53 78 + 47.2% 1 1 0.0% Attleboro 3 2 - 33.3% $190,500 $289,950 + 52.2% 58 28 - 51.4% 10 6 - 40.0% Bedford 0 0 -- $0 $0 -- 0 0 -- 0 0 -- Bellingham 1 0 - 100.0% $255,000 $0 - 100.0% 18 0 - 100.0% 1 2 + 100.0% Belmont 4 3 - 25.0% $732,500 $746,000 + 1.8% 30 46 + 57.1% 6 4 - 33.3% Boston 35 24 - 31.4% $476,000 $506,250 + 6.4% 52 52 + 1.1% 99 85 - 14.1% Boxborough 0 0 -- $0 $0 -- 0 0 -- 0 0 -- Brookline 0 0 -- $0 $0 -- 0 0 -- 4 0 - 100.0% Burlington 0 0 -- $0 $0 -- 0 0 -- 0 0 -- Cambridge 3 7 + 133.3% $685,000 $1,060,000 + 54.7% 53 32 - 39.8% 7 6 - 14.3% Canton 0 0 -- $0 $0 -- 0 0 -- 1 3 + 200.0% Carlisle 0 0 -- $0 $0 -- 0 0 -- 0 0 -- Chelsea 2 5 + 150.0% $330,000 $360,000 + 9.1% 21 26 + 24.8% 9 4 - 55.6% Concord 0 0 -- $0 $0 -- 0 0 -- 1 2 + 100.0% Dedham 2 0 - 100.0% $361,250 $0 - 100.0% 15 0 - 100.0% 3 3 0.0% Dover 0 0 -- $0 $0 -- 0 0 -- 0 0 -- Everett 6 8 + 33.3% $334,500 $371,000 + 10.9% 32 43 + 35.8% 22 10 - 54.5% Foxborough 0 1 -- $0 $337,400 -- 0 3 -- 4 2 - 50.0% Framingham 2 3 + 50.0% $295,000 $294,000 - 0.3% 60 109 + 81.7% 4 4 0.0% Franklin 1 4 + 300.0% $310,000 $251,350 - 18.9% 66 28 - 58.0% 2 2 0.0% Holliston 0 0 -- $0 $0 -- 0 0 -- 0 0 -- Hopkinton 0 0 -- $0 $0 -- 0 0 -- 0 0 -- Hudson 2 2 0.0% $265,000 $282,500 + 6.6% 79 71 - 10.8% 5 2 - 60.0% Lexington 0 0 -- $0 $0 -- 0 0 -- 0 0 -- Lincoln 0 0 -- $0 $0 -- 0 0 -- 0 0 -- Malden 6 5 - 16.7% $357,500 $476,500 + 33.3% 40 73 + 83.8% 24 13 - 45.8% Mansfield 1 0 - 100.0% $354,000 $0 - 100.0% 29 0 - 100.0% 2 2 0.0% Marlborough 3 0 - 100.0% $233,400 $0 - 100.0% 29 0 - 100.0% 12 6 - 50.0% Maynard 0 0 -- $0 $0 -- 0 0 -- 6 2 - 66.7% Medfield 0 0 -- $0 $0 -- 0 0 -- 0 0 -- Medford 11 4 - 63.6% $544,000 $594,500 + 9.3% 34 19 - 44.9% 10 5 - 50.0% Medway 0 1 -- $0 $230,000 -- 0 131 -- 1 1 0.0% Milford 1 1 0.0% $193,000 $233,000 + 20.7% 89 76 - 14.6% 6 4 - 33.3% Millis 0 0 -- $0 $0 -- 0 0 -- 0 1 -- Milton 2 1 - 50.0% $540,000 $570,000 + 5.6% 30 28 - 5.1% 5 2 - 60.0% Natick 2 3 + 50.0% $396,250 $395,000 - 0.3% 35 78 + 122.9% 8 3 - 62.5% Needham 0 0 -- $0 $0 -- 0 0 -- 1 1 0.0% Newton 3 5 + 66.7% $670,000 $800,000 + 19.4% 53 56 + 4.9% 10 9 - 10.0% November 2014 InventoryClosed Sales Days on MarketMedian Sales Price
- 3. All data from MLS Property Information Network, Inc. Provided by Greater Boston Association of REALTORS®. Powered by 10K Research and Marketing. Multi-Family Housing Activity Report – 2-Family Properties (cont.) 11-2013 11-2014 + / – 11-2013 11-2014 + / – 11-2013 11-2014 + / – 11-2013 11-2014 + / – Norfolk 0 0 -- $0 $0 -- 0 0 -- 1 1 0.0% North Attleboro 2 1 - 50.0% $186,500 $275,000 + 47.5% 175 128 - 26.6% 3 3 0.0% Norwood 1 4 + 300.0% $312,000 $372,250 + 19.3% 72 62 - 14.2% 0 2 -- Plainville 1 0 - 100.0% $215,000 $0 - 100.0% 1 0 - 100.0% 1 4 + 300.0% Quincy 8 9 + 12.5% $472,500 $455,000 - 3.7% 54 55 + 2.8% 15 17 + 13.3% Revere 8 8 0.0% $401,000 $416,000 + 3.7% 24 51 + 110.8% 27 16 - 40.7% Saugus 3 1 - 66.7% $392,000 $280,000 - 28.6% 36 12 - 66.4% 6 2 - 66.7% Sharon 0 1 -- $0 $385,000 -- 0 70 -- 2 2 0.0% Sherborn 0 0 -- $0 $0 -- 0 0 -- 0 0 -- Somerville 7 4 - 42.9% $630,000 $815,000 + 29.4% 66 28 - 57.7% 14 8 - 42.9% Southborough 0 0 -- $0 $0 -- 0 0 -- 0 0 -- Stow 0 0 -- $0 $0 -- 0 0 -- 0 0 -- Sudbury 0 0 -- $0 $0 -- 0 0 -- 0 0 -- Walpole 2 0 - 100.0% $506,500 $0 - 100.0% 102 0 - 100.0% 1 3 + 200.0% Waltham 0 3 -- $0 $425,000 -- 0 15 -- 2 2 0.0% Watertown 9 7 - 22.2% $570,000 $650,000 + 14.0% 40 25 - 38.2% 4 3 - 25.0% Wayland 0 0 -- $0 $0 -- 0 0 -- 0 0 -- Wellesley 0 1 -- $0 $750,000 -- 0 36 -- 2 0 - 100.0% Weston 0 0 -- $0 $0 -- 0 0 -- 0 1 -- Westwood 0 0 -- $0 $0 -- 0 0 -- 1 1 0.0% Winchester 1 2 + 100.0% $500,000 $632,500 + 26.5% 56 95 + 68.8% 1 1 0.0% Winthrop 2 1 - 50.0% $371,250 $551,500 + 48.6% 46 83 + 80.4% 9 14 + 55.6% Woburn 2 1 - 50.0% $392,500 $385,000 - 1.9% 29 35 + 22.8% 4 7 + 75.0% Wrentham 0 0 -- $0 $0 -- 0 0 -- 0 2 -- Greater Boston 139 127 -8.6% $435,000 $460,750 +5.9% 46 48 +3.7% 361 276 -23.5% Note: The "Greater Boston" figures are not a compilation or total of the individual areas. Days on Market Inventory November 2014 Closed Sales Median Sales Price
- 4. All data from MLS Property Information Network, Inc. Provided by Greater Boston Association of REALTORS®. Powered by 10K Research and Marketing. Multi-Family Housing Activity Report – 3-Family Properties 11-2013 11-2014 + / – 11-2013 11-2014 + / – 11-2013 11-2014 + / – 11-2013 11-2014 + / – Acton 0 0 -- $0 $0 -- 0 0 -- 0 0 -- Arlington 0 0 -- $0 $0 -- 0 0 -- 0 1 -- Ashland 0 0 -- $0 $0 -- 0 0 -- 0 1 -- Attleboro 1 1 0.0% $250,000 $354,000 + 41.6% 35 89 + 154.3% 5 7 + 40.0% Bedford 0 0 -- $0 $0 -- 0 0 -- 1 0 - 100.0% Bellingham 0 0 -- $0 $0 -- 0 0 -- 0 0 -- Belmont 0 0 -- $0 $0 -- 0 0 -- 0 0 -- Boston 32 23 - 28.1% $456,500 $599,900 + 31.4% 86 64 - 25.9% 99 77 - 22.2% Boxborough 0 0 -- $0 $0 -- 0 0 -- 0 0 -- Brookline 0 0 -- $0 $0 -- 0 0 -- 2 0 - 100.0% Burlington 0 0 -- $0 $0 -- 0 0 -- 0 0 -- Cambridge 2 3 + 50.0% $1,275,000 $1,185,000 - 7.1% 77 49 - 35.9% 3 3 0.0% Canton 0 0 -- $0 $0 -- 0 0 -- 1 0 - 100.0% Carlisle 0 0 -- $0 $0 -- 0 0 -- 0 0 -- Chelsea 2 1 - 50.0% $413,250 $435,000 + 5.3% 23 22 - 2.2% 8 8 0.0% Concord 0 0 -- $0 $0 -- 0 0 -- 0 0 -- Dedham 0 0 -- $0 $0 -- 0 0 -- 0 0 -- Dover 0 0 -- $0 $0 -- 0 0 -- 0 0 -- Everett 1 0 - 100.0% $465,000 $0 - 100.0% 12 0 - 100.0% 7 6 - 14.3% Foxborough 0 0 -- $0 $0 -- 0 0 -- 0 1 -- Framingham 0 1 -- $0 $0 -- 0 17 -- 2 3 + 50.0% Franklin 0 0 -- $0 $0 -- 0 0 -- 0 2 -- Holliston 0 0 -- $0 $0 -- 0 0 -- 0 0 -- Hopkinton 0 0 -- $0 $0 -- 0 0 -- 0 0 -- Hudson 0 0 -- $0 $0 -- 0 0 -- 2 3 + 50.0% Lexington 0 0 -- $0 $0 -- 0 0 -- 1 0 - 100.0% Lincoln 0 0 -- $0 $0 -- 0 0 -- 0 0 -- Malden 2 0 - 100.0% $406,000 $0 - 100.0% 77 0 - 100.0% 4 3 - 25.0% Mansfield 1 0 - 100.0% $360,000 $0 - 100.0% 27 0 - 100.0% 1 0 - 100.0% Marlborough 1 1 0.0% $255,000 $411,000 + 61.2% 125 18 - 85.6% 5 1 - 80.0% Maynard 0 0 -- $0 $0 -- 0 0 -- 0 0 -- Medfield 0 0 -- $0 $0 -- 0 0 -- 0 0 -- Medford 1 3 + 200.0% $535,000 $638,000 + 19.3% 13 38 + 189.7% 2 1 - 50.0% Medway 0 0 -- $0 $0 -- 0 0 -- 0 0 -- Milford 0 0 -- $0 $0 -- 0 0 -- 2 1 - 50.0% Millis 0 0 -- $0 $0 -- 0 0 -- 0 0 -- Milton 0 0 -- $0 $0 -- 0 0 -- 1 1 0.0% Natick 0 0 -- $0 $0 -- 0 0 -- 0 0 -- Needham 0 0 -- $0 $0 -- 0 0 -- 0 0 -- Newton 0 0 -- $0 $0 -- 0 0 -- 0 0 -- November 2014 Closed Sales Median Sales Price Days on Market Inventory
- 5. All data from MLS Property Information Network, Inc. Provided by Greater Boston Association of REALTORS®. Powered by 10K Research and Marketing. Multi-Family Housing Activity Report – 3-Family Properties (cont.) 11-2013 11-2014 + / – 11-2013 11-2014 + / – 11-2013 11-2014 + / – 11-2013 11-2014 + / – Norfolk 0 0 -- $0 $0 -- 0 0 -- 0 1 -- North Attleboro 0 2 -- $0 $293,750 -- 0 342 -- 5 5 0.0% Norwood 0 0 -- $0 $0 -- 0 0 -- 1 1 0.0% Plainville 0 0 -- $0 $0 -- 0 0 -- 0 1 -- Quincy 2 1 -50.0% $531,250 $520,000 -2.1% 102 106 +4.4% 3 5 +66.7% Revere 0 0 -- $0 $0 -- 0 0 -- 4 2 -50.0% Saugus 0 0 -- $0 $0 -- 0 0 -- 1 0 -100.0% Sharon 0 0 -- $0 $0 -- 0 0 -- 0 0 -- Sherborn 0 0 -- $0 $0 -- 0 0 -- 0 0 -- Somerville 4 6 +50.0% $640,000 $880,000 +37.5% 18 52 +189.8% 4 3 -25.0% Southborough 0 0 -- $0 $0 -- 0 0 -- 0 0 -- Stow 0 0 -- $0 $0 -- 0 0 -- 0 0 -- Sudbury 0 0 -- $0 $0 -- 0 0 -- 0 0 -- Walpole 0 0 -- $0 $0 -- 0 0 -- 2 0 -100.0% Waltham 0 0 -- $0 $0 -- 0 0 -- 2 2 0.0% Watertown 0 1 -- $0 $575,000 -- 0 182 -- 1 0 -100.0% Wayland 0 0 -- $0 $0 -- 0 0 -- 0 0 -- Wellesley 1 0 -100.0% $1,395,000 $0 -100.0% 4 0 -100.0% 0 0 -- Weston 0 0 -- $0 $0 -- 0 0 -- 0 0 -- Westwood 0 0 -- $0 $0 -- 0 0 -- 0 0 -- Winchester 0 0 -- $0 $0 -- 0 0 -- 0 0 -- Winthrop 2 2 0.0% $529,950 $414,950 -21.7% 20 108 +437.5% 3 2 -33.3% Woburn 0 0 -- $0 $0 -- 0 0 -- 0 0 -- Wrentham 0 0 -- $0 $0 -- 0 0 -- 0 0 -- Greater Boston 52 45 -13.5% $482,000 $589,450 +22.3% 70 75 +7.1% 172 141 -18.0% Note: The "Greater Boston" figures are not a compilation or total of the individual areas. Closed Sales Median Sales Price Days on Market Inventory November 2014
- 6. All data from MLS Property Information Network, Inc. Provided by Greater Boston Association of REALTORS®. Powered by 10K Research and Marketing. Multi-Family Housing Activity Report – 4-Family Properties 11-2013 11-2014 + / – 11-2013 11-2014 + / – 11-2013 11-2014 + / – 11-2013 11-2014 + / – Acton 0 0 -- $0 $0 -- 0 0 -- 0 0 -- Arlington 0 0 -- $0 $0 -- 0 0 -- 0 0 -- Ashland 0 0 -- $0 $0 -- 0 0 -- 0 1 -- Attleboro 1 0 - 100.0% $381,000 $0 - 100.0% 8 0 - 100.0% 2 1 - 50.0% Bedford 0 0 -- $0 $0 -- 0 0 -- 0 0 -- Bellingham 0 0 -- $0 $0 -- 0 0 -- 0 1 -- Belmont 0 0 -- $0 $0 -- 0 0 -- 0 0 -- Boston 5 1 - 80.0% $1,200,000 $1,075,000 - 10.4% 29 60 + 104.1% 11 7 - 36.4% Boxborough 0 0 -- $0 $0 -- 0 0 -- 0 0 -- Brookline 0 0 -- $0 $0 -- 0 0 -- 0 1 -- Burlington 0 0 -- $0 $0 -- 0 0 -- 0 0 -- Cambridge 0 1 -- $0 $2,935,000 -- 0 8 -- 0 0 -- Canton 0 0 -- $0 $0 -- 0 0 -- 0 0 -- Carlisle 0 0 -- $0 $0 -- 0 0 -- 0 0 -- Chelsea 0 0 -- $0 $0 -- 0 0 -- 6 1 - 83.3% Concord 0 0 -- $0 $0 -- 0 0 -- 0 0 -- Dedham 0 0 -- $0 $0 -- 0 0 -- 0 0 -- Dover 0 0 -- $0 $0 -- 0 0 -- 0 0 -- Everett 0 0 -- $0 $0 -- 0 0 -- 2 3 + 50.0% Foxborough 0 0 -- $0 $0 -- 0 0 -- 0 0 -- Framingham 1 1 0.0% $383,000 $375,000 - 2.1% 6 100 + 1,566.7% 0 2 -- Franklin 0 0 -- $0 $0 -- 0 0 -- 1 0 - 100.0% Holliston 0 0 -- $0 $0 -- 0 0 -- 0 0 -- Hopkinton 0 0 -- $0 $0 -- 0 0 -- 0 0 -- Hudson 0 0 -- $0 $0 -- 0 0 -- 0 0 -- Lexington 0 0 -- $0 $0 -- 0 0 -- 0 0 -- Lincoln 0 0 -- $0 $0 -- 0 0 -- 0 0 -- Malden 0 0 -- $0 $0 -- 0 0 -- 0 0 -- Mansfield 0 0 -- $0 $0 -- 0 0 -- 0 0 -- Marlborough 1 1 0.0% $202,500 $310,000 + 53.1% 66 17 - 74.2% 1 0 - 100.0% Maynard 0 0 -- $0 $0 -- 0 0 -- 0 0 -- Medfield 0 0 -- $0 $0 -- 0 0 -- 1 0 - 100.0% Medford 0 0 -- $0 $0 -- 0 0 -- 0 0 -- Medway 0 0 -- $0 $0 -- 0 0 -- 0 0 -- Milford 0 0 -- $0 $0 -- 0 0 -- 0 0 -- Millis 0 0 -- $0 $0 -- 0 0 -- 0 0 -- Milton 0 0 -- $0 $0 -- 0 0 -- 0 0 -- Natick 0 0 -- $0 $0 -- 0 0 -- 0 0 -- Needham 0 0 -- $0 $0 -- 0 0 -- 0 0 -- Newton 0 0 -- $0 $0 -- 0 0 -- 1 0 - 100.0% November 2014 Closed Sales Median Sales Price Days on Market Inventory
- 7. All data from MLS Property Information Network, Inc. Provided by Greater Boston Association of REALTORS®. Powered by 10K Research and Marketing. Multi-Family Housing Activity Report – 4-Family Properties (cont.) 11-2013 11-2014 + / – 11-2013 11-2014 + / – 11-2013 11-2014 + / – 11-2013 11-2014 + / – Norfolk 0 0 -- $0 $0 -- 0 0 -- 0 0 -- North Attleboro 0 0 -- $0 $0 -- 0 0 -- 2 0 -100.0% Norwood 0 0 -- $0 $0 -- 0 0 -- 1 0 -100.0% Plainville 0 0 -- $0 $0 -- 0 0 -- 0 0 -- Quincy 4 1 -75.0% $530,250 $650,000 +22.6% 17 63 +281.8% 3 1 -66.7% Revere 1 0 -100.0% $451,000 $0 -100.0% 132 0 -100.0% 2 3 +50.0% Saugus 0 0 -- $0 $0 -- 0 0 -- 0 0 -- Sharon 0 0 -- $0 $0 -- 0 0 -- 0 0 -- Sherborn 0 0 -- $0 $0 -- 0 0 -- 0 0 -- Somerville 0 0 -- $0 $0 -- 0 0 -- 1 1 0.0% Southborough 0 0 -- $0 $0 -- 0 0 -- 0 0 -- Stow 0 0 -- $0 $0 -- 0 0 -- 0 0 -- Sudbury 0 0 -- $0 $0 -- 0 0 -- 0 0 -- Walpole 1 0 -100.0% $400,000 $0 -100.0% 5 0 -100.0% 0 0 -- Waltham 0 0 -- $0 $0 -- 0 0 -- 5 2 -60.0% Watertown 0 0 -- $0 $0 -- 0 0 -- 1 0 -100.0% Wayland 0 0 -- $0 $0 -- 0 0 -- 0 0 -- Wellesley 0 0 -- $0 $0 -- 0 0 -- 0 0 -- Weston 0 0 -- $0 $0 -- 0 0 -- 0 0 -- Westwood 0 0 -- $0 $0 -- 0 0 -- 0 0 -- Winchester 0 0 -- $0 $0 -- 0 0 -- 0 0 -- Winthrop 0 1 -- $0 $417,500 -- 0 40 -- 0 1 -- Woburn 0 0 -- $0 $0 -- 0 0 -- 0 0 -- Wrentham 0 0 -- $0 $0 -- 0 0 -- 0 0 -- Greater Boston 14 6 -57.1% $519,750 $533,750 +2.7% 31 48 +56.3% 40 25 -37.5% Note: The "Greater Boston" figures are not a compilation or total of the individual areas. Closed Sales Median Sales Price Days on Market Inventory November 2014