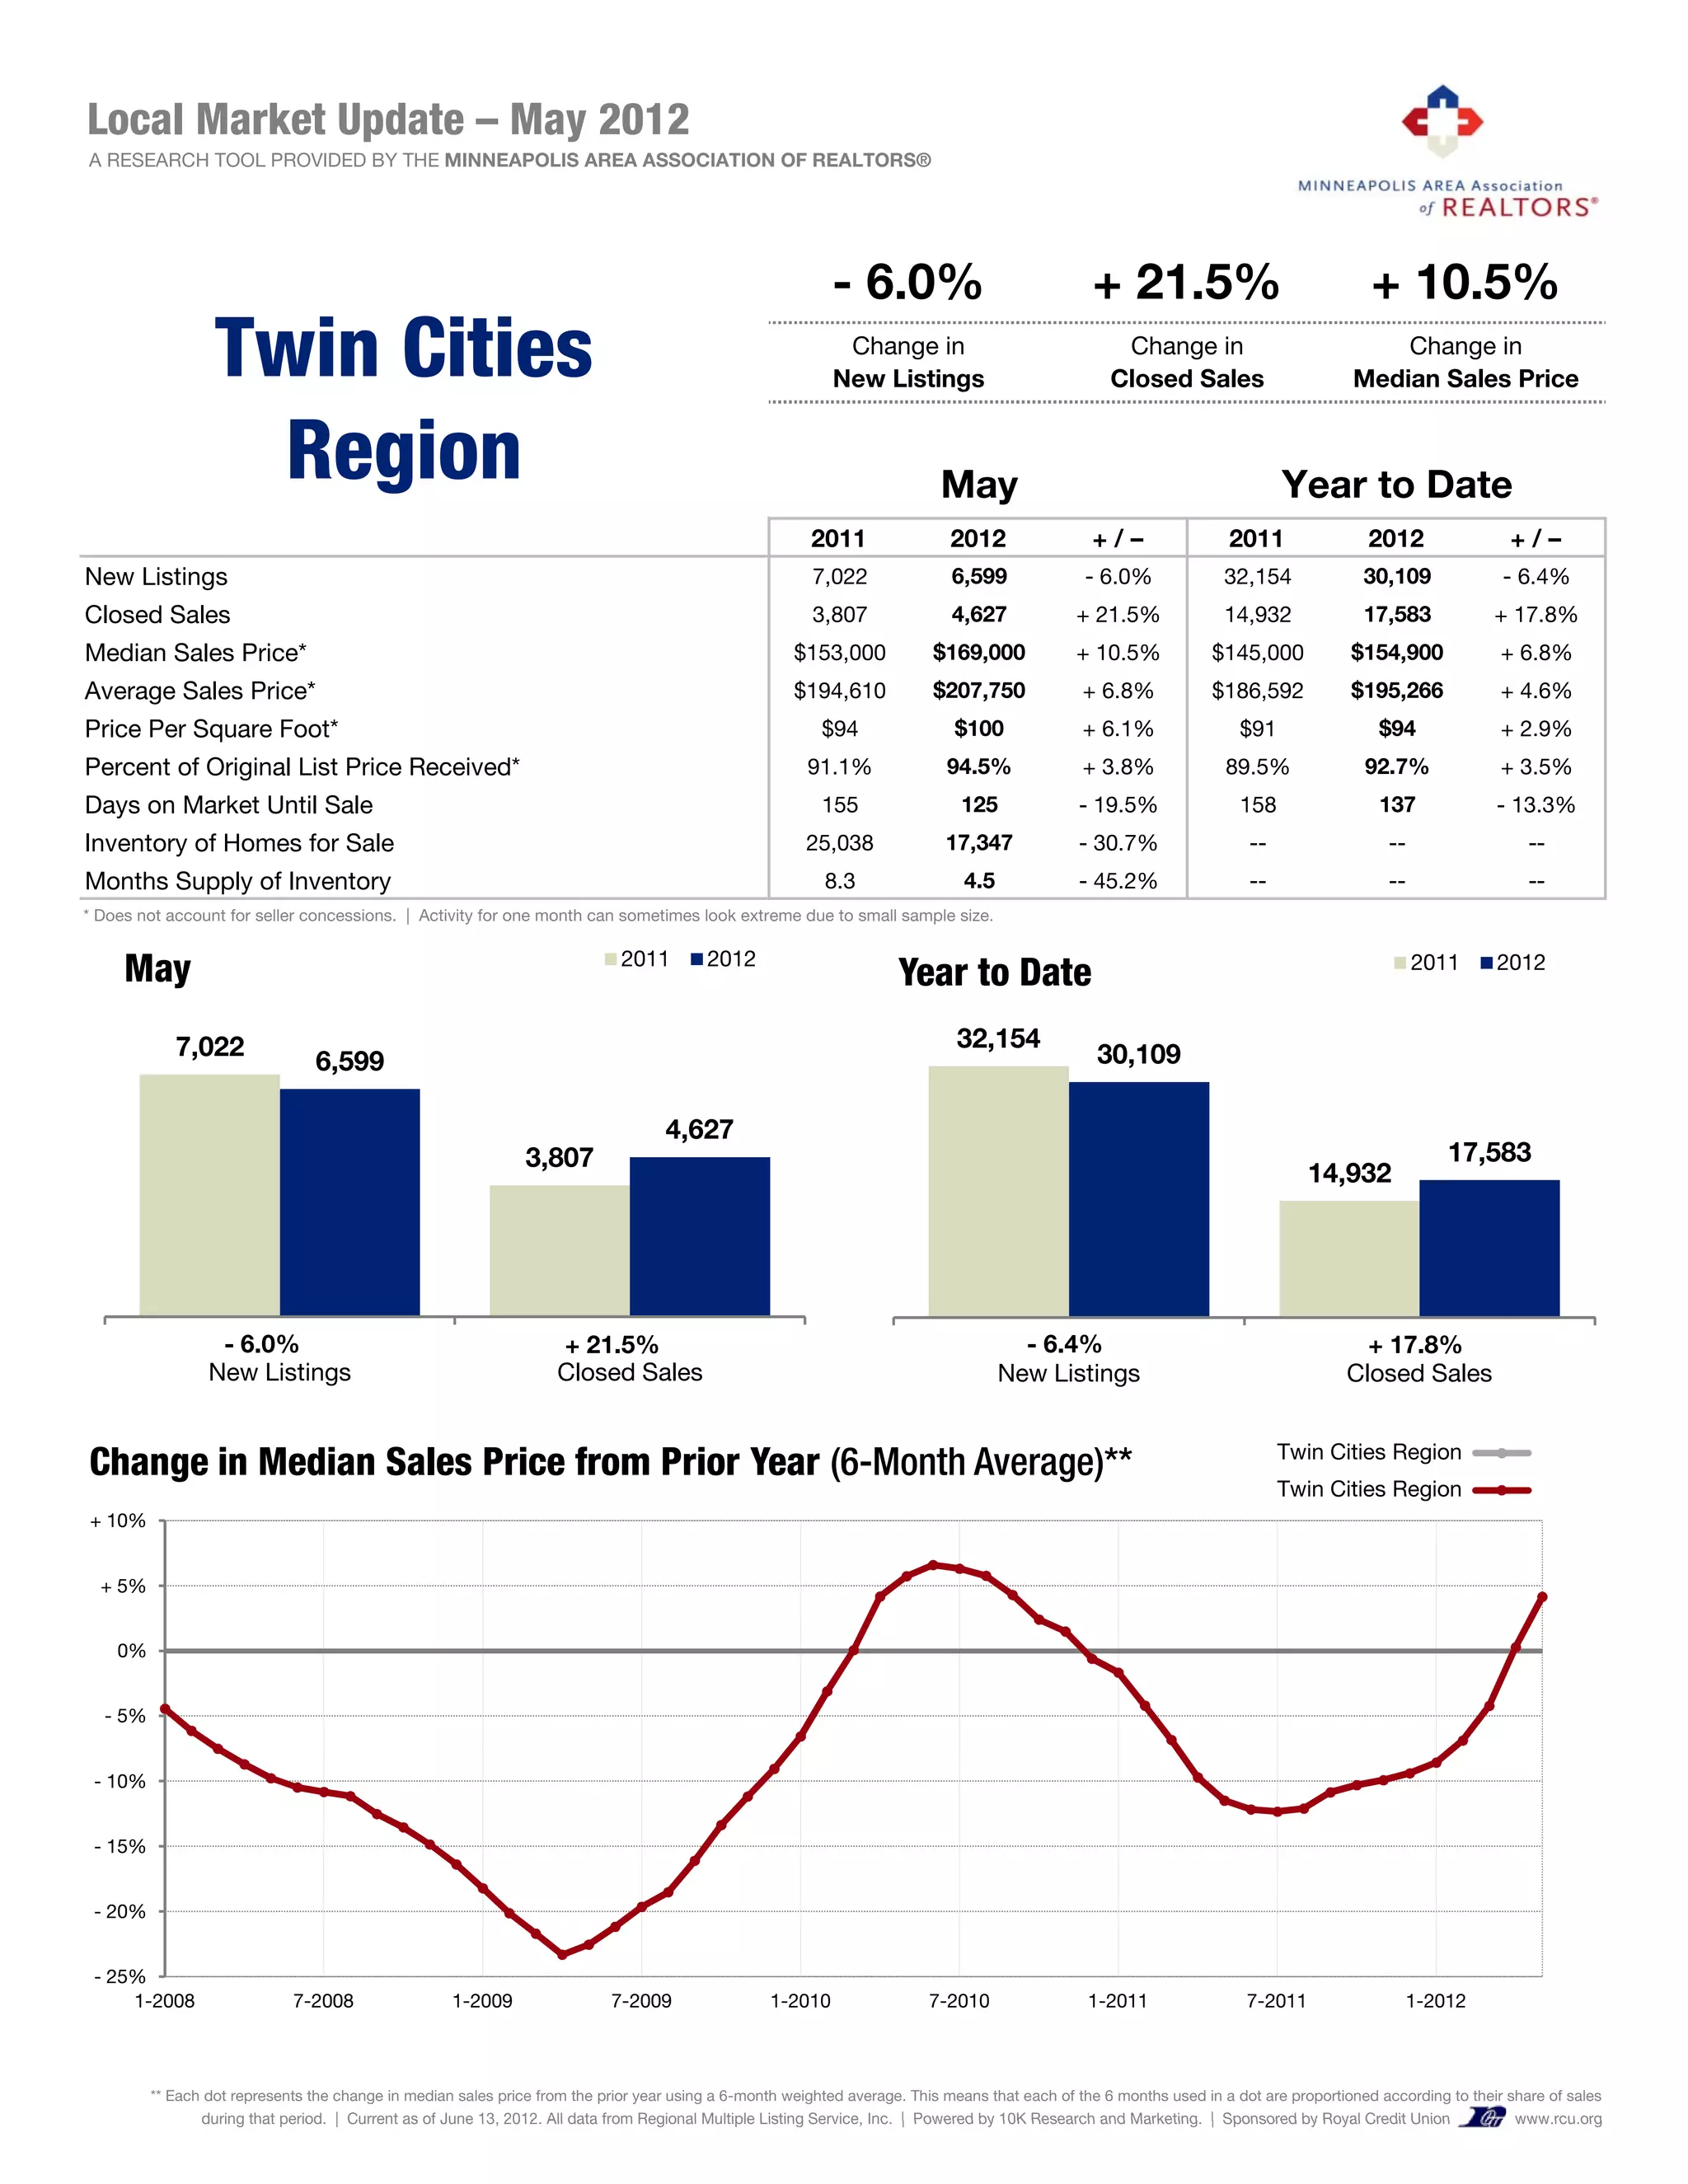
Local Market Update – May 2012
A RESEARCH TOOL PROVIDED BY THE MINNEAPOLIS AREA ASSOCIATION OF REALTORS®


                                                                                                            - 6.0%                               + 21.5%                                  + 10.5%
                  Twin Cities                                                                                Change in
                                                                                                            New Listings
                                                                                                                                                     Change in
                                                                                                                                                    Closed Sales
                                                                                                                                                                                           Change in
                                                                                                                                                                                       Median Sales Price


                    Region                                                                                                 May                                               Year to Date
                                                                                                        2011                 2012                +/–                 2011                2012                 +/–
New Listings                                                                                             7,022               6,599              - 6.0%               32,154              30,109              - 6.4%
Closed Sales                                                                                             3,807               4,627             + 21.5%               14,932              17,583             + 17.8%
Median Sales Price*                                                                                   $153,000            $169,000             + 10.5%             $145,000            $154,900              + 6.8%
Average Sales Price*                                                                                  $194,610            $207,750              + 6.8%             $186,592            $195,266              + 4.6%
Price Per Square Foot*                                                                                    $94                $100               + 6.1%                 $91                 $94               + 2.9%
Percent of Original List Price Received*                                                                91.1%               94.5%               + 3.8%               89.5%               92.7%               + 3.5%
Days on Market Until Sale                                                                                 155                 125              - 19.5%                 158                 137              - 13.3%
Inventory of Homes for Sale                                                                             25,038              17,347             - 30.7%                  --                  --                   --
Months Supply of Inventory                                                                                8.3                  4.5             - 45.2%                  --                  --                   --
* Does not account for seller concessions. | Activity for one month can sometimes look extreme due to small sample size.

                                                                             2011        2012
     May                                                                                                             Year to Date                                                                2011       2012


            7,022                                                                                                             32,154
                                6,599                                                                                                             30,109

                                                                                   4,627
                                                               3,807                                                                                                                                 17,583
                                                                                                                                                                                 14,932


                  - 6.0%                                            + 21.5%                                                            - 6.4%                                           + 17.8%
                 New Listings                                       Closed Sales                                                     New Listings                                     Closed Sales


                                                                                                                                                                             Twin Cities Region                   b
Change in Median Sales Price from Prior Year (6-Month Average)**
                                                                                                                                                                             Twin Cities Region                   a
+ 10%


  + 5%


    0%


  - 5%


 - 10%


 - 15%


 - 20%


 - 25%
     1-2008                  7-2008                 1-2009                 7-2009                  1-2010                 7-2010                 1-2011                 7-2011                 1-2012


         ** Each dot represents the change in median sales price from the prior year using a 6-month weighted average. This means that each of the 6 months used in a dot are proportioned according to their share of sales
                during that period | Current as of June 13 2012 All data from Regional Multiple Listing Service Inc | Powered by 10K Research and Marketing | Sponsored by Royal Credit Union
                            period.                     13, 2012.                                       Service, Inc.                                 Marketing.                                               www rcu org
                                                                                                                                                                                                               www.rcu.org

Twin cities market update june 2012

  • 1.
    Local Market Update– May 2012 A RESEARCH TOOL PROVIDED BY THE MINNEAPOLIS AREA ASSOCIATION OF REALTORS® - 6.0% + 21.5% + 10.5% Twin Cities Change in New Listings Change in Closed Sales Change in Median Sales Price Region May Year to Date 2011 2012 +/– 2011 2012 +/– New Listings 7,022 6,599 - 6.0% 32,154 30,109 - 6.4% Closed Sales 3,807 4,627 + 21.5% 14,932 17,583 + 17.8% Median Sales Price* $153,000 $169,000 + 10.5% $145,000 $154,900 + 6.8% Average Sales Price* $194,610 $207,750 + 6.8% $186,592 $195,266 + 4.6% Price Per Square Foot* $94 $100 + 6.1% $91 $94 + 2.9% Percent of Original List Price Received* 91.1% 94.5% + 3.8% 89.5% 92.7% + 3.5% Days on Market Until Sale 155 125 - 19.5% 158 137 - 13.3% Inventory of Homes for Sale 25,038 17,347 - 30.7% -- -- -- Months Supply of Inventory 8.3 4.5 - 45.2% -- -- -- * Does not account for seller concessions. | Activity for one month can sometimes look extreme due to small sample size. 2011 2012 May Year to Date 2011 2012 7,022 32,154 6,599 30,109 4,627 3,807 17,583 14,932 - 6.0% + 21.5% - 6.4% + 17.8% New Listings Closed Sales New Listings Closed Sales Twin Cities Region b Change in Median Sales Price from Prior Year (6-Month Average)** Twin Cities Region a + 10% + 5% 0% - 5% - 10% - 15% - 20% - 25% 1-2008 7-2008 1-2009 7-2009 1-2010 7-2010 1-2011 7-2011 1-2012 ** Each dot represents the change in median sales price from the prior year using a 6-month weighted average. This means that each of the 6 months used in a dot are proportioned according to their share of sales during that period | Current as of June 13 2012 All data from Regional Multiple Listing Service Inc | Powered by 10K Research and Marketing | Sponsored by Royal Credit Union period. 13, 2012. Service, Inc. Marketing. www rcu org www.rcu.org