SlideShare a Scribd company logo
Multi-Family Housing Activity Report
Key Metrics Historical Sparklines Jul-2012 Jul-2013 + / – YTD 2012 YTD 2013 + / –
1,232 - 1.0%
Median Sales Price
The point at which half of the homes sold in a given month
were priced higher and one half priced lower, not accounting for seller
concessions.
$399,950
1,244
July 2013
Closed Sales
A count of actual sales that have closed within a given month.
206 236 + 14.6%
--
$450,000 + 12.5% $365,000 $428,000 + 17.3%
--
-- --- 43.1%
Inventory of Homes for Sale
The number of properties available for sale in active status
at the end of the month.
804 500 - 37.8% --
Days on Market Until Sale
The average number of days between when a property is listed
and when an offer is accepted.
61 31 - 49.7% 74 54
98.5%
Current as of August 20, 2013. Multi-family activity is comprised of 2-, 3- and 4-family properties only.
All data from MLS Property Information Network, Inc. Provided by Greater Boston Association of REALTORS®. Powered by 10K Research and Marketing.
--
+ 3.7%
New Listings
A count of the properties that have been newly listed
on the market in a given month.
239 280 + 17.2% 2,022 2,043 + 1.0%
- 27.1%
Months Supply of Homes for Sale
The inventory of homes for sale at the end of a given month, divided by the
average monthly pending sales from the last 12 months.
4.3 2.5
Pct. of Org. List Price Received
The average percentage found when dividing a property's sales price
by the original list price, not accounting for seller concessions.
97.0% 99.9% + 2.9% 95.0%
7-2010 7-2011 7-2012 7-2013
7-2010 7-2011 7-2012 7-2013
7-2010 7-2011 7-2012 7-2013
7-2010 7-2011 7-2012 7-2013
7-2010 7-2011 7-2012 7-2013
7-2010 7-2011 7-2012 7-2013
7-2010 7-2011 7-2012 7-2013
5B5B
All data from MLS Property Information Network, Inc. Provided by Greater Boston Association of REALTORS®. Powered by 10K Research and Marketing.
Multi-Family Housing Activity Report – 2-Family Properties
7-2012 7-2013 + / – 7-2012 7-2013 + / – 7-2012 7-2013 + / – 7-2012 7-2013 + / –
Acton 0 0 -- $0 $0 -- 0 0 -- 1 1 0.0%
Arlington 5 10 + 100.0% $495,000 $611,000 + 23.4% 64 14 - 77.4% 7 2 - 71.4%
Ashland 0 0 -- $0 $0 -- 0 0 -- 3 0 - 100.0%
Attleboro 0 2 -- $0 $201,250 -- 0 71 -- 19 13 - 31.6%
Bedford 0 0 -- $0 $0 -- 0 0 -- 1 0 - 100.0%
Bellingham 0 1 -- $0 $170,000 -- 0 295 -- 3 2 - 33.3%
Belmont 3 1 - 66.7% $600,100 $710,000 + 18.3% 91 5 - 94.5% 3 5 + 66.7%
Boston 34 36 + 5.9% $443,000 $457,500 + 3.3% 65 25 - 61.5% 126 62 - 50.8%
Boxborough 0 0 -- $0 $0 -- 0 0 -- 0 0 --
Brookline 3 3 0.0% $827,000 $1,407,000 + 70.1% 59 5 - 91.5% 8 7 - 12.5%
Burlington 0 0 -- $0 $0 -- 0 0 -- 1 0 - 100.0%
Cambridge 4 3 - 25.0% $680,270 $1,030,000 + 51.4% 18 6 - 64.8% 11 10 - 9.1%
Canton 0 0 -- $0 $0 -- 0 0 -- 0 4 --
Carlisle 0 0 -- $0 $0 -- 0 0 -- 1 0 - 100.0%
Chelsea 4 4 0.0% $240,000 $365,000 + 52.1% 71 19 - 72.8% 18 10 - 44.4%
Concord 0 0 -- $0 $0 -- 0 0 -- 2 3 + 50.0%
Dedham 0 3 -- $0 $395,000 -- 0 14 -- 9 6 - 33.3%
Dover 0 0 -- $0 $0 -- 0 0 -- 1 0 - 100.0%
Everett 8 8 0.0% $301,500 $353,600 + 17.3% 51 41 - 19.5% 15 23 + 53.3%
Foxborough 0 0 -- $0 $0 -- 0 0 -- 1 1 0.0%
Framingham 1 2 + 100.0% $234,900 $276,000 + 17.5% 17 6 - 67.6% 8 5 - 37.5%
Franklin 1 2 + 100.0% $165,000 $212,500 + 28.8% 165 25 - 85.2% 5 3 - 40.0%
Holliston 0 0 -- $0 $0 -- 0 0 -- 1 1 0.0%
Hopkinton 0 0 -- $0 $0 -- 0 0 -- 1 1 0.0%
Hudson 1 0 - 100.0% $215,000 $0 - 100.0% 11 0 - 100.0% 7 5 - 28.6%
Lexington 1 0 - 100.0% $627,000 $0 - 100.0% 18 0 - 100.0% 1 2 + 100.0%
Lincoln 0 0 -- $0 $0 -- 0 0 -- 2 0 - 100.0%
Malden 12 11 - 8.3% $287,900 $387,000 + 34.4% 41 13 - 69.4% 27 17 - 37.0%
Mansfield 0 0 -- $0 $0 -- 0 0 -- 1 3 + 200.0%
Marlborough 0 4 -- $0 $204,450 -- 0 51 -- 13 2 - 84.6%
Maynard 1 1 0.0% $73,000 $321,000 + 339.7% 33 59 + 78.8% 2 5 + 150.0%
Medfield 0 0 -- $0 $0 -- 0 0 -- 3 0 - 100.0%
Medford 10 11 + 10.0% $417,500 $525,000 + 25.7% 31 8 - 74.6% 18 12 - 33.3%
Medway 0 0 -- $0 $0 -- 0 0 -- 3 1 - 66.7%
Milford 2 0 - 100.0% $175,000 $0 - 100.0% 60 0 - 100.0% 13 7 - 46.2%
Millis 0 0 -- $0 $0 -- 0 0 -- 1 1 0.0%
Milton 2 1 - 50.0% $395,000 $410,000 + 3.8% 142 93 - 34.5% 11 2 - 81.8%
Natick 0 2 -- $0 $396,250 -- 0 12 -- 8 4 - 50.0%
Needham 1 1 0.0% $651,000 $335,000 - 48.5% 28 85 + 203.6% 3 2 - 33.3%
Newton 4 7 + 75.0% $767,500 $675,000 - 12.1% 86 22 - 73.8% 18 9 - 50.0%
July 2013
InventoryClosed Sales Days on MarketMedian Sales Price
All data from MLS Property Information Network, Inc. Provided by Greater Boston Association of REALTORS®. Powered by 10K Research and Marketing.
Multi-Family Housing Activity Report – 2-Family Properties (cont.)
7-2012 7-2013 + / – 7-2012 7-2013 + / – 7-2012 7-2013 + / – 7-2012 7-2013 + / –
Norfolk 0 0 -- $0 $0 -- 0 0 -- 1 1 0.0%
North Attleboro 0 0 -- $0 $0 -- 0 0 -- 10 6 - 40.0%
Norwood 1 2 + 100.0% $329,900 $358,000 + 8.5% 75 14 - 81.3% 6 6 0.0%
Plainville 0 0 -- $0 $0 -- 0 0 -- 3 0 - 100.0%
Quincy 9 9 0.0% $390,000 $445,000 + 14.1% 48 23 - 52.6% 30 20 - 33.3%
Revere 8 11 + 37.5% $317,500 $380,000 + 19.7% 85 20 - 76.9% 37 13 - 64.9%
Saugus 2 1 - 50.0% $376,750 $305,000 - 19.0% 32 41 + 30.2% 8 7 - 12.5%
Sharon 0 0 -- $0 $0 -- 0 0 -- 2 3 + 50.0%
Sherborn 0 0 -- $0 $0 -- 0 0 -- 1 0 - 100.0%
Somerville 7 16 + 128.6% $642,000 $723,500 + 12.7% 45 56 + 24.3% 29 12 - 58.6%
Southborough 0 0 -- $0 $0 -- 0 0 -- 0 3 --
Stow 0 0 -- $0 $0 -- 0 0 -- 2 0 - 100.0%
Sudbury 0 1 -- $0 $490,000 -- 0 278 -- 1 0 - 100.0%
Walpole 0 0 -- $0 $0 -- 0 0 -- 4 3 - 25.0%
Waltham 3 5 + 66.7% $459,000 $474,166 + 3.3% 34 37 + 8.9% 9 2 - 77.8%
Watertown 8 8 0.0% $505,500 $568,250 + 12.4% 32 16 - 50.0% 12 3 - 75.0%
Wayland 0 0 -- $0 $0 -- 0 0 -- 2 0 - 100.0%
Wellesley 0 1 -- $0 $585,000 -- 0 16 -- 2 1 - 50.0%
Weston 0 0 -- $0 $0 -- 0 0 -- 1 0 - 100.0%
Westwood 0 0 -- $0 $0 -- 0 0 -- 0 0 --
Winchester 2 1 - 50.0% $547,500 $585,000 + 6.8% 12 7 - 39.1% 7 4 - 42.9%
Winthrop 2 1 - 50.0% $287,500 $282,500 - 1.7% 71 39 - 45.1% 3 5 + 66.7%
Woburn 2 3 + 50.0% $330,000 $418,000 + 26.7% 101 5 - 94.7% 2 6 + 200.0%
Wrentham 0 0 -- $0 $0 -- 0 0 -- 0 1 --
Greater Boston 141 172 +22.0% $400,000 $460,000 +15.0% 56 29 -48.6% 545 327 -40.0%
Note: The "Greater Boston" figures are not a compilation or total of the individual areas.
Days on Market Inventory
July 2013
Closed Sales Median Sales Price
All data from MLS Property Information Network, Inc. Provided by Greater Boston Association of REALTORS®. Powered by 10K Research and Marketing.
Multi-Family Housing Activity Report – 3-Family Properties
7-2012 7-2013 + / – 7-2012 7-2013 + / – 7-2012 7-2013 + / – 7-2012 7-2013 + / –
Acton 0 0 -- $0 $0 -- 0 0 -- 0 0 --
Arlington 0 0 -- $0 $0 -- 0 0 -- 1 0 - 100.0%
Ashland 0 0 -- $0 $0 -- 0 0 -- 5 0 - 100.0%
Attleboro 0 1 -- $0 $230,000 -- 0 14 -- 13 4 - 69.2%
Bedford 0 0 -- $0 $0 -- 0 0 -- 0 0 --
Bellingham 0 0 -- $0 $0 -- 0 0 -- 0 1 --
Belmont 1 0 - 100.0% $789,000 $0 - 100.0% 18 0 - 100.0% 0 0 --
Boston 27 28 + 3.7% $395,000 $445,000 + 12.7% 54 25 - 54.3% 111 69 - 37.8%
Boxborough 0 0 -- $0 $0 -- 0 0 -- 0 0 --
Brookline 0 0 -- $0 $0 -- 0 0 -- 3 3 0.0%
Burlington 0 0 -- $0 $0 -- 0 0 -- 0 0 --
Cambridge 2 2 0.0% $875,000 $1,174,500 + 34.2% 57 9 - 84.1% 6 7 + 16.7%
Canton 0 0 -- $0 $0 -- 0 0 -- 0 1 --
Carlisle 0 0 -- $0 $0 -- 0 0 -- 0 0 --
Chelsea 4 8 + 100.0% $306,000 $297,500 - 2.8% 72 42 - 41.8% 15 6 - 60.0%
Concord 0 0 -- $0 $0 -- 0 0 -- 0 0 --
Dedham 0 0 -- $0 $0 -- 0 0 -- 0 0 --
Dover 0 0 -- $0 $0 -- 0 0 -- 0 0 --
Everett 3 4 + 33.3% $333,800 $412,750 + 23.7% 143 18 - 87.4% 16 7 - 56.3%
Foxborough 0 0 -- $0 $0 -- 0 0 -- 0 0 --
Framingham 1 0 - 100.0% $285,000 $0 - 100.0% 89 0 - 100.0% 2 2 0.0%
Franklin 0 0 -- $0 $0 -- 0 0 -- 3 0 - 100.0%
Holliston 0 0 -- $0 $0 -- 0 0 -- 1 1 0.0%
Hopkinton 0 0 -- $0 $0 -- 0 0 -- 1 1 0.0%
Hudson 0 0 -- $0 $0 -- 0 0 -- 4 2 - 50.0%
Lexington 0 0 -- $0 $0 -- 0 0 -- 0 1 --
Lincoln 0 1 -- $0 $108,500 -- 0 15 -- 0 0 --
Malden 5 3 - 40.0% $340,000 $440,000 + 29.4% 96 32 - 66.9% 3 6 + 100.0%
Mansfield 0 0 -- $0 $0 -- 0 0 -- 0 1 --
Marlborough 1 2 + 100.0% $165,000 $202,400 + 22.7% 40 5 - 87.5% 4 2 - 50.0%
Maynard 1 0 - 100.0% $248,625 $0 - 100.0% 374 0 - 100.0% 0 2 --
Medfield 0 0 -- $0 $0 -- 0 0 -- 0 0 --
Medford 2 0 - 100.0% $437,500 $0 - 100.0% 81 0 - 100.0% 3 3 0.0%
Medway 0 0 -- $0 $0 -- 0 0 -- 0 0 --
Milford 0 0 -- $0 $0 -- 0 0 -- 3 2 - 33.3%
Millis 0 0 -- $0 $0 -- 0 0 -- 0 0 --
Milton 0 0 -- $0 $0 -- 0 0 -- 1 2 + 100.0%
Natick 1 0 - 100.0% $480,000 $0 - 100.0% 25 0 - 100.0% 0 0 --
Needham 0 0 -- $0 $0 -- 0 0 -- 2 0 - 100.0%
Newton 0 0 -- $0 $0 -- 0 0 -- 2 0 - 100.0%
July 2013
Closed Sales Median Sales Price Days on Market Inventory
All data from MLS Property Information Network, Inc. Provided by Greater Boston Association of REALTORS®. Powered by 10K Research and Marketing.
Multi-Family Housing Activity Report – 3-Family Properties (cont.)
7-2012 7-2013 + / – 7-2012 7-2013 + / – 7-2012 7-2013 + / – 7-2012 7-2013 + / –
Norfolk 0 0 -- $0 $0 -- 0 0 -- 0 0 --
North Attleboro 0 1 -- $0 $305,000 -- 0 29 -- 4 3 -25.0%
Norwood 1 0 -100.0% $353,500 $0 -100.0% 283 0 -100.0% 1 1 0.0%
Plainville 0 0 -- $0 $0 -- 0 0 -- 0 1 --
Quincy 1 1 0.0% $490,000 $525,000 +7.1% 21 9 -57.1% 4 6 +50.0%
Revere 0 1 -- $0 $402,000 -- 0 24 -- 5 3 -40.0%
Saugus 0 0 -- $0 $0 -- 0 0 -- 1 0 -100.0%
Sharon 0 0 -- $0 $0 -- 0 0 -- 0 0 --
Sherborn 0 0 -- $0 $0 -- 0 0 -- 0 0 --
Somerville 2 2 0.0% $463,500 $729,000 +57.3% 16 2 -90.6% 8 6 -25.0%
Southborough 0 0 -- $0 $0 -- 0 0 -- 0 0 --
Stow 0 0 -- $0 $0 -- 0 0 -- 0 0 --
Sudbury 0 0 -- $0 $0 -- 0 0 -- 0 0 --
Walpole 0 0 -- $0 $0 -- 0 0 -- 1 1 0.0%
Waltham 0 1 -- $0 $484,900 -- 0 88 -- 1 2 +100.0%
Watertown 0 0 -- $0 $0 -- 0 0 -- 2 2 0.0%
Wayland 0 0 -- $0 $0 -- 0 0 -- 0 0 --
Wellesley 0 0 -- $0 $0 -- 0 0 -- 0 0 --
Weston 0 0 -- $0 $0 -- 0 0 -- 0 0 --
Westwood 0 0 -- $0 $0 -- 0 0 -- 0 0 --
Winchester 0 0 -- $0 $0 -- 0 0 -- 0 0 --
Winthrop 0 0 -- $0 $0 -- 0 0 -- 2 2 0.0%
Woburn 0 0 -- $0 $0 -- 0 0 -- 1 0 -100.0%
Wrentham 0 0 -- $0 $0 -- 0 0 -- 1 1 0.0%
Greater Boston 52 55 +5.8% $387,500 $422,500 +9.0% 73 26 -65.2% 224 146 -34.8%
Note: The "Greater Boston" figures are not a compilation or total of the individual areas.
Closed Sales Median Sales Price Days on Market Inventory
July 2013
All data from MLS Property Information Network, Inc. Provided by Greater Boston Association of REALTORS®. Powered by 10K Research and Marketing.
Multi-Family Housing Activity Report – 4-Family Properties
7-2012 7-2013 + / – 7-2012 7-2013 + / – 7-2012 7-2013 + / – 7-2012 7-2013 + / –
Acton 0 0 -- $0 $0 -- 0 0 -- 0 0 --
Arlington 0 0 -- $0 $0 -- 0 0 -- 0 0 --
Ashland 0 0 -- $0 $0 -- 0 0 -- 0 0 --
Attleboro 0 0 -- $0 $0 -- 0 0 -- 3 1 - 66.7%
Bedford 0 0 -- $0 $0 -- 0 0 -- 0 0 --
Bellingham 0 0 -- $0 $0 -- 0 0 -- 0 0 --
Belmont 0 0 -- $0 $0 -- 0 0 -- 0 0 --
Boston 5 4 - 20.0% $1,437,500 $985,000 - 31.5% 88 61 - 31.4% 8 6 - 25.0%
Boxborough 0 0 -- $0 $0 -- 0 0 -- 0 0 --
Brookline 0 0 -- $0 $0 -- 0 0 -- 0 0 --
Burlington 0 0 -- $0 $0 -- 0 0 -- 0 0 --
Cambridge 1 1 0.0% $1,062,500 $1,800,000 + 69.4% 199 41 - 79.4% 1 1 0.0%
Canton 0 0 -- $0 $0 -- 0 0 -- 0 0 --
Carlisle 0 0 -- $0 $0 -- 0 0 -- 0 0 --
Chelsea 1 0 - 100.0% $343,000 $0 - 100.0% 138 0 - 100.0% 0 2 --
Concord 0 0 -- $0 $0 -- 0 0 -- 0 0 --
Dedham 0 0 -- $0 $0 -- 0 0 -- 0 0 --
Dover 0 0 -- $0 $0 -- 0 0 -- 0 0 --
Everett 1 0 - 100.0% $425,000 $0 - 100.0% 54 0 - 100.0% 0 1 --
Foxborough 0 0 -- $0 $0 -- 0 0 -- 0 0 --
Framingham 0 0 -- $0 $0 -- 0 0 -- 0 1 --
Franklin 0 0 -- $0 $0 -- 0 0 -- 0 1 --
Holliston 0 0 -- $0 $0 -- 0 0 -- 4 0 - 100.0%
Hopkinton 0 0 -- $0 $0 -- 0 0 -- 0 0 --
Hudson 0 0 -- $0 $0 -- 0 0 -- 0 0 --
Lexington 0 0 -- $0 $0 -- 0 0 -- 0 0 --
Lincoln 0 0 -- $0 $0 -- 0 0 -- 0 0 --
Malden 0 0 -- $0 $0 -- 0 0 -- 1 0 - 100.0%
Mansfield 0 0 -- $0 $0 -- 0 0 -- 0 1 --
Marlborough 1 0 - 100.0% $350,000 $0 - 100.0% 22 0 - 100.0% 3 2 - 33.3%
Maynard 0 0 -- $0 $0 -- 0 0 -- 0 0 --
Medfield 0 0 -- $0 $0 -- 0 0 -- 0 1 --
Medford 0 0 -- $0 $0 -- 0 0 -- 0 0 --
Medway 0 0 -- $0 $0 -- 0 0 -- 0 0 --
Milford 0 0 -- $0 $0 -- 0 0 -- 1 1 0.0%
Millis 0 0 -- $0 $0 -- 0 0 -- 0 0 --
Milton 0 0 -- $0 $0 -- 0 0 -- 0 0 --
Natick 0 0 -- $0 $0 -- 0 0 -- 0 0 --
Needham 0 0 -- $0 $0 -- 0 0 -- 0 0 --
Newton 0 0 -- $0 $0 -- 0 0 -- 3 1 - 66.7%
July 2013
Closed Sales Median Sales Price Days on Market Inventory
All data from MLS Property Information Network, Inc. Provided by Greater Boston Association of REALTORS®. Powered by 10K Research and Marketing.
Multi-Family Housing Activity Report – 4-Family Properties (cont.)
7-2012 7-2013 + / – 7-2012 7-2013 + / – 7-2012 7-2013 + / – 7-2012 7-2013 + / –
Norfolk 0 0 -- $0 $0 -- 0 0 -- 0 1 --
North Attleboro 0 0 -- $0 $0 -- 0 0 -- 0 1 --
Norwood 0 0 -- $0 $0 -- 0 0 -- 0 1 --
Plainville 0 1 -- $0 $320,000 -- 0 607 -- 2 0 -100.0%
Quincy 3 1 -66.7% $570,000 $556,000 -2.5% 14 5 -64.3% 4 3 -25.0%
Revere 0 1 -- $0 $355,000 -- 0 20 -- 1 2 +100.0%
Saugus 0 0 -- $0 $0 -- 0 0 -- 0 0 --
Sharon 0 0 -- $0 $0 -- 0 0 -- 0 0 --
Sherborn 0 0 -- $0 $0 -- 0 0 -- 0 0 --
Somerville 1 0 -100.0% $1,180,000 $0 -100.0% 58 0 -100.0% 4 1 -75.0%
Southborough 0 0 -- $0 $0 -- 0 0 -- 0 0 --
Stow 0 0 -- $0 $0 -- 0 0 -- 0 0 --
Sudbury 0 0 -- $0 $0 -- 0 0 -- 0 0 --
Walpole 0 0 -- $0 $0 -- 0 0 -- 0 0 --
Waltham 0 1 -- $0 $675,000 -- 0 23 -- 0 1 --
Watertown 0 0 -- $0 $0 -- 0 0 -- 0 0 --
Wayland 0 0 -- $0 $0 -- 0 0 -- 0 0 --
Wellesley 0 0 -- $0 $0 -- 0 0 -- 0 0 --
Weston 0 0 -- $0 $0 -- 0 0 -- 0 0 --
Westwood 0 0 -- $0 $0 -- 0 0 -- 0 0 --
Winchester 0 0 -- $0 $0 -- 0 0 -- 0 0 --
Winthrop 0 0 -- $0 $0 -- 0 0 -- 0 0 --
Woburn 0 0 -- $0 $0 -- 0 0 -- 1 0 -100.0%
Wrentham 0 0 -- $0 $0 -- 0 0 -- 0 0 --
Greater Boston 13 9 -30.8% $570,000 $675,000 +18.4% 73 104 +42.0% 35 27 -22.9%
Note: The "Greater Boston" figures are not a compilation or total of the individual areas.
Closed Sales Median Sales Price Days on Market Inventory
July 2013

More Related Content

Similar to July 2013 Multifamily Housing Activity Report – Boston, MA Real Estate

September 2014 Multi-family Housing Activity Report – Boston, MA Real Estate
September 2014 Multi-family Housing Activity Report – Boston, MA Real EstateSeptember 2014 Multi-family Housing Activity Report – Boston, MA Real Estate
September 2014 Multi-family Housing Activity Report – Boston, MA Real Estate
Unit Realty Group
 
West Vancouver Real Estate Statistics Nov. 2015
West Vancouver Real Estate Statistics Nov. 2015West Vancouver Real Estate Statistics Nov. 2015
West Vancouver Real Estate Statistics Nov. 2015
Phil LeGree
 
North Vancouver Real Estate Statistics Nov 2015
North Vancouver Real Estate Statistics Nov 2015North Vancouver Real Estate Statistics Nov 2015
North Vancouver Real Estate Statistics Nov 2015
Phil LeGree
 
Total Market Overview 106 Island Bridge Dr
Total Market Overview 106 Island Bridge DrTotal Market Overview 106 Island Bridge Dr
Total Market Overview 106 Island Bridge Drwaltdowdy
 
October 2013 Multi-family Housing Activity Report – Boston, MA Real Estate
October 2013 Multi-family Housing Activity Report – Boston, MA Real EstateOctober 2013 Multi-family Housing Activity Report – Boston, MA Real Estate
October 2013 Multi-family Housing Activity Report – Boston, MA Real Estate
Unit Realty Group
 
The Okanagan Statistics Package January 2022
The Okanagan Statistics Package January 2022The Okanagan Statistics Package January 2022
The Okanagan Statistics Package January 2022
VickyAulakh1
 
Cottonwood stats report for April
Cottonwood stats report for AprilCottonwood stats report for April
Cottonwood stats report for April
Damian Bruno
 
Cottonwood Stats Report for April
Cottonwood Stats Report for AprilCottonwood Stats Report for April
Cottonwood Stats Report for April
Damian Bruno
 
August 2011 Market Pulse - Attached Homes
August 2011 Market Pulse - Attached HomesAugust 2011 Market Pulse - Attached Homes
August 2011 Market Pulse - Attached Homes
chipwags
 
H W 2011 10 At
H W 2011 10 AtH W 2011 10 At
H W 2011 10 At
chipwags
 
Chicagoland Monthly Maket Pulse -Feb 2010 Attached
Chicagoland Monthly Maket Pulse -Feb 2010 AttachedChicagoland Monthly Maket Pulse -Feb 2010 Attached
Chicagoland Monthly Maket Pulse -Feb 2010 Attached
chipwags
 
H W 2010 07 At
H W 2010 07 AtH W 2010 07 At
H W 2010 07 Atchipwags
 
Tec monterrey sheet1
Tec monterrey   sheet1Tec monterrey   sheet1
Tec monterrey sheet1
PedroZambrano28
 
Cottonwood stats for August
Cottonwood stats for AugustCottonwood stats for August
Cottonwood stats for August
Damian Bruno
 
JLL Great Lakes Scorecard
JLL Great Lakes ScorecardJLL Great Lakes Scorecard
JLL Great Lakes Scorecard
Andrew Batson
 
Practica para evaluacion de pares
Practica para evaluacion de paresPractica para evaluacion de pares
Practica para evaluacion de pares
ValentinRamirezCabal
 
Cottonwood Stats Report for June
Cottonwood Stats Report for JuneCottonwood Stats Report for June
Cottonwood Stats Report for June
Damian Bruno
 
Examining the Housing Market in Metro Atlanta
Examining the Housing Market in Metro AtlantaExamining the Housing Market in Metro Atlanta
Examining the Housing Market in Metro Atlanta
ARCResearch
 

Similar to July 2013 Multifamily Housing Activity Report – Boston, MA Real Estate (18)

September 2014 Multi-family Housing Activity Report – Boston, MA Real Estate
September 2014 Multi-family Housing Activity Report – Boston, MA Real EstateSeptember 2014 Multi-family Housing Activity Report – Boston, MA Real Estate
September 2014 Multi-family Housing Activity Report – Boston, MA Real Estate
 
West Vancouver Real Estate Statistics Nov. 2015
West Vancouver Real Estate Statistics Nov. 2015West Vancouver Real Estate Statistics Nov. 2015
West Vancouver Real Estate Statistics Nov. 2015
 
North Vancouver Real Estate Statistics Nov 2015
North Vancouver Real Estate Statistics Nov 2015North Vancouver Real Estate Statistics Nov 2015
North Vancouver Real Estate Statistics Nov 2015
 
Total Market Overview 106 Island Bridge Dr
Total Market Overview 106 Island Bridge DrTotal Market Overview 106 Island Bridge Dr
Total Market Overview 106 Island Bridge Dr
 
October 2013 Multi-family Housing Activity Report – Boston, MA Real Estate
October 2013 Multi-family Housing Activity Report – Boston, MA Real EstateOctober 2013 Multi-family Housing Activity Report – Boston, MA Real Estate
October 2013 Multi-family Housing Activity Report – Boston, MA Real Estate
 
The Okanagan Statistics Package January 2022
The Okanagan Statistics Package January 2022The Okanagan Statistics Package January 2022
The Okanagan Statistics Package January 2022
 
Cottonwood stats report for April
Cottonwood stats report for AprilCottonwood stats report for April
Cottonwood stats report for April
 
Cottonwood Stats Report for April
Cottonwood Stats Report for AprilCottonwood Stats Report for April
Cottonwood Stats Report for April
 
August 2011 Market Pulse - Attached Homes
August 2011 Market Pulse - Attached HomesAugust 2011 Market Pulse - Attached Homes
August 2011 Market Pulse - Attached Homes
 
H W 2011 10 At
H W 2011 10 AtH W 2011 10 At
H W 2011 10 At
 
Chicagoland Monthly Maket Pulse -Feb 2010 Attached
Chicagoland Monthly Maket Pulse -Feb 2010 AttachedChicagoland Monthly Maket Pulse -Feb 2010 Attached
Chicagoland Monthly Maket Pulse -Feb 2010 Attached
 
H W 2010 07 At
H W 2010 07 AtH W 2010 07 At
H W 2010 07 At
 
Tec monterrey sheet1
Tec monterrey   sheet1Tec monterrey   sheet1
Tec monterrey sheet1
 
Cottonwood stats for August
Cottonwood stats for AugustCottonwood stats for August
Cottonwood stats for August
 
JLL Great Lakes Scorecard
JLL Great Lakes ScorecardJLL Great Lakes Scorecard
JLL Great Lakes Scorecard
 
Practica para evaluacion de pares
Practica para evaluacion de paresPractica para evaluacion de pares
Practica para evaluacion de pares
 
Cottonwood Stats Report for June
Cottonwood Stats Report for JuneCottonwood Stats Report for June
Cottonwood Stats Report for June
 
Examining the Housing Market in Metro Atlanta
Examining the Housing Market in Metro AtlantaExamining the Housing Market in Metro Atlanta
Examining the Housing Market in Metro Atlanta
 

More from Unit Realty Group

October 2015 Greater Boston Real Estate Market Trends Report
October 2015 Greater Boston Real Estate Market Trends ReportOctober 2015 Greater Boston Real Estate Market Trends Report
October 2015 Greater Boston Real Estate Market Trends Report
Unit Realty Group
 
September 2015 Greater Boston Real Estate Market Trends Report
September 2015 Greater Boston Real Estate Market Trends ReportSeptember 2015 Greater Boston Real Estate Market Trends Report
September 2015 Greater Boston Real Estate Market Trends Report
Unit Realty Group
 
August 2015 Greater Boston Real Estate Market Trends Report
August 2015 Greater Boston Real Estate Market Trends ReportAugust 2015 Greater Boston Real Estate Market Trends Report
August 2015 Greater Boston Real Estate Market Trends Report
Unit Realty Group
 
February 2015 Greater Boston Real Estate Market Trends Report
February 2015 Greater Boston Real Estate Market Trends ReportFebruary 2015 Greater Boston Real Estate Market Trends Report
February 2015 Greater Boston Real Estate Market Trends Report
Unit Realty Group
 
January 2015 Greater Boston Real Estate Market Trends Report
January 2015 Greater Boston Real Estate Market Trends ReportJanuary 2015 Greater Boston Real Estate Market Trends Report
January 2015 Greater Boston Real Estate Market Trends Report
Unit Realty Group
 
December 2014 Greater Boston Real Estate Market Trends Report
December 2014 Greater Boston Real Estate Market Trends ReportDecember 2014 Greater Boston Real Estate Market Trends Report
December 2014 Greater Boston Real Estate Market Trends Report
Unit Realty Group
 
November 2014 Greater Boston Real Estate Market Trends Report
November 2014 Greater Boston Real Estate Market Trends ReportNovember 2014 Greater Boston Real Estate Market Trends Report
November 2014 Greater Boston Real Estate Market Trends Report
Unit Realty Group
 
October 2014 Greater Boston Real Estate Market Trends Report
October 2014 Greater Boston Real Estate Market Trends ReportOctober 2014 Greater Boston Real Estate Market Trends Report
October 2014 Greater Boston Real Estate Market Trends ReportUnit Realty Group
 
Boston By The Numbers - Boston Housing Stock (Report)
Boston By The Numbers - Boston Housing Stock (Report)Boston By The Numbers - Boston Housing Stock (Report)
Boston By The Numbers - Boston Housing Stock (Report)
Unit Realty Group
 
January 2014 Greater Boston Real Estate Market Trends Report
January 2014 Greater Boston Real Estate Market Trends ReportJanuary 2014 Greater Boston Real Estate Market Trends Report
January 2014 Greater Boston Real Estate Market Trends Report
Unit Realty Group
 
November 2013 Multi-family Housing Activity Report – Boston, MA Real Estate
November 2013 Multi-family Housing Activity Report – Boston, MA Real EstateNovember 2013 Multi-family Housing Activity Report – Boston, MA Real Estate
November 2013 Multi-family Housing Activity Report – Boston, MA Real Estate
Unit Realty Group
 
September 2013 Multifamily Housing Activity Report – Boston, MA Real Estate
September 2013 Multifamily Housing Activity Report – Boston, MA Real EstateSeptember 2013 Multifamily Housing Activity Report – Boston, MA Real Estate
September 2013 Multifamily Housing Activity Report – Boston, MA Real Estate
Unit Realty Group
 
July 2013's Monthly Indicators report - Boston Real Estate Market Trends
July 2013's Monthly Indicators report - Boston Real Estate Market TrendsJuly 2013's Monthly Indicators report - Boston Real Estate Market Trends
July 2013's Monthly Indicators report - Boston Real Estate Market Trends
Unit Realty Group
 
June 2013's Monthly Indicators report - Boston Real Estate Market Trends
June 2013's Monthly Indicators report - Boston Real Estate Market TrendsJune 2013's Monthly Indicators report - Boston Real Estate Market Trends
June 2013's Monthly Indicators report - Boston Real Estate Market Trends
Unit Realty Group
 
May 2013's Monthly Indicators report - Boston Real Estate Market Trends
May 2013's Monthly Indicators report - Boston Real Estate Market Trends May 2013's Monthly Indicators report - Boston Real Estate Market Trends
May 2013's Monthly Indicators report - Boston Real Estate Market Trends
Unit Realty Group
 
April 2013's Monthly Indicators report - Boston Real Estate Market Trends
April 2013's Monthly Indicators report - Boston Real Estate Market TrendsApril 2013's Monthly Indicators report - Boston Real Estate Market Trends
April 2013's Monthly Indicators report - Boston Real Estate Market Trends
Unit Realty Group
 
February 2013 Monthly Multi-family Housing Activity Report - Boston Real Estate
February 2013 Monthly Multi-family Housing Activity Report - Boston Real EstateFebruary 2013 Monthly Multi-family Housing Activity Report - Boston Real Estate
February 2013 Monthly Multi-family Housing Activity Report - Boston Real Estate
Unit Realty Group
 
February 2013's Monthly Indicators report - Boston Real Estate Market Trends
February 2013's Monthly Indicators report - Boston Real Estate Market TrendsFebruary 2013's Monthly Indicators report - Boston Real Estate Market Trends
February 2013's Monthly Indicators report - Boston Real Estate Market Trends
Unit Realty Group
 
January 2013's Monthly Indicators report
January 2013's Monthly Indicators reportJanuary 2013's Monthly Indicators report
January 2013's Monthly Indicators report
Unit Realty Group
 
Multi-Family Housing Activity Report, September 2012
Multi-Family Housing Activity Report, September 2012Multi-Family Housing Activity Report, September 2012
Multi-Family Housing Activity Report, September 2012
Unit Realty Group
 

More from Unit Realty Group (20)

October 2015 Greater Boston Real Estate Market Trends Report
October 2015 Greater Boston Real Estate Market Trends ReportOctober 2015 Greater Boston Real Estate Market Trends Report
October 2015 Greater Boston Real Estate Market Trends Report
 
September 2015 Greater Boston Real Estate Market Trends Report
September 2015 Greater Boston Real Estate Market Trends ReportSeptember 2015 Greater Boston Real Estate Market Trends Report
September 2015 Greater Boston Real Estate Market Trends Report
 
August 2015 Greater Boston Real Estate Market Trends Report
August 2015 Greater Boston Real Estate Market Trends ReportAugust 2015 Greater Boston Real Estate Market Trends Report
August 2015 Greater Boston Real Estate Market Trends Report
 
February 2015 Greater Boston Real Estate Market Trends Report
February 2015 Greater Boston Real Estate Market Trends ReportFebruary 2015 Greater Boston Real Estate Market Trends Report
February 2015 Greater Boston Real Estate Market Trends Report
 
January 2015 Greater Boston Real Estate Market Trends Report
January 2015 Greater Boston Real Estate Market Trends ReportJanuary 2015 Greater Boston Real Estate Market Trends Report
January 2015 Greater Boston Real Estate Market Trends Report
 
December 2014 Greater Boston Real Estate Market Trends Report
December 2014 Greater Boston Real Estate Market Trends ReportDecember 2014 Greater Boston Real Estate Market Trends Report
December 2014 Greater Boston Real Estate Market Trends Report
 
November 2014 Greater Boston Real Estate Market Trends Report
November 2014 Greater Boston Real Estate Market Trends ReportNovember 2014 Greater Boston Real Estate Market Trends Report
November 2014 Greater Boston Real Estate Market Trends Report
 
October 2014 Greater Boston Real Estate Market Trends Report
October 2014 Greater Boston Real Estate Market Trends ReportOctober 2014 Greater Boston Real Estate Market Trends Report
October 2014 Greater Boston Real Estate Market Trends Report
 
Boston By The Numbers - Boston Housing Stock (Report)
Boston By The Numbers - Boston Housing Stock (Report)Boston By The Numbers - Boston Housing Stock (Report)
Boston By The Numbers - Boston Housing Stock (Report)
 
January 2014 Greater Boston Real Estate Market Trends Report
January 2014 Greater Boston Real Estate Market Trends ReportJanuary 2014 Greater Boston Real Estate Market Trends Report
January 2014 Greater Boston Real Estate Market Trends Report
 
November 2013 Multi-family Housing Activity Report – Boston, MA Real Estate
November 2013 Multi-family Housing Activity Report – Boston, MA Real EstateNovember 2013 Multi-family Housing Activity Report – Boston, MA Real Estate
November 2013 Multi-family Housing Activity Report – Boston, MA Real Estate
 
September 2013 Multifamily Housing Activity Report – Boston, MA Real Estate
September 2013 Multifamily Housing Activity Report – Boston, MA Real EstateSeptember 2013 Multifamily Housing Activity Report – Boston, MA Real Estate
September 2013 Multifamily Housing Activity Report – Boston, MA Real Estate
 
July 2013's Monthly Indicators report - Boston Real Estate Market Trends
July 2013's Monthly Indicators report - Boston Real Estate Market TrendsJuly 2013's Monthly Indicators report - Boston Real Estate Market Trends
July 2013's Monthly Indicators report - Boston Real Estate Market Trends
 
June 2013's Monthly Indicators report - Boston Real Estate Market Trends
June 2013's Monthly Indicators report - Boston Real Estate Market TrendsJune 2013's Monthly Indicators report - Boston Real Estate Market Trends
June 2013's Monthly Indicators report - Boston Real Estate Market Trends
 
May 2013's Monthly Indicators report - Boston Real Estate Market Trends
May 2013's Monthly Indicators report - Boston Real Estate Market Trends May 2013's Monthly Indicators report - Boston Real Estate Market Trends
May 2013's Monthly Indicators report - Boston Real Estate Market Trends
 
April 2013's Monthly Indicators report - Boston Real Estate Market Trends
April 2013's Monthly Indicators report - Boston Real Estate Market TrendsApril 2013's Monthly Indicators report - Boston Real Estate Market Trends
April 2013's Monthly Indicators report - Boston Real Estate Market Trends
 
February 2013 Monthly Multi-family Housing Activity Report - Boston Real Estate
February 2013 Monthly Multi-family Housing Activity Report - Boston Real EstateFebruary 2013 Monthly Multi-family Housing Activity Report - Boston Real Estate
February 2013 Monthly Multi-family Housing Activity Report - Boston Real Estate
 
February 2013's Monthly Indicators report - Boston Real Estate Market Trends
February 2013's Monthly Indicators report - Boston Real Estate Market TrendsFebruary 2013's Monthly Indicators report - Boston Real Estate Market Trends
February 2013's Monthly Indicators report - Boston Real Estate Market Trends
 
January 2013's Monthly Indicators report
January 2013's Monthly Indicators reportJanuary 2013's Monthly Indicators report
January 2013's Monthly Indicators report
 
Multi-Family Housing Activity Report, September 2012
Multi-Family Housing Activity Report, September 2012Multi-Family Housing Activity Report, September 2012
Multi-Family Housing Activity Report, September 2012
 

Recently uploaded

How to keep your Home naturally Cool and Warm
How to keep your Home naturally Cool and WarmHow to keep your Home naturally Cool and Warm
How to keep your Home naturally Cool and Warm
Vinra Construction
 
Optimizing Your MCA Lead Capture Process for Better Results
Optimizing Your MCA Lead Capture Process for Better ResultsOptimizing Your MCA Lead Capture Process for Better Results
Optimizing Your MCA Lead Capture Process for Better Results
Lead Generation Media
 
Torun Center Residences Istanbul - Listing Turkey
Torun Center Residences Istanbul - Listing TurkeyTorun Center Residences Istanbul - Listing Turkey
Torun Center Residences Istanbul - Listing Turkey
Listing Turkey
 
Deutsche EuroShop | Company Presentation | 06/24
Deutsche EuroShop | Company Presentation | 06/24Deutsche EuroShop | Company Presentation | 06/24
Deutsche EuroShop | Company Presentation | 06/24
Deutsche EuroShop AG
 
SVN Live 6.3.24 Weekly Property Broadcast
SVN Live 6.3.24 Weekly Property BroadcastSVN Live 6.3.24 Weekly Property Broadcast
SVN Live 6.3.24 Weekly Property Broadcast
SVN International Corp.
 
One FNG by Group 108 Sector 142 Noida Construction Update
One FNG by Group 108 Sector 142 Noida Construction UpdateOne FNG by Group 108 Sector 142 Noida Construction Update
One FNG by Group 108 Sector 142 Noida Construction Update
One FNG
 
Biography and career about Lixin Azarmehr
Biography and career about Lixin AzarmehrBiography and career about Lixin Azarmehr
Biography and career about Lixin Azarmehr
Lixin Azarmehr
 
Digital marketing strategy for Real Estate
Digital marketing strategy for Real EstateDigital marketing strategy for Real Estate
Digital marketing strategy for Real Estate
dheerajkumar8179
 
Presentation to Windust Meadows HOA Board of Directors June 4, 2024: Focus o...
Presentation to Windust Meadows HOA Board of Directors June 4, 2024:  Focus o...Presentation to Windust Meadows HOA Board of Directors June 4, 2024:  Focus o...
Presentation to Windust Meadows HOA Board of Directors June 4, 2024: Focus o...
Joseph Lewis Aguirre
 
Riverview City Loni Kalbhor Pune Brochure
Riverview City Loni Kalbhor Pune BrochureRiverview City Loni Kalbhor Pune Brochure
Riverview City Loni Kalbhor Pune Brochure
kishor21012022
 
Architectural & Interior design portfolio.pdf
Architectural & Interior design portfolio.pdfArchitectural & Interior design portfolio.pdf
Architectural & Interior design portfolio.pdf
susantebinum
 
The KA Housing - Catalogue - Listing Turkey
The KA Housing - Catalogue - Listing TurkeyThe KA Housing - Catalogue - Listing Turkey
The KA Housing - Catalogue - Listing Turkey
Listing Turkey
 
GT234 CADASTRAL SURVEYING gggggggggg.ppt
GT234 CADASTRAL SURVEYING gggggggggg.pptGT234 CADASTRAL SURVEYING gggggggggg.ppt
GT234 CADASTRAL SURVEYING gggggggggg.ppt
leonardmichael1
 
Simpolo Company Profile & Corporate Logo
Simpolo Company Profile & Corporate LogoSimpolo Company Profile & Corporate Logo
Simpolo Company Profile & Corporate Logo
simpolosparkteam
 
One20 North Vancouver Floor Plans by Three Shores Development.
One20 North Vancouver Floor Plans by Three Shores Development.One20 North Vancouver Floor Plans by Three Shores Development.
One20 North Vancouver Floor Plans by Three Shores Development.
VickyAulakh1
 
Total Environment Tangled Up In The Green - Residential Plots Where Nature an...
Total Environment Tangled Up In The Green - Residential Plots Where Nature an...Total Environment Tangled Up In The Green - Residential Plots Where Nature an...
Total Environment Tangled Up In The Green - Residential Plots Where Nature an...
JagadishKR1
 
Elegant Evergreen Homes - Luxury Apartments Redefining Comfort in Yelahanka, ...
Elegant Evergreen Homes - Luxury Apartments Redefining Comfort in Yelahanka, ...Elegant Evergreen Homes - Luxury Apartments Redefining Comfort in Yelahanka, ...
Elegant Evergreen Homes - Luxury Apartments Redefining Comfort in Yelahanka, ...
JagadishKR1
 
Investing In The US As A Canadian… And How To Do It RIGHT!! (feat. Erwin Szet...
Investing In The US As A Canadian… And How To Do It RIGHT!! (feat. Erwin Szet...Investing In The US As A Canadian… And How To Do It RIGHT!! (feat. Erwin Szet...
Investing In The US As A Canadian… And How To Do It RIGHT!! (feat. Erwin Szet...
Volition Properties
 
Sense Levent Kagithane Catalog - Listing Turkey
Sense Levent Kagithane Catalog - Listing TurkeySense Levent Kagithane Catalog - Listing Turkey
Sense Levent Kagithane Catalog - Listing Turkey
Listing Turkey
 
Listing Turkey - Yeni Eyupevleri Istanbul
Listing Turkey - Yeni Eyupevleri IstanbulListing Turkey - Yeni Eyupevleri Istanbul
Listing Turkey - Yeni Eyupevleri Istanbul
Listing Turkey
 

Recently uploaded (20)

How to keep your Home naturally Cool and Warm
How to keep your Home naturally Cool and WarmHow to keep your Home naturally Cool and Warm
How to keep your Home naturally Cool and Warm
 
Optimizing Your MCA Lead Capture Process for Better Results
Optimizing Your MCA Lead Capture Process for Better ResultsOptimizing Your MCA Lead Capture Process for Better Results
Optimizing Your MCA Lead Capture Process for Better Results
 
Torun Center Residences Istanbul - Listing Turkey
Torun Center Residences Istanbul - Listing TurkeyTorun Center Residences Istanbul - Listing Turkey
Torun Center Residences Istanbul - Listing Turkey
 
Deutsche EuroShop | Company Presentation | 06/24
Deutsche EuroShop | Company Presentation | 06/24Deutsche EuroShop | Company Presentation | 06/24
Deutsche EuroShop | Company Presentation | 06/24
 
SVN Live 6.3.24 Weekly Property Broadcast
SVN Live 6.3.24 Weekly Property BroadcastSVN Live 6.3.24 Weekly Property Broadcast
SVN Live 6.3.24 Weekly Property Broadcast
 
One FNG by Group 108 Sector 142 Noida Construction Update
One FNG by Group 108 Sector 142 Noida Construction UpdateOne FNG by Group 108 Sector 142 Noida Construction Update
One FNG by Group 108 Sector 142 Noida Construction Update
 
Biography and career about Lixin Azarmehr
Biography and career about Lixin AzarmehrBiography and career about Lixin Azarmehr
Biography and career about Lixin Azarmehr
 
Digital marketing strategy for Real Estate
Digital marketing strategy for Real EstateDigital marketing strategy for Real Estate
Digital marketing strategy for Real Estate
 
Presentation to Windust Meadows HOA Board of Directors June 4, 2024: Focus o...
Presentation to Windust Meadows HOA Board of Directors June 4, 2024:  Focus o...Presentation to Windust Meadows HOA Board of Directors June 4, 2024:  Focus o...
Presentation to Windust Meadows HOA Board of Directors June 4, 2024: Focus o...
 
Riverview City Loni Kalbhor Pune Brochure
Riverview City Loni Kalbhor Pune BrochureRiverview City Loni Kalbhor Pune Brochure
Riverview City Loni Kalbhor Pune Brochure
 
Architectural & Interior design portfolio.pdf
Architectural & Interior design portfolio.pdfArchitectural & Interior design portfolio.pdf
Architectural & Interior design portfolio.pdf
 
The KA Housing - Catalogue - Listing Turkey
The KA Housing - Catalogue - Listing TurkeyThe KA Housing - Catalogue - Listing Turkey
The KA Housing - Catalogue - Listing Turkey
 
GT234 CADASTRAL SURVEYING gggggggggg.ppt
GT234 CADASTRAL SURVEYING gggggggggg.pptGT234 CADASTRAL SURVEYING gggggggggg.ppt
GT234 CADASTRAL SURVEYING gggggggggg.ppt
 
Simpolo Company Profile & Corporate Logo
Simpolo Company Profile & Corporate LogoSimpolo Company Profile & Corporate Logo
Simpolo Company Profile & Corporate Logo
 
One20 North Vancouver Floor Plans by Three Shores Development.
One20 North Vancouver Floor Plans by Three Shores Development.One20 North Vancouver Floor Plans by Three Shores Development.
One20 North Vancouver Floor Plans by Three Shores Development.
 
Total Environment Tangled Up In The Green - Residential Plots Where Nature an...
Total Environment Tangled Up In The Green - Residential Plots Where Nature an...Total Environment Tangled Up In The Green - Residential Plots Where Nature an...
Total Environment Tangled Up In The Green - Residential Plots Where Nature an...
 
Elegant Evergreen Homes - Luxury Apartments Redefining Comfort in Yelahanka, ...
Elegant Evergreen Homes - Luxury Apartments Redefining Comfort in Yelahanka, ...Elegant Evergreen Homes - Luxury Apartments Redefining Comfort in Yelahanka, ...
Elegant Evergreen Homes - Luxury Apartments Redefining Comfort in Yelahanka, ...
 
Investing In The US As A Canadian… And How To Do It RIGHT!! (feat. Erwin Szet...
Investing In The US As A Canadian… And How To Do It RIGHT!! (feat. Erwin Szet...Investing In The US As A Canadian… And How To Do It RIGHT!! (feat. Erwin Szet...
Investing In The US As A Canadian… And How To Do It RIGHT!! (feat. Erwin Szet...
 
Sense Levent Kagithane Catalog - Listing Turkey
Sense Levent Kagithane Catalog - Listing TurkeySense Levent Kagithane Catalog - Listing Turkey
Sense Levent Kagithane Catalog - Listing Turkey
 
Listing Turkey - Yeni Eyupevleri Istanbul
Listing Turkey - Yeni Eyupevleri IstanbulListing Turkey - Yeni Eyupevleri Istanbul
Listing Turkey - Yeni Eyupevleri Istanbul
 

July 2013 Multifamily Housing Activity Report – Boston, MA Real Estate

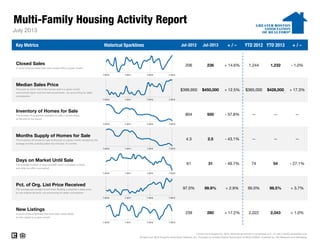
  • 1. Multi-Family Housing Activity Report Key Metrics Historical Sparklines Jul-2012 Jul-2013 + / – YTD 2012 YTD 2013 + / – 1,232 - 1.0% Median Sales Price The point at which half of the homes sold in a given month were priced higher and one half priced lower, not accounting for seller concessions. $399,950 1,244 July 2013 Closed Sales A count of actual sales that have closed within a given month. 206 236 + 14.6% -- $450,000 + 12.5% $365,000 $428,000 + 17.3% -- -- --- 43.1% Inventory of Homes for Sale The number of properties available for sale in active status at the end of the month. 804 500 - 37.8% -- Days on Market Until Sale The average number of days between when a property is listed and when an offer is accepted. 61 31 - 49.7% 74 54 98.5% Current as of August 20, 2013. Multi-family activity is comprised of 2-, 3- and 4-family properties only. All data from MLS Property Information Network, Inc. Provided by Greater Boston Association of REALTORS®. Powered by 10K Research and Marketing. -- + 3.7% New Listings A count of the properties that have been newly listed on the market in a given month. 239 280 + 17.2% 2,022 2,043 + 1.0% - 27.1% Months Supply of Homes for Sale The inventory of homes for sale at the end of a given month, divided by the average monthly pending sales from the last 12 months. 4.3 2.5 Pct. of Org. List Price Received The average percentage found when dividing a property's sales price by the original list price, not accounting for seller concessions. 97.0% 99.9% + 2.9% 95.0% 7-2010 7-2011 7-2012 7-2013 7-2010 7-2011 7-2012 7-2013 7-2010 7-2011 7-2012 7-2013 7-2010 7-2011 7-2012 7-2013 7-2010 7-2011 7-2012 7-2013 7-2010 7-2011 7-2012 7-2013 7-2010 7-2011 7-2012 7-2013 5B5B
  • 2. All data from MLS Property Information Network, Inc. Provided by Greater Boston Association of REALTORS®. Powered by 10K Research and Marketing. Multi-Family Housing Activity Report – 2-Family Properties 7-2012 7-2013 + / – 7-2012 7-2013 + / – 7-2012 7-2013 + / – 7-2012 7-2013 + / – Acton 0 0 -- $0 $0 -- 0 0 -- 1 1 0.0% Arlington 5 10 + 100.0% $495,000 $611,000 + 23.4% 64 14 - 77.4% 7 2 - 71.4% Ashland 0 0 -- $0 $0 -- 0 0 -- 3 0 - 100.0% Attleboro 0 2 -- $0 $201,250 -- 0 71 -- 19 13 - 31.6% Bedford 0 0 -- $0 $0 -- 0 0 -- 1 0 - 100.0% Bellingham 0 1 -- $0 $170,000 -- 0 295 -- 3 2 - 33.3% Belmont 3 1 - 66.7% $600,100 $710,000 + 18.3% 91 5 - 94.5% 3 5 + 66.7% Boston 34 36 + 5.9% $443,000 $457,500 + 3.3% 65 25 - 61.5% 126 62 - 50.8% Boxborough 0 0 -- $0 $0 -- 0 0 -- 0 0 -- Brookline 3 3 0.0% $827,000 $1,407,000 + 70.1% 59 5 - 91.5% 8 7 - 12.5% Burlington 0 0 -- $0 $0 -- 0 0 -- 1 0 - 100.0% Cambridge 4 3 - 25.0% $680,270 $1,030,000 + 51.4% 18 6 - 64.8% 11 10 - 9.1% Canton 0 0 -- $0 $0 -- 0 0 -- 0 4 -- Carlisle 0 0 -- $0 $0 -- 0 0 -- 1 0 - 100.0% Chelsea 4 4 0.0% $240,000 $365,000 + 52.1% 71 19 - 72.8% 18 10 - 44.4% Concord 0 0 -- $0 $0 -- 0 0 -- 2 3 + 50.0% Dedham 0 3 -- $0 $395,000 -- 0 14 -- 9 6 - 33.3% Dover 0 0 -- $0 $0 -- 0 0 -- 1 0 - 100.0% Everett 8 8 0.0% $301,500 $353,600 + 17.3% 51 41 - 19.5% 15 23 + 53.3% Foxborough 0 0 -- $0 $0 -- 0 0 -- 1 1 0.0% Framingham 1 2 + 100.0% $234,900 $276,000 + 17.5% 17 6 - 67.6% 8 5 - 37.5% Franklin 1 2 + 100.0% $165,000 $212,500 + 28.8% 165 25 - 85.2% 5 3 - 40.0% Holliston 0 0 -- $0 $0 -- 0 0 -- 1 1 0.0% Hopkinton 0 0 -- $0 $0 -- 0 0 -- 1 1 0.0% Hudson 1 0 - 100.0% $215,000 $0 - 100.0% 11 0 - 100.0% 7 5 - 28.6% Lexington 1 0 - 100.0% $627,000 $0 - 100.0% 18 0 - 100.0% 1 2 + 100.0% Lincoln 0 0 -- $0 $0 -- 0 0 -- 2 0 - 100.0% Malden 12 11 - 8.3% $287,900 $387,000 + 34.4% 41 13 - 69.4% 27 17 - 37.0% Mansfield 0 0 -- $0 $0 -- 0 0 -- 1 3 + 200.0% Marlborough 0 4 -- $0 $204,450 -- 0 51 -- 13 2 - 84.6% Maynard 1 1 0.0% $73,000 $321,000 + 339.7% 33 59 + 78.8% 2 5 + 150.0% Medfield 0 0 -- $0 $0 -- 0 0 -- 3 0 - 100.0% Medford 10 11 + 10.0% $417,500 $525,000 + 25.7% 31 8 - 74.6% 18 12 - 33.3% Medway 0 0 -- $0 $0 -- 0 0 -- 3 1 - 66.7% Milford 2 0 - 100.0% $175,000 $0 - 100.0% 60 0 - 100.0% 13 7 - 46.2% Millis 0 0 -- $0 $0 -- 0 0 -- 1 1 0.0% Milton 2 1 - 50.0% $395,000 $410,000 + 3.8% 142 93 - 34.5% 11 2 - 81.8% Natick 0 2 -- $0 $396,250 -- 0 12 -- 8 4 - 50.0% Needham 1 1 0.0% $651,000 $335,000 - 48.5% 28 85 + 203.6% 3 2 - 33.3% Newton 4 7 + 75.0% $767,500 $675,000 - 12.1% 86 22 - 73.8% 18 9 - 50.0% July 2013 InventoryClosed Sales Days on MarketMedian Sales Price
  • 3. All data from MLS Property Information Network, Inc. Provided by Greater Boston Association of REALTORS®. Powered by 10K Research and Marketing. Multi-Family Housing Activity Report – 2-Family Properties (cont.) 7-2012 7-2013 + / – 7-2012 7-2013 + / – 7-2012 7-2013 + / – 7-2012 7-2013 + / – Norfolk 0 0 -- $0 $0 -- 0 0 -- 1 1 0.0% North Attleboro 0 0 -- $0 $0 -- 0 0 -- 10 6 - 40.0% Norwood 1 2 + 100.0% $329,900 $358,000 + 8.5% 75 14 - 81.3% 6 6 0.0% Plainville 0 0 -- $0 $0 -- 0 0 -- 3 0 - 100.0% Quincy 9 9 0.0% $390,000 $445,000 + 14.1% 48 23 - 52.6% 30 20 - 33.3% Revere 8 11 + 37.5% $317,500 $380,000 + 19.7% 85 20 - 76.9% 37 13 - 64.9% Saugus 2 1 - 50.0% $376,750 $305,000 - 19.0% 32 41 + 30.2% 8 7 - 12.5% Sharon 0 0 -- $0 $0 -- 0 0 -- 2 3 + 50.0% Sherborn 0 0 -- $0 $0 -- 0 0 -- 1 0 - 100.0% Somerville 7 16 + 128.6% $642,000 $723,500 + 12.7% 45 56 + 24.3% 29 12 - 58.6% Southborough 0 0 -- $0 $0 -- 0 0 -- 0 3 -- Stow 0 0 -- $0 $0 -- 0 0 -- 2 0 - 100.0% Sudbury 0 1 -- $0 $490,000 -- 0 278 -- 1 0 - 100.0% Walpole 0 0 -- $0 $0 -- 0 0 -- 4 3 - 25.0% Waltham 3 5 + 66.7% $459,000 $474,166 + 3.3% 34 37 + 8.9% 9 2 - 77.8% Watertown 8 8 0.0% $505,500 $568,250 + 12.4% 32 16 - 50.0% 12 3 - 75.0% Wayland 0 0 -- $0 $0 -- 0 0 -- 2 0 - 100.0% Wellesley 0 1 -- $0 $585,000 -- 0 16 -- 2 1 - 50.0% Weston 0 0 -- $0 $0 -- 0 0 -- 1 0 - 100.0% Westwood 0 0 -- $0 $0 -- 0 0 -- 0 0 -- Winchester 2 1 - 50.0% $547,500 $585,000 + 6.8% 12 7 - 39.1% 7 4 - 42.9% Winthrop 2 1 - 50.0% $287,500 $282,500 - 1.7% 71 39 - 45.1% 3 5 + 66.7% Woburn 2 3 + 50.0% $330,000 $418,000 + 26.7% 101 5 - 94.7% 2 6 + 200.0% Wrentham 0 0 -- $0 $0 -- 0 0 -- 0 1 -- Greater Boston 141 172 +22.0% $400,000 $460,000 +15.0% 56 29 -48.6% 545 327 -40.0% Note: The "Greater Boston" figures are not a compilation or total of the individual areas. Days on Market Inventory July 2013 Closed Sales Median Sales Price
  • 4. All data from MLS Property Information Network, Inc. Provided by Greater Boston Association of REALTORS®. Powered by 10K Research and Marketing. Multi-Family Housing Activity Report – 3-Family Properties 7-2012 7-2013 + / – 7-2012 7-2013 + / – 7-2012 7-2013 + / – 7-2012 7-2013 + / – Acton 0 0 -- $0 $0 -- 0 0 -- 0 0 -- Arlington 0 0 -- $0 $0 -- 0 0 -- 1 0 - 100.0% Ashland 0 0 -- $0 $0 -- 0 0 -- 5 0 - 100.0% Attleboro 0 1 -- $0 $230,000 -- 0 14 -- 13 4 - 69.2% Bedford 0 0 -- $0 $0 -- 0 0 -- 0 0 -- Bellingham 0 0 -- $0 $0 -- 0 0 -- 0 1 -- Belmont 1 0 - 100.0% $789,000 $0 - 100.0% 18 0 - 100.0% 0 0 -- Boston 27 28 + 3.7% $395,000 $445,000 + 12.7% 54 25 - 54.3% 111 69 - 37.8% Boxborough 0 0 -- $0 $0 -- 0 0 -- 0 0 -- Brookline 0 0 -- $0 $0 -- 0 0 -- 3 3 0.0% Burlington 0 0 -- $0 $0 -- 0 0 -- 0 0 -- Cambridge 2 2 0.0% $875,000 $1,174,500 + 34.2% 57 9 - 84.1% 6 7 + 16.7% Canton 0 0 -- $0 $0 -- 0 0 -- 0 1 -- Carlisle 0 0 -- $0 $0 -- 0 0 -- 0 0 -- Chelsea 4 8 + 100.0% $306,000 $297,500 - 2.8% 72 42 - 41.8% 15 6 - 60.0% Concord 0 0 -- $0 $0 -- 0 0 -- 0 0 -- Dedham 0 0 -- $0 $0 -- 0 0 -- 0 0 -- Dover 0 0 -- $0 $0 -- 0 0 -- 0 0 -- Everett 3 4 + 33.3% $333,800 $412,750 + 23.7% 143 18 - 87.4% 16 7 - 56.3% Foxborough 0 0 -- $0 $0 -- 0 0 -- 0 0 -- Framingham 1 0 - 100.0% $285,000 $0 - 100.0% 89 0 - 100.0% 2 2 0.0% Franklin 0 0 -- $0 $0 -- 0 0 -- 3 0 - 100.0% Holliston 0 0 -- $0 $0 -- 0 0 -- 1 1 0.0% Hopkinton 0 0 -- $0 $0 -- 0 0 -- 1 1 0.0% Hudson 0 0 -- $0 $0 -- 0 0 -- 4 2 - 50.0% Lexington 0 0 -- $0 $0 -- 0 0 -- 0 1 -- Lincoln 0 1 -- $0 $108,500 -- 0 15 -- 0 0 -- Malden 5 3 - 40.0% $340,000 $440,000 + 29.4% 96 32 - 66.9% 3 6 + 100.0% Mansfield 0 0 -- $0 $0 -- 0 0 -- 0 1 -- Marlborough 1 2 + 100.0% $165,000 $202,400 + 22.7% 40 5 - 87.5% 4 2 - 50.0% Maynard 1 0 - 100.0% $248,625 $0 - 100.0% 374 0 - 100.0% 0 2 -- Medfield 0 0 -- $0 $0 -- 0 0 -- 0 0 -- Medford 2 0 - 100.0% $437,500 $0 - 100.0% 81 0 - 100.0% 3 3 0.0% Medway 0 0 -- $0 $0 -- 0 0 -- 0 0 -- Milford 0 0 -- $0 $0 -- 0 0 -- 3 2 - 33.3% Millis 0 0 -- $0 $0 -- 0 0 -- 0 0 -- Milton 0 0 -- $0 $0 -- 0 0 -- 1 2 + 100.0% Natick 1 0 - 100.0% $480,000 $0 - 100.0% 25 0 - 100.0% 0 0 -- Needham 0 0 -- $0 $0 -- 0 0 -- 2 0 - 100.0% Newton 0 0 -- $0 $0 -- 0 0 -- 2 0 - 100.0% July 2013 Closed Sales Median Sales Price Days on Market Inventory
  • 5. All data from MLS Property Information Network, Inc. Provided by Greater Boston Association of REALTORS®. Powered by 10K Research and Marketing. Multi-Family Housing Activity Report – 3-Family Properties (cont.) 7-2012 7-2013 + / – 7-2012 7-2013 + / – 7-2012 7-2013 + / – 7-2012 7-2013 + / – Norfolk 0 0 -- $0 $0 -- 0 0 -- 0 0 -- North Attleboro 0 1 -- $0 $305,000 -- 0 29 -- 4 3 -25.0% Norwood 1 0 -100.0% $353,500 $0 -100.0% 283 0 -100.0% 1 1 0.0% Plainville 0 0 -- $0 $0 -- 0 0 -- 0 1 -- Quincy 1 1 0.0% $490,000 $525,000 +7.1% 21 9 -57.1% 4 6 +50.0% Revere 0 1 -- $0 $402,000 -- 0 24 -- 5 3 -40.0% Saugus 0 0 -- $0 $0 -- 0 0 -- 1 0 -100.0% Sharon 0 0 -- $0 $0 -- 0 0 -- 0 0 -- Sherborn 0 0 -- $0 $0 -- 0 0 -- 0 0 -- Somerville 2 2 0.0% $463,500 $729,000 +57.3% 16 2 -90.6% 8 6 -25.0% Southborough 0 0 -- $0 $0 -- 0 0 -- 0 0 -- Stow 0 0 -- $0 $0 -- 0 0 -- 0 0 -- Sudbury 0 0 -- $0 $0 -- 0 0 -- 0 0 -- Walpole 0 0 -- $0 $0 -- 0 0 -- 1 1 0.0% Waltham 0 1 -- $0 $484,900 -- 0 88 -- 1 2 +100.0% Watertown 0 0 -- $0 $0 -- 0 0 -- 2 2 0.0% Wayland 0 0 -- $0 $0 -- 0 0 -- 0 0 -- Wellesley 0 0 -- $0 $0 -- 0 0 -- 0 0 -- Weston 0 0 -- $0 $0 -- 0 0 -- 0 0 -- Westwood 0 0 -- $0 $0 -- 0 0 -- 0 0 -- Winchester 0 0 -- $0 $0 -- 0 0 -- 0 0 -- Winthrop 0 0 -- $0 $0 -- 0 0 -- 2 2 0.0% Woburn 0 0 -- $0 $0 -- 0 0 -- 1 0 -100.0% Wrentham 0 0 -- $0 $0 -- 0 0 -- 1 1 0.0% Greater Boston 52 55 +5.8% $387,500 $422,500 +9.0% 73 26 -65.2% 224 146 -34.8% Note: The "Greater Boston" figures are not a compilation or total of the individual areas. Closed Sales Median Sales Price Days on Market Inventory July 2013
  • 6. All data from MLS Property Information Network, Inc. Provided by Greater Boston Association of REALTORS®. Powered by 10K Research and Marketing. Multi-Family Housing Activity Report – 4-Family Properties 7-2012 7-2013 + / – 7-2012 7-2013 + / – 7-2012 7-2013 + / – 7-2012 7-2013 + / – Acton 0 0 -- $0 $0 -- 0 0 -- 0 0 -- Arlington 0 0 -- $0 $0 -- 0 0 -- 0 0 -- Ashland 0 0 -- $0 $0 -- 0 0 -- 0 0 -- Attleboro 0 0 -- $0 $0 -- 0 0 -- 3 1 - 66.7% Bedford 0 0 -- $0 $0 -- 0 0 -- 0 0 -- Bellingham 0 0 -- $0 $0 -- 0 0 -- 0 0 -- Belmont 0 0 -- $0 $0 -- 0 0 -- 0 0 -- Boston 5 4 - 20.0% $1,437,500 $985,000 - 31.5% 88 61 - 31.4% 8 6 - 25.0% Boxborough 0 0 -- $0 $0 -- 0 0 -- 0 0 -- Brookline 0 0 -- $0 $0 -- 0 0 -- 0 0 -- Burlington 0 0 -- $0 $0 -- 0 0 -- 0 0 -- Cambridge 1 1 0.0% $1,062,500 $1,800,000 + 69.4% 199 41 - 79.4% 1 1 0.0% Canton 0 0 -- $0 $0 -- 0 0 -- 0 0 -- Carlisle 0 0 -- $0 $0 -- 0 0 -- 0 0 -- Chelsea 1 0 - 100.0% $343,000 $0 - 100.0% 138 0 - 100.0% 0 2 -- Concord 0 0 -- $0 $0 -- 0 0 -- 0 0 -- Dedham 0 0 -- $0 $0 -- 0 0 -- 0 0 -- Dover 0 0 -- $0 $0 -- 0 0 -- 0 0 -- Everett 1 0 - 100.0% $425,000 $0 - 100.0% 54 0 - 100.0% 0 1 -- Foxborough 0 0 -- $0 $0 -- 0 0 -- 0 0 -- Framingham 0 0 -- $0 $0 -- 0 0 -- 0 1 -- Franklin 0 0 -- $0 $0 -- 0 0 -- 0 1 -- Holliston 0 0 -- $0 $0 -- 0 0 -- 4 0 - 100.0% Hopkinton 0 0 -- $0 $0 -- 0 0 -- 0 0 -- Hudson 0 0 -- $0 $0 -- 0 0 -- 0 0 -- Lexington 0 0 -- $0 $0 -- 0 0 -- 0 0 -- Lincoln 0 0 -- $0 $0 -- 0 0 -- 0 0 -- Malden 0 0 -- $0 $0 -- 0 0 -- 1 0 - 100.0% Mansfield 0 0 -- $0 $0 -- 0 0 -- 0 1 -- Marlborough 1 0 - 100.0% $350,000 $0 - 100.0% 22 0 - 100.0% 3 2 - 33.3% Maynard 0 0 -- $0 $0 -- 0 0 -- 0 0 -- Medfield 0 0 -- $0 $0 -- 0 0 -- 0 1 -- Medford 0 0 -- $0 $0 -- 0 0 -- 0 0 -- Medway 0 0 -- $0 $0 -- 0 0 -- 0 0 -- Milford 0 0 -- $0 $0 -- 0 0 -- 1 1 0.0% Millis 0 0 -- $0 $0 -- 0 0 -- 0 0 -- Milton 0 0 -- $0 $0 -- 0 0 -- 0 0 -- Natick 0 0 -- $0 $0 -- 0 0 -- 0 0 -- Needham 0 0 -- $0 $0 -- 0 0 -- 0 0 -- Newton 0 0 -- $0 $0 -- 0 0 -- 3 1 - 66.7% July 2013 Closed Sales Median Sales Price Days on Market Inventory
  • 7. All data from MLS Property Information Network, Inc. Provided by Greater Boston Association of REALTORS®. Powered by 10K Research and Marketing. Multi-Family Housing Activity Report – 4-Family Properties (cont.) 7-2012 7-2013 + / – 7-2012 7-2013 + / – 7-2012 7-2013 + / – 7-2012 7-2013 + / – Norfolk 0 0 -- $0 $0 -- 0 0 -- 0 1 -- North Attleboro 0 0 -- $0 $0 -- 0 0 -- 0 1 -- Norwood 0 0 -- $0 $0 -- 0 0 -- 0 1 -- Plainville 0 1 -- $0 $320,000 -- 0 607 -- 2 0 -100.0% Quincy 3 1 -66.7% $570,000 $556,000 -2.5% 14 5 -64.3% 4 3 -25.0% Revere 0 1 -- $0 $355,000 -- 0 20 -- 1 2 +100.0% Saugus 0 0 -- $0 $0 -- 0 0 -- 0 0 -- Sharon 0 0 -- $0 $0 -- 0 0 -- 0 0 -- Sherborn 0 0 -- $0 $0 -- 0 0 -- 0 0 -- Somerville 1 0 -100.0% $1,180,000 $0 -100.0% 58 0 -100.0% 4 1 -75.0% Southborough 0 0 -- $0 $0 -- 0 0 -- 0 0 -- Stow 0 0 -- $0 $0 -- 0 0 -- 0 0 -- Sudbury 0 0 -- $0 $0 -- 0 0 -- 0 0 -- Walpole 0 0 -- $0 $0 -- 0 0 -- 0 0 -- Waltham 0 1 -- $0 $675,000 -- 0 23 -- 0 1 -- Watertown 0 0 -- $0 $0 -- 0 0 -- 0 0 -- Wayland 0 0 -- $0 $0 -- 0 0 -- 0 0 -- Wellesley 0 0 -- $0 $0 -- 0 0 -- 0 0 -- Weston 0 0 -- $0 $0 -- 0 0 -- 0 0 -- Westwood 0 0 -- $0 $0 -- 0 0 -- 0 0 -- Winchester 0 0 -- $0 $0 -- 0 0 -- 0 0 -- Winthrop 0 0 -- $0 $0 -- 0 0 -- 0 0 -- Woburn 0 0 -- $0 $0 -- 0 0 -- 1 0 -100.0% Wrentham 0 0 -- $0 $0 -- 0 0 -- 0 0 -- Greater Boston 13 9 -30.8% $570,000 $675,000 +18.4% 73 104 +42.0% 35 27 -22.9% Note: The "Greater Boston" figures are not a compilation or total of the individual areas. Closed Sales Median Sales Price Days on Market Inventory July 2013