September 2014 Multi-family Housing Activity Report – Boston, MA Real Estate
•
1 like•298 views

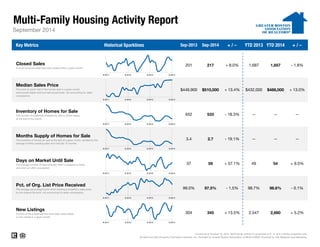
Here’s September 2014′s Monthly Multi-family Housing Activity Report from the Greater Boston Association of Realtors®. (Multi-family housing activity comparing September 2014 to September 2013) • Closed sales were up +8.0% • Median prices were up +13.4% • Inventory of Homes for Sale were down -18.3% • Months Supply of Home for Sale were down -19.1% • Days on market until sale were up +57.1% • Percentage of original list price received were down -1.5% • New Listings were up +13.5%

Recommended
Recommended
More Related Content
What's hot
What's hot (20)
Viewers also liked
Viewers also liked (12)
Similar to September 2014 Multi-family Housing Activity Report – Boston, MA Real Estate
Similar to September 2014 Multi-family Housing Activity Report – Boston, MA Real Estate (12)
More from Unit Realty Group
More from Unit Realty Group (17)
Recently uploaded
Recently uploaded (20)
September 2014 Multi-family Housing Activity Report – Boston, MA Real Estate
- 1. Multi-Family Housing Activity Report Key Metrics Historical Sparklines Sep-2013 Sep-2014 + / – YTD 2013 YTD 2014 + / – 1,657 - 1.8% Median Sales PriceThe point at which half of the homes sold in a given monthwere priced higher and one half priced lower, not accounting for seller concessions. $449,900 1,687 September 2014 Closed SalesA count of actual sales that have closed within a given month. 201 217 + 8.0% -- $510,000 + 13.4% $432,000 $488,000 + 13.0% -- -- -- - 19.1% Inventory of Homes for SaleThe number of properties available for sale in active statusat the end of the month. 652 533 - 18.3% -- Days on Market Until Sale The average number of days between when a property is listedand when an offer is accepted. 37 59 + 57.1% 49 54 98.6% Current as of October 16, 2014. Multi-family activity is comprised of 2-, 3- and 4-family properties only. All data from MLS Property Information Network, Inc. Provided by Greater Boston Association of REALTORS®. Powered by 10K Research and Marketing. -- - 0.1% New Listings A count of the properties that have been newly listedon the market in a given month. 304 345 + 13.5% 2,547 2,680 + 5.2% + 9.5% Months Supply of Homes for SaleThe inventory of homes for sale at the end of a given month, divided by the average monthly pending sales from the last 12 months. 3.4 2.7 Pct. of Org. List Price ReceivedThe average percentage found when dividing a property's sales priceby the original list price, not accounting for seller concessions. 99.0% 97.5% - 1.5% 98.7% 9-2011 9-2012 9-2013 9-2014 9-2011 9-2012 9-2013 9-2014 9-2011 9-2012 9-2013 9-2014 9-2011 9-2012 9-2013 9-2014 9-2011 9-2012 9-2013 9-2014 9-2011 9-2012 9-2013 9-2014 9-2011 9-2012 9-2013 9-2014 5B 4B
- 2. All data from MLS Property Information Network, Inc. Provided by Greater Boston Association of REALTORS®. Powered by 10K Research and Marketing. Multi-Family Housing Activity Report – 2-Family Properties 9-2013 9-2014 + / – 9-2013 9-2014 + / – 9-2013 9-2014 + / – 9-2013 9-2014 + / – Acton 1 0 - 100.0% $375,000 $0 - 100.0% 81 0 - 100.0% 1 0 - 100.0% Arlington 1 6 + 500.0% $661,000 $732,500 + 10.8% 6 25 + 322.2% 4 2 - 50.0% Ashland 0 1 -- $0 $350,000 -- 0 64 -- 1 0 - 100.0% Attleboro 4 4 0.0% $192,950 $140,000 - 27.4% 140 115 - 17.7% 13 8 - 38.5% Bedford 0 1 -- $0 $510,000 -- 0 12 -- 0 0 -- Bellingham 0 2 -- $0 $235,000 -- 0 50 -- 2 1 - 50.0% Belmont 3 0 - 100.0% $718,000 $0 - 100.0% 6 0 - 100.0% 9 3 - 66.7% Boston 34 28 - 17.6% $445,750 $530,000 + 18.9% 20 56 + 178.6% 103 71 - 31.1% Boxborough 0 0 -- $0 $0 -- 0 0 -- 0 0 -- Brookline 2 1 - 50.0% $1,305,000 $1,525,000 + 16.9% 50 47 - 5.1% 4 0 - 100.0% Burlington 0 0 -- $0 $0 -- 0 0 -- 0 0 -- Cambridge 4 7 + 75.0% $821,500 $845,000 + 2.9% 26 49 + 88.5% 10 13 + 30.0% Canton 1 0 - 100.0% $302,500 $0 - 100.0% 16 0 - 100.0% 2 8 + 300.0% Carlisle 0 0 -- $0 $0 -- 0 0 -- 0 0 -- Chelsea 3 3 0.0% $267,500 $405,000 + 51.4% 31 30 - 1.1% 10 10 0.0% Concord 0 1 -- $0 $540,000 -- 0 62 -- 3 1 - 66.7% Dedham 5 2 - 60.0% $320,000 $542,500 + 69.5% 108 82 - 23.9% 5 5 0.0% Dover 0 0 -- $0 $0 -- 0 0 -- 0 0 -- Everett 11 6 - 45.5% $360,000 $335,000 - 6.9% 30 37 + 21.3% 22 11 - 50.0% Foxborough 0 0 -- $0 $0 -- 0 0 -- 5 3 - 40.0% Framingham 4 2 - 50.0% $265,000 $276,500 + 4.3% 8 75 + 837.5% 9 7 - 22.2% Franklin 2 0 - 100.0% $279,000 $0 - 100.0% 40 0 - 100.0% 2 6 + 200.0% Holliston 0 0 -- $0 $0 -- 0 0 -- 0 0 -- Hopkinton 0 0 -- $0 $0 -- 0 0 -- 0 0 -- Hudson 0 1 -- $0 $232,000 -- 0 67 -- 6 3 - 50.0% Lexington 1 1 0.0% $628,000 $827,500 + 31.8% 32 34 + 6.3% 2 0 - 100.0% Lincoln 0 0 -- $0 $0 -- 0 0 -- 0 0 -- Malden 10 7 - 30.0% $422,500 $480,000 + 13.6% 24 31 + 25.3% 27 21 - 22.2% Mansfield 2 1 - 50.0% $263,000 $321,500 + 22.2% 125 98 - 21.6% 2 4 + 100.0% Marlborough 0 0 -- $0 $0 -- 0 0 -- 17 5 - 70.6% Maynard 1 1 0.0% $239,000 $205,000 - 14.2% 45 64 + 42.2% 3 2 - 33.3% Medfield 0 0 -- $0 $0 -- 0 0 -- 0 0 -- Medford 9 10 + 11.1% $485,000 $535,500 + 10.4% 25 36 + 43.8% 14 12 - 14.3% Medway 0 0 -- $0 $0 -- 0 0 -- 1 0 - 100.0% Milford 1 3 + 200.0% $165,000 $270,000 + 63.6% 106 62 - 41.5% 9 4 - 55.6% Millis 0 0 -- $0 $0 -- 0 0 -- 1 0 - 100.0% Milton 1 2 + 100.0% $625,000 $512,500 - 18.0% 14 57 + 307.1% 5 8 + 60.0% Natick 0 0 -- $0 $0 -- 0 0 -- 7 4 - 42.9% Needham 0 0 -- $0 $0 -- 0 0 -- 0 1 -- Newton 4 8 + 100.0% $748,500 $745,000 - 0.5% 36 76 + 110.1% 11 13 + 18.2% September 2014 Inventory Closed Sales Days on Market Median Sales Price
- 3. All data from MLS Property Information Network, Inc. Provided by Greater Boston Association of REALTORS®. Powered by 10K Research and Marketing. Multi-Family Housing Activity Report – 2-Family Properties (cont.) 9-2013 9-2014 + / – 9-2013 9-2014 + / – 9-2013 9-2014 + / – 9-2013 9-2014 + / – Norfolk 0 0 -- $0 $0 -- 0 0 -- 1 1 0.0% North Attleboro 0 1 -- $0 $206,000 -- 0 131 -- 4 4 0.0% Norwood 2 3 + 50.0% $449,500 $455,000 + 1.2% 5 23 + 418.5% 5 8 + 60.0% Plainville 0 0 -- $0 $0 -- 0 0 -- 0 3 -- Quincy 9 10 + 11.1% $519,000 $473,500 - 8.8% 37 48 + 30.5% 19 22 + 15.8% Revere 3 9 + 200.0% $355,000 $400,000 + 12.7% 50 167 + 236.2% 27 18 - 33.3% Saugus 2 1 - 50.0% $370,500 $270,000 - 27.1% 98 121 + 23.5% 6 2 - 66.7% Sharon 3 0 - 100.0% $352,500 $0 - 100.0% 104 0 - 100.0% 2 3 + 50.0% Sherborn 0 0 -- $0 $0 -- 0 0 -- 0 0 -- Somerville 9 9 0.0% $638,000 $755,000 + 18.3% 22 42 + 93.8% 18 11 - 38.9% Southborough 1 0 - 100.0% $320,500 $0 - 100.0% 141 0 - 100.0% 1 2 + 100.0% Stow 0 0 -- $0 $0 -- 0 0 -- 0 1 -- Sudbury 0 0 -- $0 $0 -- 0 0 -- 0 0 -- Walpole 0 0 -- $0 $0 -- 0 0 -- 3 1 - 66.7% Waltham 2 4 + 100.0% $448,750 $517,500 + 15.3% 92 63 - 31.5% 4 6 + 50.0% Watertown 3 7 + 133.3% $727,000 $595,000 - 18.2% 18 24 + 38.3% 11 6 - 45.5% Wayland 0 0 -- $0 $0 -- 0 0 -- 0 1 -- Wellesley 0 0 -- $0 $0 -- 0 0 -- 2 0 - 100.0% Weston 0 0 -- $0 $0 -- 0 0 -- 0 1 -- Westwood 0 0 -- $0 $0 -- 0 0 -- 1 0 - 100.0% Winchester 1 1 0.0% $575,000 $800,000 + 39.1% 0 16 -- 2 0 - 100.0% Winthrop 2 6 + 200.0% $434,300 $424,500 - 2.3% 40 56 + 38.8% 9 6 - 33.3% Woburn 0 3 -- $0 $435,000 -- 0 26 -- 6 11 + 83.3% Wrentham 0 0 -- $0 $0 -- 0 0 -- 0 0 -- Greater Boston 141 152 +7.8% $437,500 $498,000 +13.8% 38 57 +50.9% 431 333 -22.7% Note: The "Greater Boston" figures are not a compilation or total of the individual areas. Days on Market Inventory September 2014 Closed Sales Median Sales Price
- 4. All data from MLS Property Information Network, Inc. Provided by Greater Boston Association of REALTORS®. Powered by 10K Research and Marketing. Multi-Family Housing Activity Report – 3-Family Properties 9-2013 9-2014 + / – 9-2013 9-2014 + / – 9-2013 9-2014 + / – 9-2013 9-2014 + / – Acton 0 0 -- $0 $0 -- 0 0 -- 0 0 -- Arlington 0 0 -- $0 $0 -- 0 0 -- 0 1 -- Ashland 1 0 - 100.0% $250,000 $0 - 100.0% 115 0 - 100.0% 0 2 -- Attleboro 1 2 + 100.0% $130,000 $292,750 + 125.2% 98 7 - 93.4% 6 3 - 50.0% Bedford 0 0 -- $0 $0 -- 0 0 -- 0 0 -- Bellingham 0 0 -- $0 $0 -- 0 0 -- 0 2 -- Belmont 0 0 -- $0 $0 -- 0 0 -- 0 0 -- Boston 30 26 - 13.3% $453,000 $527,000 + 16.3% 32 29 - 11.7% 90 74 - 17.8% Boxborough 0 0 -- $0 $0 -- 0 0 -- 0 0 -- Brookline 0 0 -- $0 $0 -- 0 0 -- 3 0 - 100.0% Burlington 0 0 -- $0 $0 -- 0 0 -- 0 0 -- Cambridge 4 2 - 50.0% $1,204,600 $1,380,000 + 14.6% 24 81 + 242.6% 3 5 + 66.7% Canton 0 0 -- $0 $0 -- 0 0 -- 1 0 - 100.0% Carlisle 0 0 -- $0 $0 -- 0 0 -- 0 0 -- Chelsea 2 2 0.0% $373,000 $428,000 + 14.7% 33 44 + 35.4% 13 11 - 15.4% Concord 0 0 -- $0 $0 -- 0 0 -- 0 0 -- Dedham 0 0 -- $0 $0 -- 0 0 -- 0 0 -- Dover 0 0 -- $0 $0 -- 0 0 -- 0 0 -- Everett 2 2 0.0% $465,000 $410,000 - 11.8% 10 51 + 410.0% 11 12 + 9.1% Foxborough 0 0 -- $0 $0 -- 0 0 -- 0 1 -- Framingham 2 1 - 50.0% $332,250 $403,000 + 21.3% 18 12 - 33.3% 3 1 - 66.7% Franklin 0 0 -- $0 $0 -- 0 0 -- 0 1 -- Holliston 0 0 -- $0 $0 -- 0 0 -- 1 0 - 100.0% Hopkinton 0 0 -- $0 $0 -- 0 0 -- 1 0 - 100.0% Hudson 0 0 -- $0 $0 -- 0 0 -- 3 3 0.0% Lexington 0 0 -- $0 $0 -- 0 0 -- 2 0 - 100.0% Lincoln 0 0 -- $0 $0 -- 0 0 -- 0 0 -- Malden 2 4 + 100.0% $501,500 $551,000 + 9.9% 8 103 + 1,187.5% 6 9 + 50.0% Mansfield 0 0 -- $0 $0 -- 0 0 -- 1 0 - 100.0% Marlborough 0 0 -- $0 $0 -- 0 0 -- 5 3 - 40.0% Maynard 1 0 - 100.0% $310,000 $0 - 100.0% 46 0 - 100.0% 0 0 -- Medfield 0 0 -- $0 $0 -- 0 0 -- 0 0 -- Medford 0 1 -- $0 $575,000 -- 0 15 -- 1 4 + 300.0% Medway 0 1 -- $0 $300,000 -- 0 69 -- 0 0 -- Milford 0 0 -- $0 $0 -- 0 0 -- 3 1 - 66.7% Millis 0 0 -- $0 $0 -- 0 0 -- 0 0 -- Milton 0 0 -- $0 $0 -- 0 0 -- 1 0 - 100.0% Natick 0 0 -- $0 $0 -- 0 0 -- 0 1 -- Needham 1 0 - 100.0% $515,000 $0 - 100.0% 21 0 - 100.0% 0 0 -- Newton 0 0 -- $0 $0 -- 0 0 -- 1 0 - 100.0% September 2014 Closed Sales Median Sales Price Days on Market Inventory
- 5. All data from MLS Property Information Network, Inc. Provided by Greater Boston Association of REALTORS®. Powered by 10K Research and Marketing. Multi-Family Housing Activity Report – 3-Family Properties (cont.) 9-2013 9-2014 + / – 9-2013 9-2014 + / – 9-2013 9-2014 + / – 9-2013 9-2014 + / – Norfolk 0 0 -- $0 $0 -- 0 0 -- 0 1 -- North Attleboro 0 2 -- $0 $237,500 -- 0 152 -- 3 5 +66.7% Norwood 1 1 0.0% $385,000 $517,000 +34.3% 25 93 +272.0% 1 1 0.0% Plainville 0 0 -- $0 $0 -- 0 0 -- 0 1 -- Quincy 1 2 +100.0% $627,000 $557,500 -11.1% 8 157 +1856.3% 4 5 +25.0% Revere 0 1 -- $0 $357,000 -- 0 115 -- 3 5 +66.7% Saugus 0 0 -- $0 $0 -- 0 0 -- 0 0 -- Sharon 0 0 -- $0 $0 -- 0 0 -- 0 0 -- Sherborn 0 0 -- $0 $0 -- 0 0 -- 0 0 -- Somerville 2 5 +150.0% $705,000 $1,005,000 +42.6% 140 52 -62.9% 8 10 +25.0% Southborough 0 0 -- $0 $0 -- 0 0 -- 0 0 -- Stow 0 0 -- $0 $0 -- 0 0 -- 0 0 -- Sudbury 0 0 -- $0 $0 -- 0 0 -- 0 0 -- Walpole 0 0 -- $0 $0 -- 0 0 -- 2 0 -100.0% Waltham 0 0 -- $0 $0 -- 0 0 -- 3 1 -66.7% Watertown 0 2 -- $0 $834,750 -- 0 41 -- 1 2 +100.0% Wayland 0 0 -- $0 $0 -- 0 0 -- 0 0 -- Wellesley 0 1 -- $0 $1,070,000 -- 0 44 -- 0 0 -- Weston 0 0 -- $0 $0 -- 0 0 -- 0 0 -- Westwood 0 0 -- $0 $0 -- 0 0 -- 0 0 -- Winchester 0 0 -- $0 $0 -- 0 0 -- 0 0 -- Winthrop 0 0 -- $0 $0 -- 0 0 -- 1 3 +200.0% Woburn 0 0 -- $0 $0 -- 0 0 -- 0 0 -- Wrentham 1 0 -100.0% $358,000 $0 -100.0% 0 0 -- 0 0 -- Greater Boston 51 55 +7.8% $450,000 $539,000 +19.8% 36 51 +43.0% 181 168 -7.2% Note: The "Greater Boston" figures are not a compilation or total of the individual areas. Closed Sales Median Sales Price Days on Market Inventory September 2014
- 6. All data from MLS Property Information Network, Inc. Provided by Greater Boston Association of REALTORS®. Powered by 10K Research and Marketing. Multi-Family Housing Activity Report – 4-Family Properties 9-2013 9-2014 + / – 9-2013 9-2014 + / – 9-2013 9-2014 + / – 9-2013 9-2014 + / – Acton 0 0 -- $0 $0 -- 0 0 -- 0 0 -- Arlington 0 0 -- $0 $0 -- 0 0 -- 1 0 - 100.0% Ashland 0 0 -- $0 $0 -- 0 0 -- 0 1 -- Attleboro 0 0 -- $0 $0 -- 0 0 -- 1 0 - 100.0% Bedford 0 0 -- $0 $0 -- 0 0 -- 0 0 -- Bellingham 0 0 -- $0 $0 -- 0 0 -- 0 0 -- Belmont 0 0 -- $0 $0 -- 0 0 -- 0 0 -- Boston 7 1 - 85.7% $1,085,000 $565,000 - 47.9% 25 149 + 496.0% 10 11 + 10.0% Boxborough 0 0 -- $0 $0 -- 0 0 -- 0 0 -- Brookline 0 0 -- $0 $0 -- 0 0 -- 1 0 - 100.0% Burlington 0 0 -- $0 $0 -- 0 0 -- 0 0 -- Cambridge 0 1 -- $0 $1,100,000 -- 0 16 -- 0 0 -- Canton 0 0 -- $0 $0 -- 0 0 -- 0 0 -- Carlisle 0 0 -- $0 $0 -- 0 0 -- 0 0 -- Chelsea 0 1 -- $0 $550,000 -- 0 98 -- 4 1 - 75.0% Concord 0 0 -- $0 $0 -- 0 0 -- 0 0 -- Dedham 0 0 -- $0 $0 -- 0 0 -- 0 0 -- Dover 0 0 -- $0 $0 -- 0 0 -- 0 0 -- Everett 0 0 -- $0 $0 -- 0 0 -- 2 3 + 50.0% Foxborough 0 0 -- $0 $0 -- 0 0 -- 0 0 -- Framingham 0 0 -- $0 $0 -- 0 0 -- 0 1 -- Franklin 0 0 -- $0 $0 -- 0 0 -- 0 0 -- Holliston 0 0 -- $0 $0 -- 0 0 -- 0 0 -- Hopkinton 0 0 -- $0 $0 -- 0 0 -- 0 0 -- Hudson 0 0 -- $0 $0 -- 0 0 -- 0 0 -- Lexington 0 0 -- $0 $0 -- 0 0 -- 1 0 - 100.0% Lincoln 0 0 -- $0 $0 -- 0 0 -- 0 0 -- Malden 0 0 -- $0 $0 -- 0 0 -- 0 1 -- Mansfield 0 0 -- $0 $0 -- 0 0 -- 1 0 - 100.0% Marlborough 0 1 -- $0 $190,000 -- 0 13 -- 1 0 - 100.0% Maynard 0 0 -- $0 $0 -- 0 0 -- 0 0 -- Medfield 0 1 -- $0 $335,000 -- 0 382 -- 1 0 - 100.0% Medford 0 0 -- $0 $0 -- 0 0 -- 0 0 -- Medway 0 0 -- $0 $0 -- 0 0 -- 0 0 -- Milford 0 0 -- $0 $0 -- 0 0 -- 0 0 -- Millis 0 0 -- $0 $0 -- 0 0 -- 0 0 -- Milton 0 0 -- $0 $0 -- 0 0 -- 0 0 -- Natick 0 0 -- $0 $0 -- 0 0 -- 0 0 -- Needham 0 0 -- $0 $0 -- 0 0 -- 0 0 -- Newton 0 0 -- $0 $0 -- 0 0 -- 1 0 - 100.0% September 2014 Closed Sales Median Sales Price Days on Market Inventory
- 7. All data from MLS Property Information Network, Inc. Provided by Greater Boston Association of REALTORS®. Powered by 10K Research and Marketing. Multi-Family Housing Activity Report – 4-Family Properties (cont.) 9-2013 9-2014 + / – 9-2013 9-2014 + / – 9-2013 9-2014 + / – 9-2013 9-2014 + / – Norfolk 0 0 -- $0 $0 -- 0 0 -- 1 0 -100.0% North Attleboro 0 3 -- $0 $510,000 -- 0 156 -- 5 1 -80.0% Norwood 0 0 -- $0 $0 -- 0 0 -- 1 0 -100.0% Plainville 0 0 -- $0 $0 -- 0 0 -- 0 0 -- Quincy 1 1 0.0% $520,000 $800,000 +53.8% 72 49 -31.9% 2 4 +100.0% Revere 1 0 -100.0% $328,800 $0 -100.0% 67 0 -100.0% 2 1 -50.0% Saugus 0 0 -- $0 $0 -- 0 0 -- 0 0 -- Sharon 0 0 -- $0 $0 -- 0 0 -- 0 0 -- Sherborn 0 0 -- $0 $0 -- 0 0 -- 0 0 -- Somerville 0 1 -- $0 $880,000 -- 0 14 -- 2 5 +150.0% Southborough 0 0 -- $0 $0 -- 0 0 -- 0 0 -- Stow 0 0 -- $0 $0 -- 0 0 -- 0 0 -- Sudbury 0 0 -- $0 $0 -- 0 0 -- 0 0 -- Walpole 0 0 -- $0 $0 -- 0 0 -- 0 0 -- Waltham 0 0 -- $0 $0 -- 0 0 -- 2 1 -50.0% Watertown 0 0 -- $0 $0 -- 0 0 -- 1 0 -100.0% Wayland 0 0 -- $0 $0 -- 0 0 -- 0 0 -- Wellesley 0 0 -- $0 $0 -- 0 0 -- 0 0 -- Weston 0 0 -- $0 $0 -- 0 0 -- 0 0 -- Westwood 0 0 -- $0 $0 -- 0 0 -- 0 0 -- Winchester 0 0 -- $0 $0 -- 0 0 -- 0 0 -- Winthrop 0 0 -- $0 $0 -- 0 0 -- 0 1 -- Woburn 0 0 -- $0 $0 -- 0 0 -- 0 1 -- Wrentham 0 0 -- $0 $0 -- 0 0 -- 0 0 -- Greater Boston 9 10 +11.1% $552,000 $530,000 -4.0% 35 119 +240.8% 40 32 -20.0% Note: The "Greater Boston" figures are not a compilation or total of the individual areas. Closed Sales Median Sales Price Days on Market Inventory September 2014