August 2013 Multifamily Housing Activity Report – Boston, MA Real Estate
•
0 likes•279 views

Here’s Augusts 2013′s Monthly Multifamily Housing Activity Report from the Greater Boston Association of Realtors®.

Recommended
Recommended
More Related Content
Similar to August 2013 Multifamily Housing Activity Report – Boston, MA Real Estate
Similar to August 2013 Multifamily Housing Activity Report – Boston, MA Real Estate (15)
More from Unit Realty Group
More from Unit Realty Group (20)
Recently uploaded
Recently uploaded (20)
August 2013 Multifamily Housing Activity Report – Boston, MA Real Estate
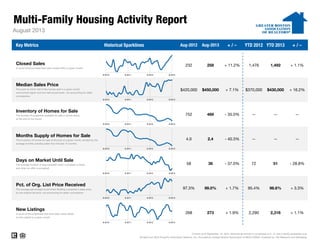
- 1. Multi-Family Housing Activity Report Key Metrics Historical Sparklines Aug-2012 Aug-2013 + / – YTD 2012 YTD 2013 + / – Pct. of Org. List Price Received The average percentage found when dividing a property's sales price by the original list price, not accounting for seller concessions. 97.3% 99.0% + 1.7% 95.4% 51 98.6% Current as of September 19, 2013. Multi-family activity is comprised of 2-, 3- and 4-family properties only. All data from MLS Property Information Network, Inc. Provided by Greater Boston Association of REALTORS®. Powered by 10K Research and Marketing. -- + 3.3% New Listings A count of the properties that have been newly listed on the market in a given month. 268 273 + 1.9% 2,290 2,316 + 1.1% - 28.8% Months Supply of Homes for Sale The inventory of homes for sale at the end of a given month, divided by the average monthly pending sales from the last 12 months. 4.0 2.4 Days on Market Until Sale The average number of days between when a property is listed and when an offer is accepted. 58 36 - 37.0% 72 Inventory of Homes for Sale The number of properties available for sale in active status at the end of the month. 752 489 - 35.0% -- -- $450,000 + 7.1% $370,000 $430,000 + 16.2% -- -- --- 40.3% August 2013 Closed Sales A count of actual sales that have closed within a given month. 232 258 + 11.2% 1,492 + 1.1% Median Sales Price The point at which half of the homes sold in a given month were priced higher and one half priced lower, not accounting for seller concessions. $420,000 1,476 8-2010 8-2011 8-2012 8-2013 8-2010 8-2011 8-2012 8-2013 8-2010 8-2011 8-2012 8-2013 8-2010 8-2011 8-2012 8-2013 8-2010 8-2011 8-2012 8-2013 8-2010 8-2011 8-2012 8-2013 8-2010 8-2011 8-2012 8-2013 5B5B
- 2. All data from MLS Property Information Network, Inc. Provided by Greater Boston Association of REALTORS®. Powered by 10K Research and Marketing. Multi-Family Housing Activity Report – 2-Family Properties 8-2012 8-2013 + / – 8-2012 8-2013 + / – 8-2012 8-2013 + / – 8-2012 8-2013 + / – Acton 0 0 -- $0 $0 -- 0 0 -- 1 1 0.0% Arlington 3 5 + 66.7% $569,000 $595,000 + 4.6% 6 9 + 65.9% 5 2 - 60.0% Ashland 0 1 -- $0 $418,900 -- 0 40 -- 3 0 - 100.0% Attleboro 2 2 0.0% $215,000 $294,950 + 37.2% 220 17 - 92.3% 21 13 - 38.1% Bedford 0 1 -- $0 $355,000 -- 0 21 -- 1 0 - 100.0% Bellingham 1 1 0.0% $365,000 $222,500 - 39.0% 78 126 + 61.5% 5 2 - 60.0% Belmont 2 4 + 100.0% $570,000 $640,000 + 12.3% 15 15 0.0% 5 5 0.0% Boston 38 38 0.0% $360,200 $437,000 + 21.3% 67 39 - 41.6% 116 69 - 40.5% Boxborough 0 0 -- $0 $0 -- 0 0 -- 0 0 -- Brookline 6 2 - 66.7% $1,181,025 $1,066,500 - 9.7% 20 17 - 13.6% 7 7 0.0% Burlington 1 0 - 100.0% $435,000 $0 - 100.0% 22 0 - 100.0% 0 0 -- Cambridge 9 6 - 33.3% $880,000 $875,500 - 0.5% 34 26 - 22.0% 7 8 + 14.3% Canton 0 1 -- $0 $349,000 -- 0 106 -- 2 4 + 100.0% Carlisle 0 0 -- $0 $0 -- 0 0 -- 1 0 - 100.0% Chelsea 3 1 - 66.7% $265,000 $350,000 + 32.1% 76 21 - 72.2% 18 9 - 50.0% Concord 1 1 0.0% $295,000 $486,000 + 64.7% 563 46 - 91.8% 2 2 0.0% Dedham 2 2 0.0% $359,750 $464,000 + 29.0% 143 6 - 95.8% 9 6 - 33.3% Dover 0 0 -- $0 $0 -- 0 0 -- 0 0 -- Everett 4 7 + 75.0% $328,500 $350,000 + 6.5% 48 34 - 28.6% 19 15 - 21.1% Foxborough 1 0 - 100.0% $299,000 $0 - 100.0% 83 0 - 100.0% 1 2 + 100.0% Framingham 6 2 - 66.7% $239,250 $290,000 + 21.2% 65 17 - 73.8% 8 7 - 12.5% Franklin 1 2 + 100.0% $55,000 $313,750 + 470.5% 29 10 - 67.2% 5 2 - 60.0% Holliston 0 0 -- $0 $0 -- 0 0 -- 0 1 -- Hopkinton 0 0 -- $0 $0 -- 0 0 -- 0 1 -- Hudson 0 1 -- $0 $258,000 -- 0 206 -- 8 5 - 37.5% Lexington 0 0 -- $0 $0 -- 0 0 -- 2 2 0.0% Lincoln 0 0 -- $0 $0 -- 0 0 -- 3 0 - 100.0% Malden 9 14 + 55.6% $331,500 $396,450 + 19.6% 57 29 - 48.9% 26 18 - 30.8% Mansfield 1 1 0.0% $170,000 $351,500 + 106.8% 9 8 - 11.1% 3 3 0.0% Marlborough 1 3 + 200.0% $118,500 $200,000 + 68.8% 62 39 - 37.6% 10 8 - 20.0% Maynard 0 2 -- $0 $285,000 -- 0 42 -- 2 4 + 100.0% Medfield 0 0 -- $0 $0 -- 0 0 -- 3 0 - 100.0% Medford 10 12 + 20.0% $474,500 $521,750 + 10.0% 45 24 - 46.1% 17 13 - 23.5% Medway 1 0 - 100.0% $284,000 $0 - 100.0% 83 0 - 100.0% 2 1 - 50.0% Milford 1 3 + 200.0% $230,000 $183,550 - 20.2% 144 80 - 44.7% 13 6 - 53.8% Millis 0 0 -- $0 $0 -- 0 0 -- 1 1 0.0% Milton 0 3 -- $0 $396,500 -- 0 31 -- 9 1 - 88.9% Natick 0 3 -- $0 $530,000 -- 0 30 -- 9 5 - 44.4% Needham 0 1 -- $0 $600,000 -- 0 18 -- 2 2 0.0% Newton 11 8 - 27.3% $620,000 $735,000 + 18.5% 62 11 - 81.7% 20 9 - 55.0% August 2013 InventoryClosed Sales Days on MarketMedian Sales Price
- 3. All data from MLS Property Information Network, Inc. Provided by Greater Boston Association of REALTORS®. Powered by 10K Research and Marketing. Multi-Family Housing Activity Report – 2-Family Properties (cont.) 8-2012 8-2013 + / – 8-2012 8-2013 + / – 8-2012 8-2013 + / – 8-2012 8-2013 + / – Norfolk 0 0 -- $0 $0 -- 0 0 -- 1 1 0.0% North Attleboro 0 2 -- $0 $232,400 -- 0 11 -- 5 4 - 20.0% Norwood 2 1 - 50.0% $273,500 $312,000 + 14.1% 92 43 - 53.3% 5 7 + 40.0% Plainville 1 0 - 100.0% $424,900 $0 - 100.0% 234 0 - 100.0% 2 0 - 100.0% Quincy 7 11 + 57.1% $380,000 $385,000 + 1.3% 138 58 - 58.0% 26 14 - 46.2% Revere 7 9 + 28.6% $301,500 $388,000 + 28.7% 64 68 + 5.9% 34 19 - 44.1% Saugus 1 1 0.0% $347,500 $325,000 - 6.5% 76 43 - 43.4% 7 6 - 14.3% Sharon 0 0 -- $0 $0 -- 0 0 -- 2 2 0.0% Sherborn 0 0 -- $0 $0 -- 0 0 -- 1 0 - 100.0% Somerville 11 14 + 27.3% $515,000 $714,500 + 38.7% 46 17 - 63.7% 23 16 - 30.4% Southborough 0 0 -- $0 $0 -- 0 0 -- 1 2 + 100.0% Stow 0 0 -- $0 $0 -- 0 0 -- 2 1 - 50.0% Sudbury 0 0 -- $0 $0 -- 0 0 -- 1 0 - 100.0% Walpole 0 1 -- $0 $316,000 -- 0 18 -- 2 6 + 200.0% Waltham 0 6 -- $0 $471,500 -- 0 48 -- 10 1 - 90.0% Watertown 6 5 - 16.7% $524,000 $550,000 + 5.0% 38 14 - 63.7% 11 8 - 27.3% Wayland 0 0 -- $0 $0 -- 0 0 -- 1 1 0.0% Wellesley 0 0 -- $0 $0 -- 0 0 -- 1 1 0.0% Weston 0 0 -- $0 $0 -- 0 0 -- 1 0 - 100.0% Westwood 0 1 -- $0 $480,000 -- 0 2 -- 0 1 -- Winchester 0 1 -- $0 $570,000 -- 0 22 -- 5 4 - 20.0% Winthrop 3 4 + 33.3% $340,000 $430,000 + 26.5% 56 29 - 48.1% 2 6 + 200.0% Woburn 2 1 - 50.0% $343,750 $601,000 + 74.8% 13 6 - 53.8% 6 6 0.0% Wrentham 0 0 -- $0 $0 -- 0 0 -- 1 1 0.0% Greater Boston 154 184 +19.5% $392,750 $450,000 +14.6% 66 34 -48.3% 514 335 -34.8% Note: The "Greater Boston" figures are not a compilation or total of the individual areas. Days on Market Inventory August 2013 Closed Sales Median Sales Price
- 4. All data from MLS Property Information Network, Inc. Provided by Greater Boston Association of REALTORS®. Powered by 10K Research and Marketing. Multi-Family Housing Activity Report – 3-Family Properties 8-2012 8-2013 + / – 8-2012 8-2013 + / – 8-2012 8-2013 + / – 8-2012 8-2013 + / – Acton 0 0 -- $0 $0 -- 0 0 -- 0 0 -- Arlington 0 0 -- $0 $0 -- 0 0 -- 0 0 -- Ashland 0 1 -- $0 $382,000 -- 0 290 -- 6 0 - 100.0% Attleboro 2 0 - 100.0% $120,250 $0 - 100.0% 16 0 - 100.0% 12 2 - 83.3% Bedford 0 0 -- $0 $0 -- 0 0 -- 0 0 -- Bellingham 0 0 -- $0 $0 -- 0 0 -- 0 1 -- Belmont 0 0 -- $0 $0 -- 0 0 -- 0 0 -- Boston 37 32 - 13.5% $438,000 $445,000 + 1.6% 43 26 - 39.9% 102 58 - 43.1% Boxborough 0 0 -- $0 $0 -- 0 0 -- 0 0 -- Brookline 0 3 -- $0 $975,000 -- 0 26 -- 3 2 - 33.3% Burlington 0 0 -- $0 $0 -- 0 0 -- 0 0 -- Cambridge 2 1 - 50.0% $930,000 $1,000,000 + 7.5% 14 8 - 40.7% 3 5 + 66.7% Canton 0 0 -- $0 $0 -- 0 0 -- 0 1 -- Carlisle 0 0 -- $0 $0 -- 0 0 -- 0 0 -- Chelsea 1 1 0.0% $255,880 $345,000 + 34.8% 17 5 - 70.6% 14 12 - 14.3% Concord 0 0 -- $0 $0 -- 0 0 -- 0 0 -- Dedham 0 0 -- $0 $0 -- 0 0 -- 0 0 -- Dover 0 0 -- $0 $0 -- 0 0 -- 0 0 -- Everett 5 5 0.0% $388,000 $410,000 + 5.7% 41 34 - 16.9% 15 7 - 53.3% Foxborough 0 0 -- $0 $0 -- 0 0 -- 0 0 -- Framingham 1 1 0.0% $321,000 $335,000 + 4.4% 53 427 + 705.7% 3 0 - 100.0% Franklin 0 0 -- $0 $0 -- 0 0 -- 3 0 - 100.0% Holliston 0 0 -- $0 $0 -- 0 0 -- 1 1 0.0% Hopkinton 0 0 -- $0 $0 -- 0 0 -- 1 1 0.0% Hudson 0 1 -- $0 $255,000 -- 0 265 -- 4 2 - 50.0% Lexington 0 0 -- $0 $0 -- 0 0 -- 0 1 -- Lincoln 0 0 -- $0 $0 -- 0 0 -- 0 0 -- Malden 0 1 -- $0 $455,000 -- 0 21 -- 4 5 + 25.0% Mansfield 0 0 -- $0 $0 -- 0 0 -- 0 1 -- Marlborough 1 0 - 100.0% $185,000 $0 - 100.0% 14 0 - 100.0% 3 2 - 33.3% Maynard 0 0 -- $0 $0 -- 0 0 -- 0 1 -- Medfield 0 0 -- $0 $0 -- 0 0 -- 0 0 -- Medford 2 2 0.0% $437,200 $579,000 + 32.4% 40 19 - 51.9% 1 3 + 200.0% Medway 0 0 -- $0 $0 -- 0 0 -- 0 1 -- Milford 0 0 -- $0 $0 -- 0 0 -- 3 2 - 33.3% Millis 0 0 -- $0 $0 -- 0 0 -- 0 0 -- Milton 0 0 -- $0 $0 -- 0 0 -- 1 1 0.0% Natick 0 1 -- $0 $530,000 -- 0 18 -- 0 0 -- Needham 0 0 -- $0 $0 -- 0 0 -- 2 0 - 100.0% Newton 0 0 -- $0 $0 -- 0 0 -- 2 0 - 100.0% August 2013 Closed Sales Median Sales Price Days on Market Inventory
- 5. All data from MLS Property Information Network, Inc. Provided by Greater Boston Association of REALTORS®. Powered by 10K Research and Marketing. Multi-Family Housing Activity Report – 3-Family Properties (cont.) 8-2012 8-2013 + / – 8-2012 8-2013 + / – 8-2012 8-2013 + / – 8-2012 8-2013 + / – Norfolk 0 0 -- $0 $0 -- 0 0 -- 0 0 -- North Attleboro 2 1 -50.0% $201,500 $303,500 +50.6% 30 6 -79.7% 3 1 -66.7% Norwood 0 1 -- $0 $535,000 -- 0 23 -- 0 1 -- Plainville 0 1 -- $0 $393,000 -- 0 53 -- 0 0 -- Quincy 1 3 +200.0% $374,900 $415,000 +10.7% 15 45 +202.2% 3 6 +100.0% Revere 3 2 -33.3% $253,200 $405,900 +60.3% 21 13 -39.5% 5 3 -40.0% Saugus 0 0 -- $0 $0 -- 0 0 -- 1 0 -100.0% Sharon 0 0 -- $0 $0 -- 0 0 -- 0 0 -- Sherborn 0 0 -- $0 $0 -- 0 0 -- 0 0 -- Somerville 6 5 -16.7% $540,800 $1,100,000 +103.4% 42 13 -69.2% 7 8 +14.3% Southborough 0 0 -- $0 $0 -- 0 0 -- 0 0 -- Stow 0 0 -- $0 $0 -- 0 0 -- 0 0 -- Sudbury 0 0 -- $0 $0 -- 0 0 -- 0 0 -- Walpole 0 0 -- $0 $0 -- 0 0 -- 1 1 0.0% Waltham 1 0 -100.0% $502,500 $0 -100.0% 6 0 -100.0% 0 2 -- Watertown 2 0 -100.0% $558,000 $0 -100.0% 14 0 -100.0% 1 1 0.0% Wayland 0 0 -- $0 $0 -- 0 0 -- 0 0 -- Wellesley 0 0 -- $0 $0 -- 0 0 -- 0 0 -- Weston 0 0 -- $0 $0 -- 0 0 -- 0 0 -- Westwood 0 0 -- $0 $0 -- 0 0 -- 0 0 -- Winchester 0 0 -- $0 $0 -- 0 0 -- 0 0 -- Winthrop 0 0 -- $0 $0 -- 0 0 -- 1 1 0.0% Woburn 1 1 0.0% $512,500 $495,000 -3.4% 17 6 -64.7% 1 0 -100.0% Wrentham 0 0 -- $0 $0 -- 0 0 -- 1 0 -100.0% Greater Boston 67 63 -6.0% $435,000 $450,000 +3.4% 36 39 +7.0% 206 129 -37.4% Note: The "Greater Boston" figures are not a compilation or total of the individual areas. Closed Sales Median Sales Price Days on Market Inventory August 2013
- 6. All data from MLS Property Information Network, Inc. Provided by Greater Boston Association of REALTORS®. Powered by 10K Research and Marketing. Multi-Family Housing Activity Report – 4-Family Properties 8-2012 8-2013 + / – 8-2012 8-2013 + / – 8-2012 8-2013 + / – 8-2012 8-2013 + / – Acton 0 0 -- $0 $0 -- 0 0 -- 0 0 -- Arlington 0 0 -- $0 $0 -- 0 0 -- 0 0 -- Ashland 0 0 -- $0 $0 -- 0 0 -- 0 0 -- Attleboro 0 1 -- $0 $195,000 -- 0 140 -- 2 1 - 50.0% Bedford 0 0 -- $0 $0 -- 0 0 -- 0 0 -- Bellingham 0 0 -- $0 $0 -- 0 0 -- 0 0 -- Belmont 0 0 -- $0 $0 -- 0 0 -- 0 0 -- Boston 3 1 - 66.7% $920,000 $505,000 - 45.1% 28 12 - 57.1% 5 6 + 20.0% Boxborough 0 0 -- $0 $0 -- 0 0 -- 0 0 -- Brookline 0 0 -- $0 $0 -- 0 0 -- 0 0 -- Burlington 0 0 -- $0 $0 -- 0 0 -- 0 0 -- Cambridge 0 2 -- $0 $1,262,500 -- 0 48 -- 1 1 0.0% Canton 0 0 -- $0 $0 -- 0 0 -- 0 0 -- Carlisle 0 0 -- $0 $0 -- 0 0 -- 0 0 -- Chelsea 0 0 -- $0 $0 -- 0 0 -- 1 3 + 200.0% Concord 0 0 -- $0 $0 -- 0 0 -- 0 0 -- Dedham 0 0 -- $0 $0 -- 0 0 -- 1 1 0.0% Dover 0 0 -- $0 $0 -- 0 0 -- 0 0 -- Everett 0 0 -- $0 $0 -- 0 0 -- 0 1 -- Foxborough 0 0 -- $0 $0 -- 0 0 -- 0 0 -- Framingham 1 1 0.0% $127,000 $355,000 + 179.5% 20 10 - 50.0% 0 1 -- Franklin 0 0 -- $0 $0 -- 0 0 -- 0 1 -- Holliston 0 0 -- $0 $0 -- 0 0 -- 4 0 - 100.0% Hopkinton 0 0 -- $0 $0 -- 0 0 -- 0 0 -- Hudson 0 0 -- $0 $0 -- 0 0 -- 0 0 -- Lexington 0 0 -- $0 $0 -- 0 0 -- 0 0 -- Lincoln 0 0 -- $0 $0 -- 0 0 -- 0 0 -- Malden 0 0 -- $0 $0 -- 0 0 -- 0 0 -- Mansfield 0 1 -- $0 $305,000 -- 0 103 -- 0 1 -- Marlborough 0 0 -- $0 $0 -- 0 0 -- 3 0 - 100.0% Maynard 0 0 -- $0 $0 -- 0 0 -- 0 0 -- Medfield 0 0 -- $0 $0 -- 0 0 -- 0 1 -- Medford 2 0 - 100.0% $594,000 $0 - 100.0% 87 0 - 100.0% 0 0 -- Medway 0 0 -- $0 $0 -- 0 0 -- 0 0 -- Milford 1 0 - 100.0% $100,000 $0 - 100.0% 348 0 - 100.0% 1 1 0.0% Millis 0 0 -- $0 $0 -- 0 0 -- 0 0 -- Milton 0 0 -- $0 $0 -- 0 0 -- 0 0 -- Natick 0 0 -- $0 $0 -- 0 0 -- 0 0 -- Needham 0 0 -- $0 $0 -- 0 0 -- 0 0 -- Newton 0 0 -- $0 $0 -- 0 0 -- 2 2 0.0% August 2013 Closed Sales Median Sales Price Days on Market Inventory
- 7. All data from MLS Property Information Network, Inc. Provided by Greater Boston Association of REALTORS®. Powered by 10K Research and Marketing. Multi-Family Housing Activity Report – 4-Family Properties (cont.) 8-2012 8-2013 + / – 8-2012 8-2013 + / – 8-2012 8-2013 + / – 8-2012 8-2013 + / – Norfolk 0 0 -- $0 $0 -- 0 0 -- 0 1 -- North Attleboro 1 0 -100.0% $192,300 $0 -100.0% 42 0 -100.0% 0 1 -- Norwood 0 0 -- $0 $0 -- 0 0 -- 0 1 -- Plainville 0 0 -- $0 $0 -- 0 0 -- 2 0 -100.0% Quincy 2 2 0.0% $432,500 $707,500 +63.6% 106 26 -75.8% 4 1 -75.0% Revere 0 0 -- $0 $0 -- 0 0 -- 1 2 +100.0% Saugus 0 0 -- $0 $0 -- 0 0 -- 0 0 -- Sharon 0 0 -- $0 $0 -- 0 0 -- 0 0 -- Sherborn 0 0 -- $0 $0 -- 0 0 -- 0 0 -- Somerville 0 1 -- $0 $900,000 -- 0 3 -- 4 1 -75.0% Southborough 0 0 -- $0 $0 -- 0 0 -- 0 0 -- Stow 0 0 -- $0 $0 -- 0 0 -- 0 0 -- Sudbury 0 0 -- $0 $0 -- 0 0 -- 0 0 -- Walpole 0 0 -- $0 $0 -- 0 0 -- 0 0 -- Waltham 1 1 0.0% $565,000 $827,500 +46.5% 34 4 -88.2% 1 2 +100.0% Watertown 0 0 -- $0 $0 -- 0 0 -- 0 0 -- Wayland 0 0 -- $0 $0 -- 0 0 -- 0 0 -- Wellesley 0 0 -- $0 $0 -- 0 0 -- 0 0 -- Weston 0 0 -- $0 $0 -- 0 0 -- 0 0 -- Westwood 0 0 -- $0 $0 -- 0 0 -- 0 0 -- Winchester 0 0 -- $0 $0 -- 0 0 -- 0 0 -- Winthrop 0 0 -- $0 $0 -- 0 0 -- 0 0 -- Woburn 0 1 -- $0 $430,000 -- 0 304 -- 1 0 -100.0% Wrentham 0 0 -- $0 $0 -- 0 0 -- 0 0 -- Greater Boston 11 11 0.0% $527,500 $605,000 +14.7% 83 66 -20.8% 32 25 -21.9% Note: The "Greater Boston" figures are not a compilation or total of the individual areas. Closed Sales Median Sales Price Days on Market Inventory August 2013