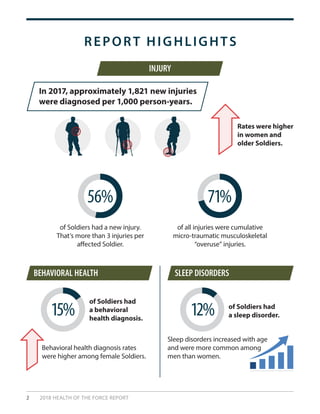
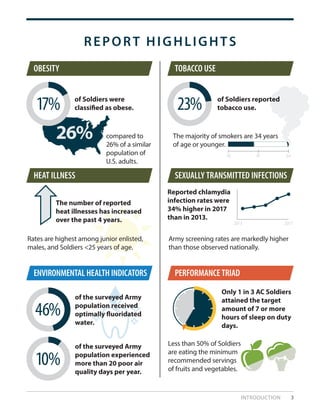
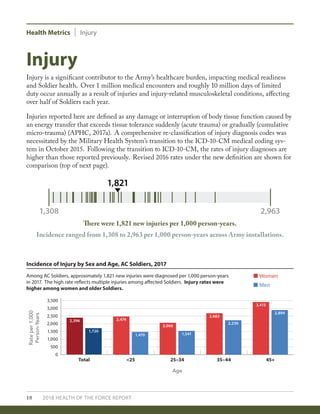
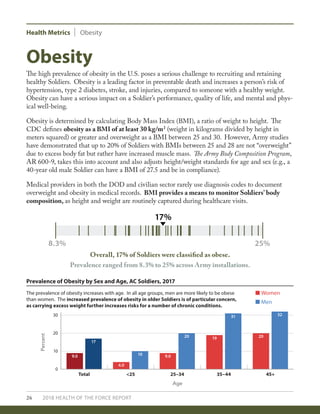
The 2018 Health of the Force report provides an overview of key health metrics, indicators, and rankings for the U.S. Army active component in 2017. Some notable findings include that over 70% of injuries were due to overuse musculoskeletal injuries, 56% of soldiers had a behavioral health diagnosis, 15% had a sleep disorder, and 23% were obese. The report aims to help leaders understand medical readiness challenges and target programs and policies to improve soldier health. It provides installation profiles and highlights various programs shown to positively impact health status and performance.


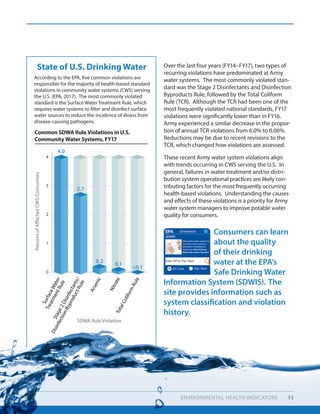
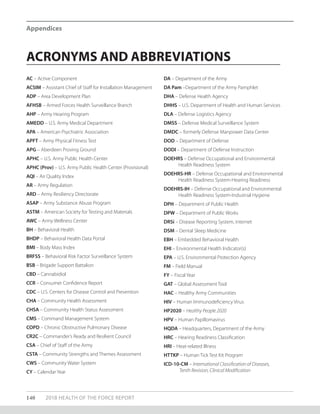
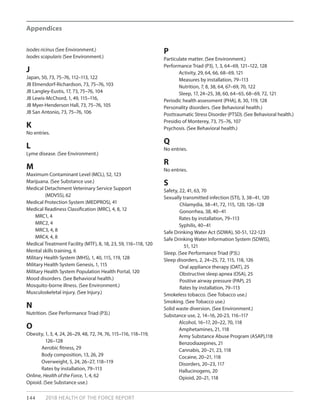
![ARMY PUBLIC HEALTH ACCREDITATION:
EVIDENCE OF PUBLIC HEALTH ENTERPRISE PERFORMANCE IMPROVEMENT
S P O T L I G H T
A
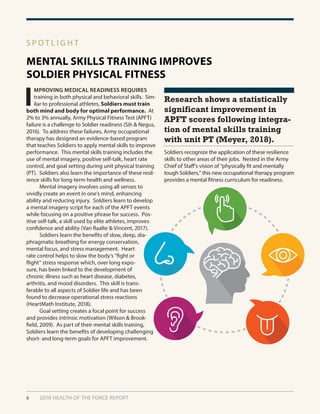
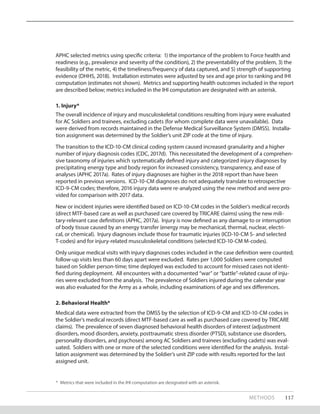
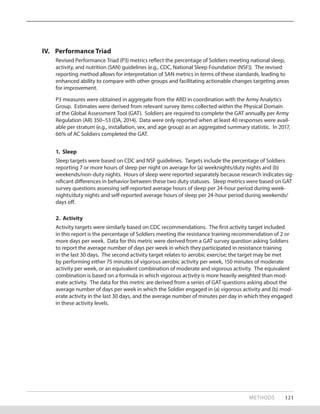
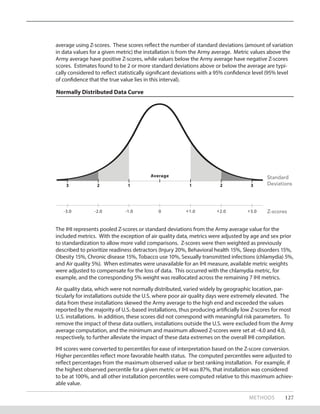
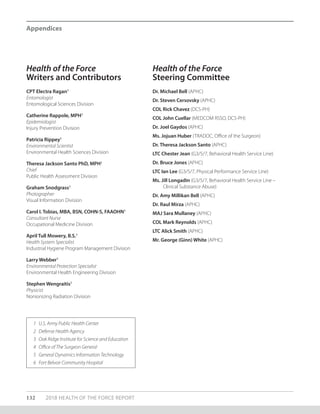
RMY MEDICINE RECOGNIZES THE IMPOR-
tance of accreditations and certifications in the
provision of their services to assure integrity
and quality. The decision to explore an accreditation
program for Army PM departments was borne out of a
movement towards public health department accred-
itation in civilian public health departments. The
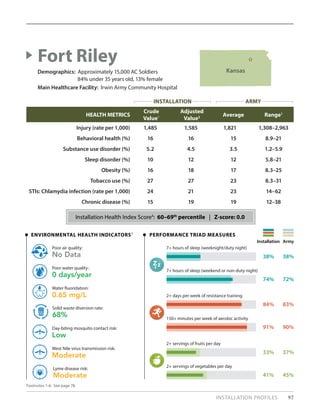
Fort Riley (Kansas) Department of Public Health (DPH)
was the first among the Services to pursue national
accreditation.
In FY18, the MEDCOM Chief of Staff approved
the Army Public Health Performance Improvement
and Accreditation (PI&A) Initiative (MEDCOM, 2018a).
Twenty-eight Army PM departments were directed to
improve performance in alignment with nationally-
recognized public health standards and to apply for
public health accreditation by the end of FY25.
This initiative is intended to ensure the quality
and effectiveness of Army PM departments by meet-
ing nationally-recognized public health standards;
signaling that Army public health delivers services on
par with private sector counterparts; and filling the
gap in non-healthcare accreditation designation.
The DPH staff identified lessons learned and
made process change recommendations for other
Army PM departments that pursue public health
accreditation. The MEDCOM Deputy Chief of Staff
for Public Health/Director, APHC is working to apply
those lessons learned to the PI&A Initiative and share
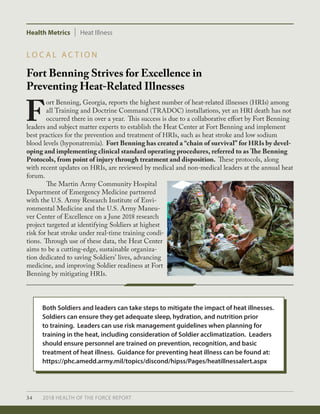
resources with all Army PM departments via subject
matter expertise and consultation.
“[The PI&A Initiative] showed
us that there is a lot more to
public health than the little
things we were doing, like
ergonomic surveys or water
buffalo inspections...it showed
us that there is a lot more...”
—Fort Riley Department of Public Health Staff Member
Results from an APHC-led case study of
the Fort Riley DPH’s accreditation pursuit
revealed that staff and partners observed
several positive outcomes throughout the
accreditation process, including—
• Increased team cohesion.
• Increased collaboration with partners.
• Increased awareness of DPH in the
community.
• Increased DPH staff awareness of public
health practice.
• Changes to DPH processes through an
emphasis on quality improvement.
• Improved communication within DPH
and with partners.
• Improved DPH staff knowledge and
professional development.
For more information, a CAC-enabled Toolkit is
available at https://eaphc.amedd.army.mil/PHPIT/
SitePages/Home.aspx.
77](https://image.slidesharecdn.com/2018healthoftheforcereport-190324192115/85/2018-healthoftheforcereport-81-320.jpg)

![METHODS 125
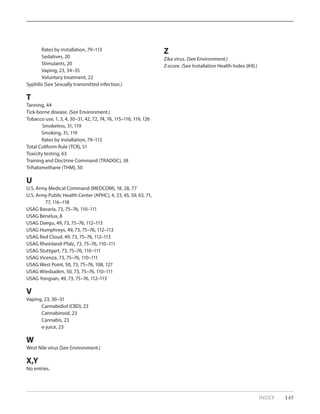
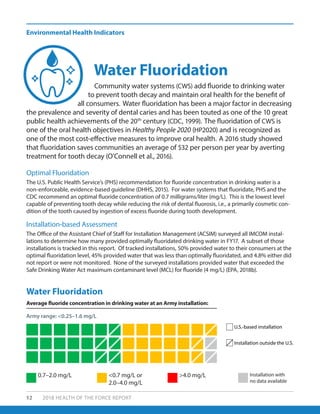
Mosquito-borne Disease Criteria
Day-Biting Mosquito
Contact Risk
WNV Transmission
Risk
Vector reported in county/state public health records
[0=present; 1=not present]
0 or 1 N/A
Installation located in the CDC reported vector range
[0=present; 1=not present]
0 or 1 0 or 1
Vectors reported in county data where the installation
is located [0=not present; 1=present 1 year; 2=present 2
years; 3=present 3 or more years]
0 to 3 N/A
Vectors reported on the installation1
[0=neither Ae. aegypti or Ae. albopictus present; 1=either
Ae. aegypti or Ae. albopictus present; 2=both Ae. aegypti
and Ae. albopictus present]
0 to 2 N/A
WNV-positive mosquito from installation [0=present;
1=not present]
N/A 0 or 1
Incidence of neuroinvasive WNV in the state where the
installation is located [Cases per 100,000 people: 0=no
cases; 1=0.01–0.24 cases; 2=0.25–0.49 cases; 3=0.5–0.99
cases; 4=1.0 cases or more]
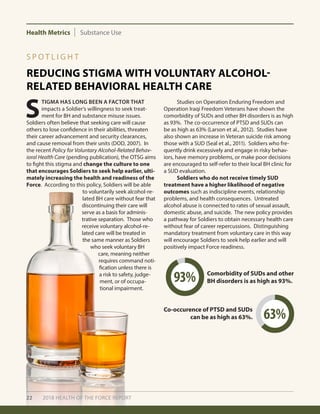
N/A 0 to 4
1 Potential WNV vectors were present at every installation for which surveillance data were available. As a result, vector
presence was not used as a discriminating value.
N/A = Not Applicable
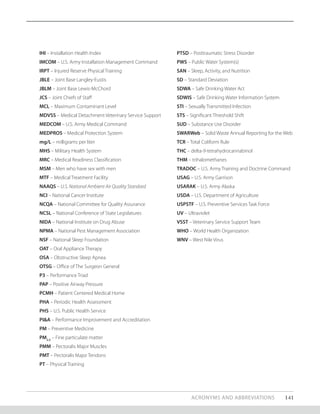
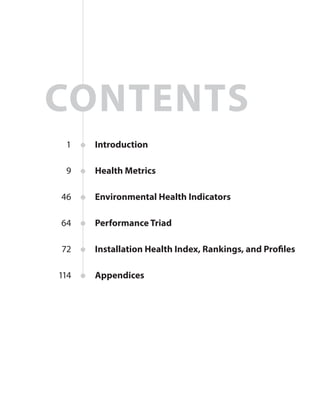
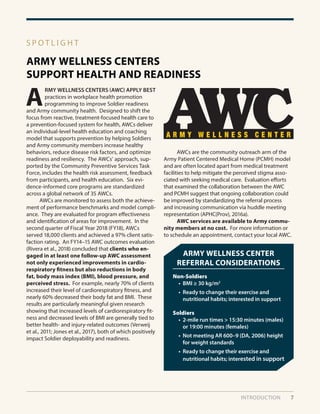
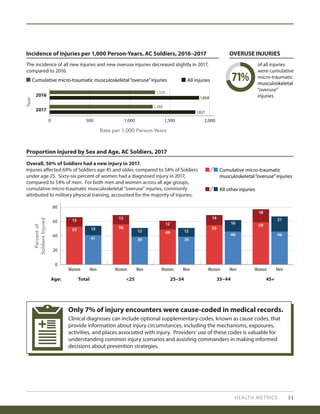
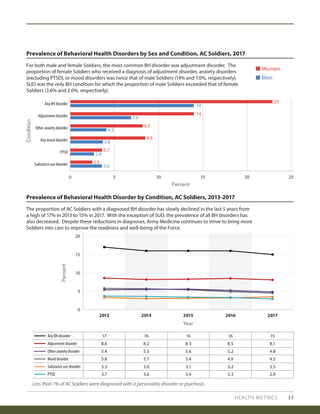
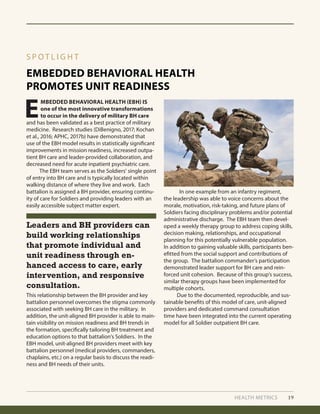
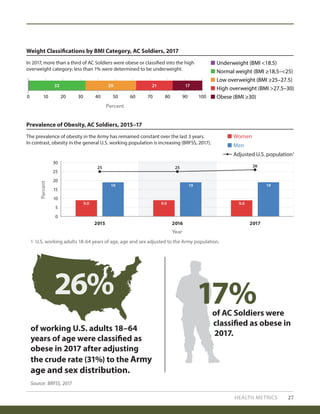
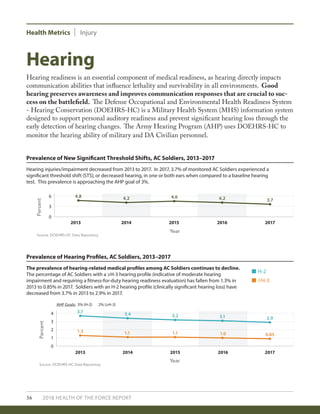
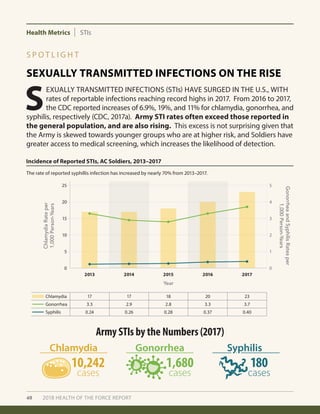
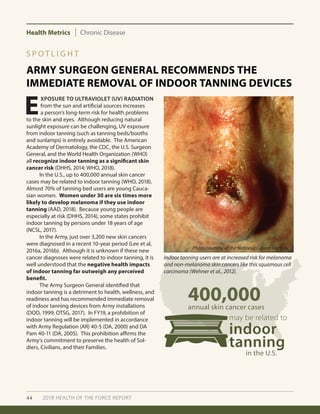
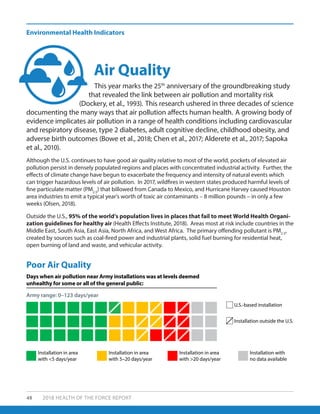
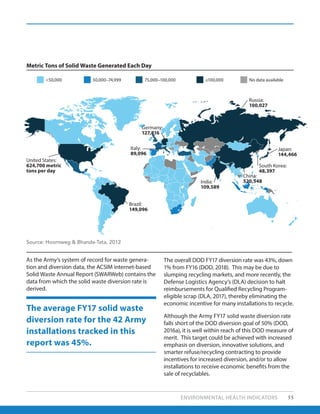
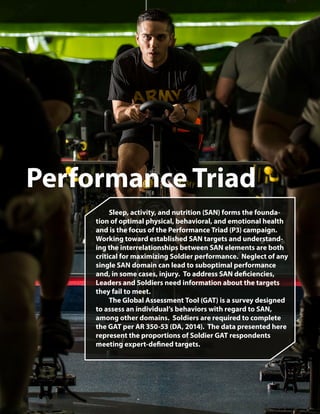
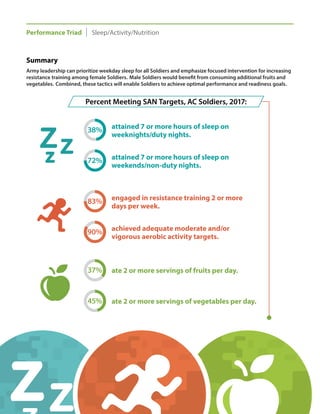
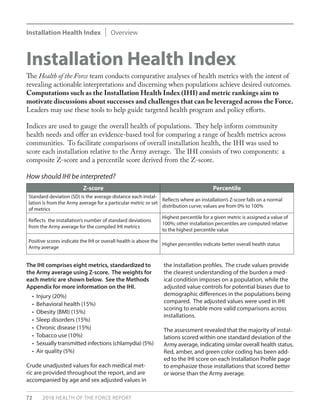
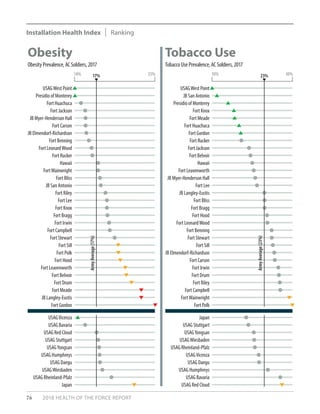
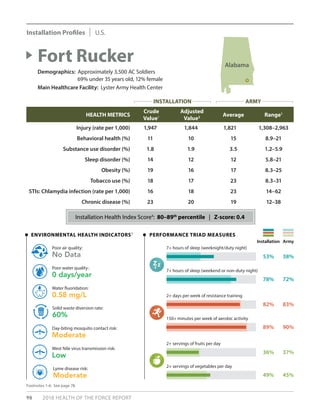
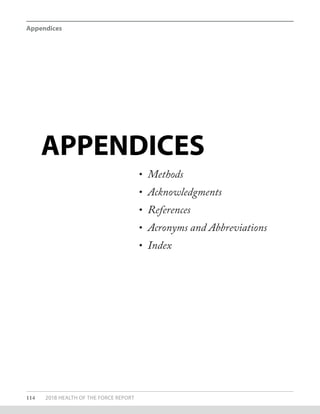
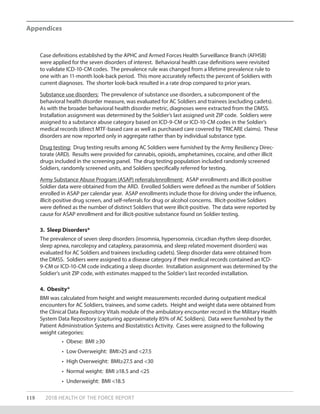
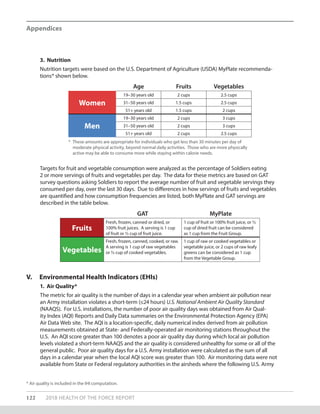
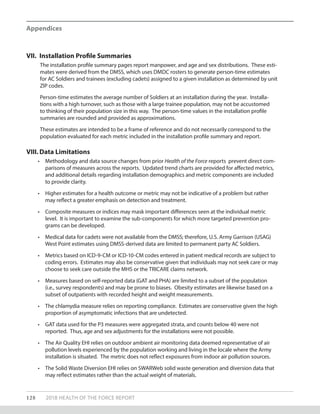
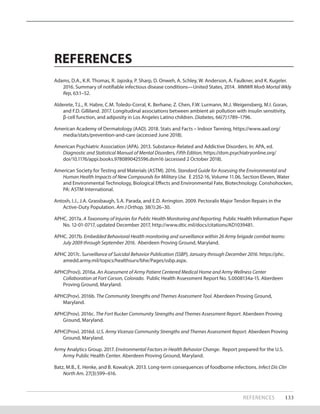
5. Mosquito-borne Disease
The metrics for mosquito-borne disease are two indices reflecting the risk of vector contact or
disease transmission from mosquitoes (Aedes aegypti and Aedes albopictus, Culex spp.) at an Army
installation. The metrics include (a) risk of contact with day-biting mosquitoes on an Army installa-
tion and (b) risk of West Nile virus (WNV) transmission on an Army installation.
The metrics reflect a combination of county/state mosquito surveillance reports from public
health authorities and scientific literature, as well as data from mosquito trapping and pathogen
identification at Army installations. Indices ranging from 0 to 7 indicate the risk of contact with a
Zika, dengue, or chikungunya-competent mosquito vector (day-biting mosquito), or risk of WNV
transmission at each Army installation. An index score of 0 to 2 represents negligible or low risk. A
score of 3 to 4 represents a moderate risk and suggests that the mosquito species may be present,
but disease transmission may be low or underreported. A score of 5 to 7 represents a high risk of
endemic mosquito vector presence and potential disease transmission on an installation.
The criteria used to compute the index scores are presented below.](https://image.slidesharecdn.com/2018healthoftheforcereport-190324192115/85/2018-healthoftheforcereport-129-320.jpg)
![126 2018 HEALTH OF THE FORCE REPORT
Appendices
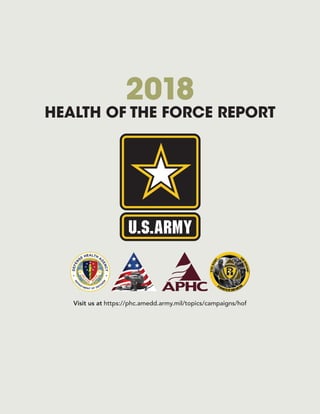
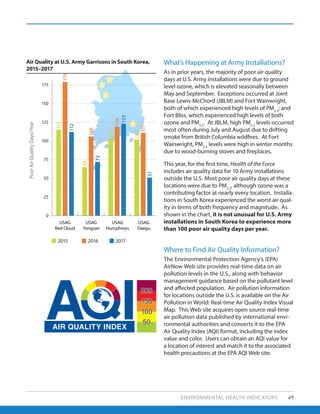
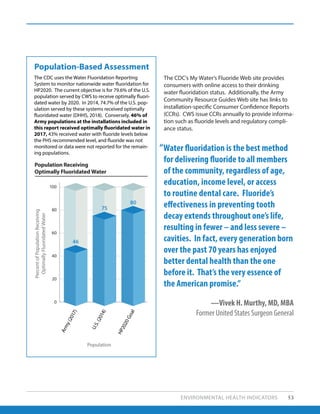
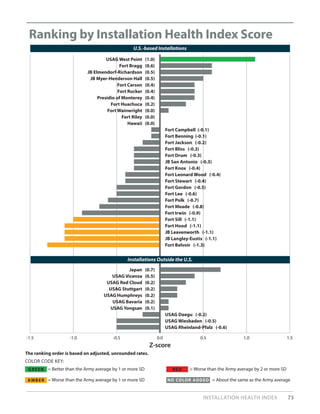
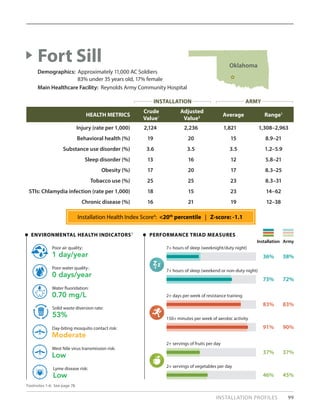
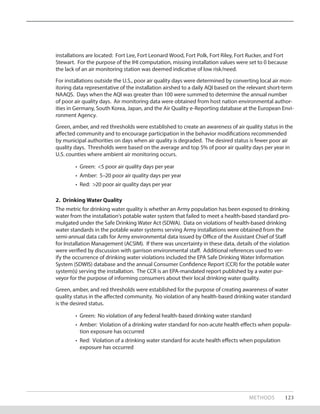
Tick-borne Disease Criteria Lyme Disease Risk
Installation is in the CDC-predicted range for either Lyme vector tick species
(I. scapularis or I. pacificus), as published by Eisen et al., 2016.
[0=neither I. scapularis or I. pacificus present; 1=either I. scapularis or I. pacificus
present; 2=both I. scapularis and I. pacificus present]
0 to 2
The CDC has documented cases of Lyme disease within the last 10 years from
within the county where the installation is located (CDC, 2017e).
[0=false; 1=true]
0 or 1
Human-biting ticks submitted to the HTTKP within the last 10 years were
identified as Lyme vector ticks [0=false; 1=true]
0 or 1
The Lyme vector ticks submitted to the HTTKP were positive for Lyme disease
pathogen [0=false; 1=true]
0 or 1
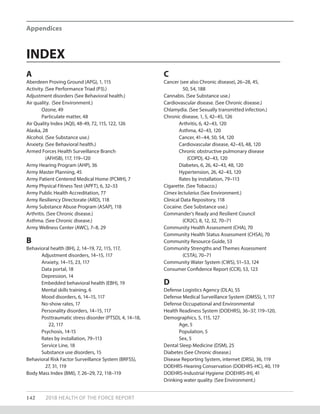
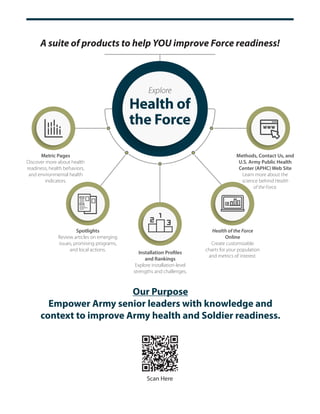
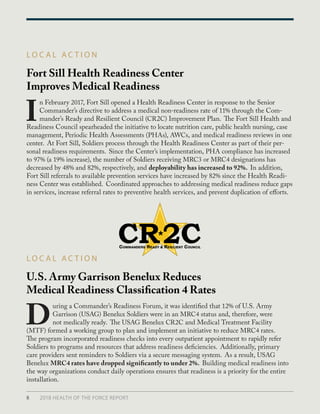
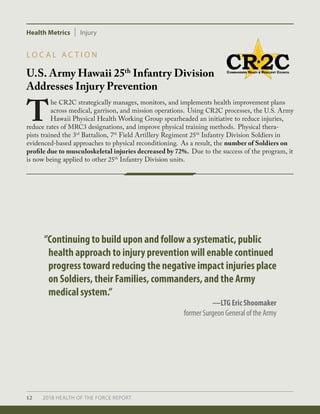
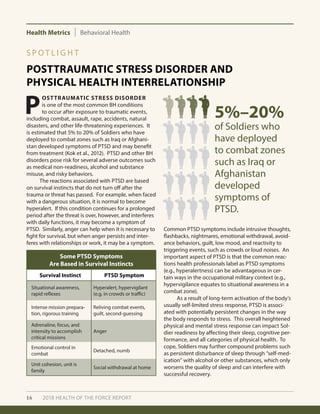
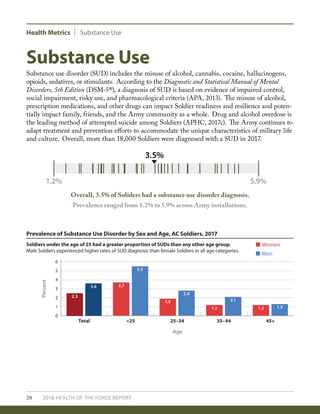
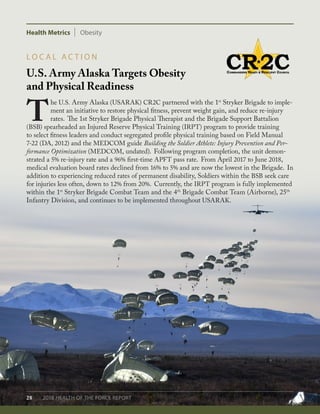
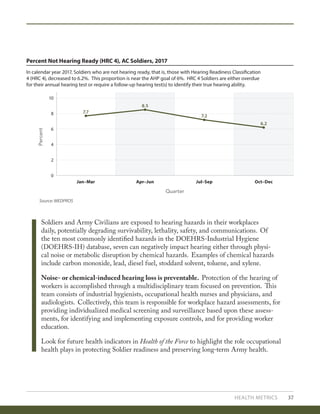
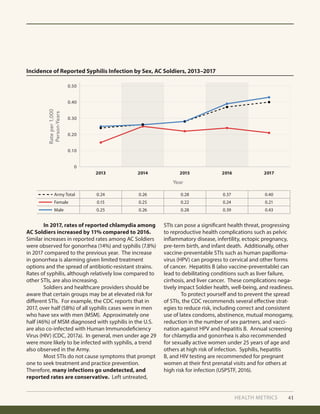
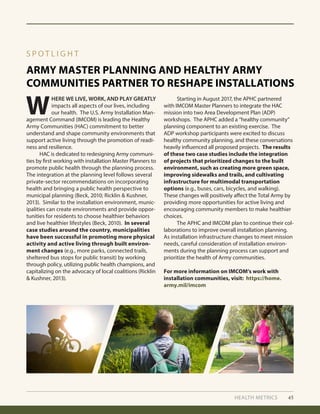
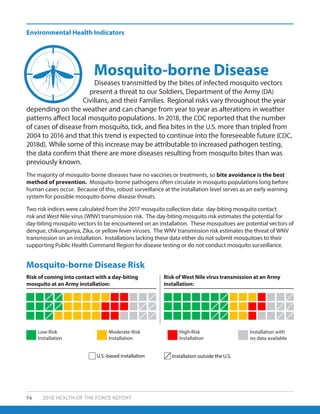
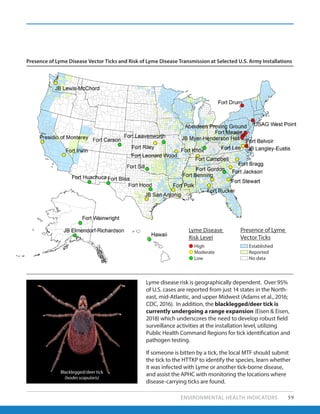
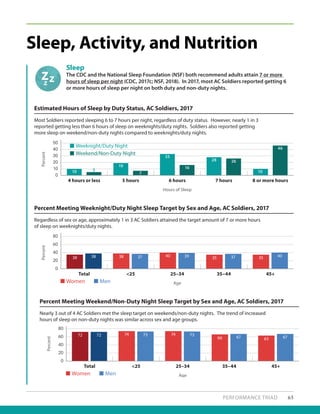
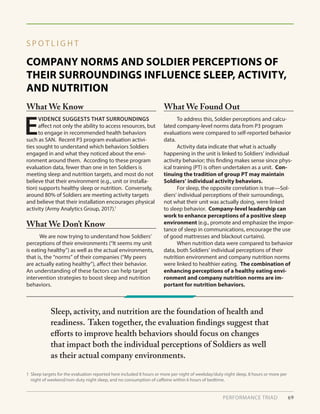
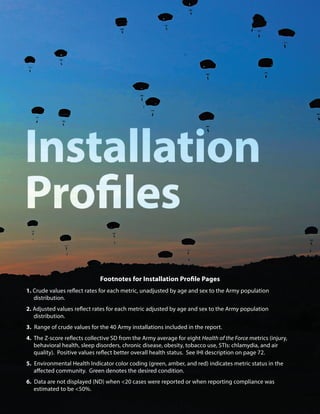
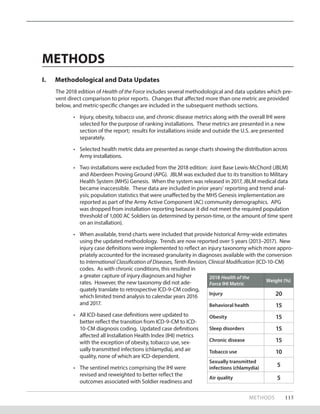
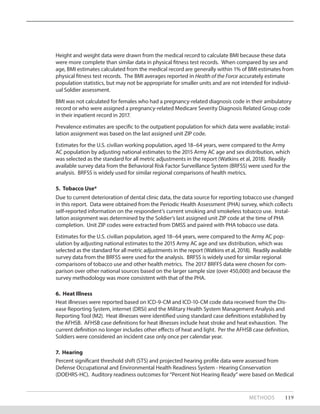
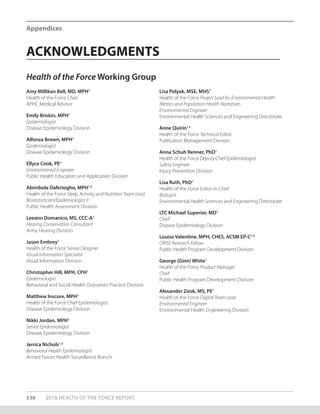
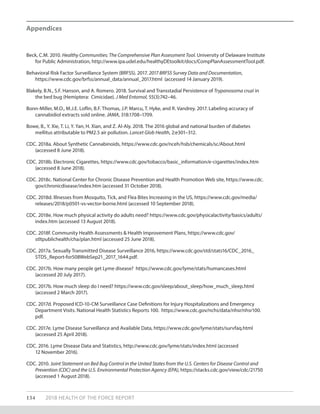
6. Tick-borne Disease
The metric for tick-borne disease is an index reflecting the risk of coming into contact with a Lyme
vector tick (i.e., Ixodes scapularis or Ixodes pacificus) that is infected with the agent of Lyme disease
at an Army installation. The metric reflects a combination of county/state Lyme vector surveillance
reports from public health authorities and scientific literature, and data from human ticks submitted
and evaluated through the DOD Human Tick Test Kit Program (HTTKP). Ticks are voluntarily submit-
ted to the HTTKP after being found attached to (biting) Active Duty, Reserve or Retired personnel,
DOD Civilians, and Family members from all branches of military service. For each Army installa-
tion, an index ranging from 0 to 5 indicates the risk of coming into contact with a Lyme vector tick
infected with the agent of Lyme disease. An index score of 0 to 1 represents a low risk of coming
into contact with a Lyme vector tick and being exposed to the agent of Lyme disease. A score of 2
to 3 represents a moderate risk of coming into contact with a Lyme vector tick and being exposed
to the agent of Lyme disease. A score of 4 to 5 represents a high risk of coming into contact with a
Lyme vector tick and being exposed to the agent of Lyme disease.
The criteria used to compute the index scores are presented below.
VI. Installation Health Index
Health indices are widely used to gauge the overall health of populations. They offer an evidence-
based tool for comparing a broad range of metrics across communities and can help inform com-
munity health needs assessments. Such indices are also useful for ranking, which has proven effec-
tive in both stimulating community interest and driving health improvement. However, because
aggregate indices may hide influential factors, healthcare decision makers should review individual
measures that comprise the index in order to identify and effectively target key outcomes or behav-
iors that are the most significant health and readiness detractors for each installation.
The core metrics included in this report were prioritized for the AC Soldier population based on the
prevalence of the condition or factor, the potential health or readiness impact, the preventability of
the condition or factor, the validity of the data, supporting evidence, and the importance to Army
leadership.
In generating an IHI, the eight selected metrics (injury, behavioral health, obesity, sleep disorders,
chronic disease, tobacco use, chlamydia, and air quality) were individually standardized to the Army](https://image.slidesharecdn.com/2018healthoftheforcereport-190324192115/85/2018-healthoftheforcereport-130-320.jpg)
![METHODS 129
Suggested citation
U.S. Army Public Health Center. 2018. 2018 Health of the Force, [https://phc.amedd.army.mil/topics/campaigns/hof].
• The Mosquito-borne Disease EHI relies on mosquito specimens acquired by the installation and
forwarded to the supporting Public Health Command Region for identification and pathogen
testing. Robustness of the risk characterizations is dependent upon installation surveillance pro-
grams collecting specimens and ensuring delivery to the supporting region for identification and
testing.
• The Tick-borne Disease EHI relies on tick specimens submitted to the DOD HTTKP for identification
and pathogen testing. Robustness of the risk estimate is dependent upon installation populations
submitting human ticks to the HTTKP for analysis.](https://image.slidesharecdn.com/2018healthoftheforcereport-190324192115/85/2018-healthoftheforcereport-133-320.jpg)
![138 2018 HEALTH OF THE FORCE REPORT
Olsen, L. 2018, March 30–31. After Harvey, a “second storm” of air pollution, state reports show. Houston Chron-
icle, https://www.houstonchronicle.com/news/houston-texas/houston/article/After-Harvey-a-second-
storm-of-air-12795260.php (accessed 18 October 2018).
Office of The Surgeon General (OTSG). 2017. Memorandum, subject: Tanning Devices at Army Morale, Welfare,
and Recreation Facilities, 12 October 2017. Falls Church, Virginia.
OTSG/MEDCOM. 2018. Policy Memorandum 18-043, subject: Dental Sleep Medicine Therapy in the U.S. Army
Dental Care System, 3 August 2018; expires 3 August 2020. Joint Base San Antonio, Texas.
Phillips, C., R. Grunstein, M. Darendeliler, A. Mihailidou, V. Srinivasan, B. Yee, G. Marks, and P. Cistulli. 2013.
Health outcomes of continuous positive airway pressure versus oral appliance treatment for obstructive
sleep apnea: a randomized controlled trial. Am J Respir Crit Care Med, 187(8):879–887.
Pochini, A.C., C.V. Andreoli, and P.S. Belangero. 2014. Clinical Considerations for the Surgical Treatment of
Pectoralis Major Muscle Ruptures Based on 60 Cases: A Prospective Study and Literature Review. Am J
Sports Med, 42(1): 95–100.
Ramar, K., L. Dort, S. Katz, C. Lettieri, C. Harrod, S. Thomas, and R. Chervin. 2015. Clinical practice guideline for
the treatment of obstructive sleep apnea and snoring with oral appliance therapy: an update for 2015. An
American Academy of Sleep Medicine and American Academy of Dental Sleep Medicine Clinical Practice
Guideline. JDSM, 2(3):71–91.
Rappole, C., T. Grier, M.K. Anderson, V. Hauschild, and B.H. Jones. 2017. Associations of Age, Aerobic Fitness, and
Body Mass Index with Injury in an Operational Army Brigade. J Sci Med Sport, 20:S45–S50.
Ricklin, A. and N. Kushner. 2013. Healthy Plan Making: Integrating Health into the Comprehensive Planning Process:
An analysis of seven case studies and recommendations for change. American Planning Association, Planning
and Community Health Research Center. https://planning-org-uploaded-media.s3.amazonaws.com/
legacy_resources/research/publichealth/pdf/healthyplanningreport.pdf.
Rivera, L.O., J.D. Ford, M.M. Hartzell, and T.A Hoover. 2018. An evaluation of army wellness center clients’ health-
related outcomes. Am J Health Promot, doi: 10.1177/0890117117753184 [Epub ahead of print].
Rosenberg, R., N.P. Lindsey, M. Fischer, C.J. Gregory, A.F. Hinckley, P.S. Mead, G. Paz-Bailey, S.H. Waterman, N.A.
Drexler, G.J. Kersh, and H. Hooks. 2018. Vital Signs: Trends in Reported Vectorborne Disease Cases—United
States and Territories, 2004–2016. MMWR Morb Mortal Wkly Rep, 67(17):496.
Salazar, D., I. Shakir, H. Israel, W.S. Choate , K. Joe, and K. Van de Kieft. 2018. Acute Pectoralis Major Tears in
Forward Deployed Active Duty U.S. Military Personnel: A Population at Risk? J Orthop Rheumatol, 5(1):6.
Sapoka, A., A.P Chelikowsky, K.E. Nachman, and B. Ritz. 2010. Exposure to particulate matter and adverse birth
outcomes: A comprehensive review and meta-analysis. Air Qual Atmos Health, 5(4):1–13.
Scallan, E., R.M. Hoekstra, F.J. Angulo, R.V. Tauxe, M-A. Widdowson, S-L. Roy, J.L. Jones, and P.M. Griffin. 2011.
Foodborne illness acquired in the United States—major pathogens. Emerg Infec Dis. 17(1):7–15.
Seal, K.H., G. Cohen, A. Waldrop, B.E. Cohen, S. Maguen, and L. Ren. 2011. Substance use disorders in Iraq and
Afghanistan Veterans in VA healthcare, 2001–2010: Implications for screening, diagnosis and treatment.
Drug Alcohol Depend, 116(1–3):93–101.
Sih, B. and C. Negus. 2016. Physical Training Outcome Predictions With Biomechanics, Part I: Army Physical
Fitness Test Modeling. Mil Med. 181(5S):77–84.](https://image.slidesharecdn.com/2018healthoftheforcereport-190324192115/85/2018-healthoftheforcereport-142-320.jpg)
![Simmons, A.M. 2016, April 21–22. The world’s trash crisis, and why many Americans are oblivious. Los Angeles
Times, http://www.latimes.com/world/global-development/la-fg-global-trash-20160422-20160421-snap-
htmlstory.html (accessed May 2018).
Sutherland, K., C. Phillips, and P. Cistulli. 2015. Efficacy versus effectiveness in the treatment of obstructive sleep
apnea: cpap and oral appliances. JDSM, 2(4):175–181.
U.S. Army Medical Department (AMEDD). Undated. Building the Soldier Athlete. Injury Prevention and
Performance Optimization, https://armymedicine.health.mil.
U.S. Department of Agriculture (USDA). 2018. Choose My Plate Web site, https://www.choosemyplate.gov/
MyPlate (accessed 19 July 2018).
U.S. Preventive Services Task Force (USPSTF). 2018. Published Recommendations, https://www.
uspreventiveservicestaskforce.org/BrowseRec/Index.
USPSTF. 2016. Screening for Syphilis Infection in Nonpregnant Adults and Adolescents. US Preventive Services
Task Force Recommendation Statement. JAMA, 16;315(21):2321–2327. doi:10.1001/jama.2016.5824.
Van Raalte, J. and A. Vincent. 2017. Psychology. Self-Talk in Sport and Performance. Oxford Research
Encyclopedias [Internet], http://psychology.oxfordre.com/view/10.1093/acrefore/9780190236557.001.0001/
acrefore-9780190236557-e-157.
Verweij, L.M., J. Coffeng, W. van Mechelen, and K.I. Proper. 2011. Meta‐analyses of workplace physical activity
and dietary behaviour interventions on weight outcomes. Obes Rev, 12(6):406–429.
Watkins, E.Y., A. Spiess, I. Abdul-Rahman, C. Hill, N. Gibson, J. Nichols, V. McLeod, L. Johnson, T. Mitchell, J.A.
Pecko, and K. Cox. 2018. Adjusting Suicide Rates in a Military Population: Methods to Determine the
Appropriate Standard Population. AJPH, 108(6): 769–776.
Wehner, M.R., M.L. Shive, M-M. Chren, J. Han, A.A. Qureshi, and E. Linos. 2012. Indoor tanning and non-
melanoma skin cancer: systematic review and meta-analysis. BMJ, 345: e-5909. doi: 10.1136/bmj.e5909.
White, D.W, J.C. Wenke, D.S. Mosely, S.B. Mountcastle, and C.J. Basamania. 2007. Incidence of Major Tendon
Ruptures and Anterior Cruciate Ligament Tears in US Army Soldiers. Am J Sports Med, 35(8): 1308–1314.
Wilson, K. and D. Brookfield. 2009. Effect of Goal Setting on Motivation and Adherence in a Six Week Exercise
Program. Int J Sport Exerc Psychol. 7(1):89–100.
World Health Organization (WHO). 2018. The Known Health Effects of UV – Frequently Asked Questions. http://
www.who.int/uv/faq/uvhealtfac/en/index2.html (accessed June 2018).
WHO Expert Committee on Drug Dependence. 2017. 5F-ADB: Critical Review Report. http://www.who.int/
medicines/access/controlled-substances/CriticalReview_5F-ADB.pdf (accessed 8 June 2018).
REFERENCES 139](https://image.slidesharecdn.com/2018healthoftheforcereport-190324192115/85/2018-healthoftheforcereport-143-320.jpg)