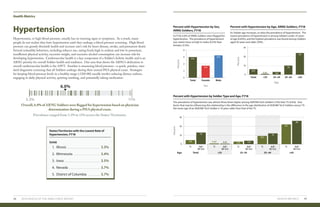
The document provides an introduction to the 2019 Health of the U.S. Army National Guard Force Report. It discusses the roles and responsibilities of different types of Army National Guard soldiers including Traditional Soldiers, Active Guard Reserve soldiers, and National Guard dual-status technicians. It notes key differences between these groups in terms of their service obligations, access to health insurance, and age distributions. The introduction explains that the report aims to describe population health metrics and trends among Army National Guard soldiers based on leading health indicators and measures of military readiness in order to help leaders identify challenges and opportunities to improve soldier health and readiness.


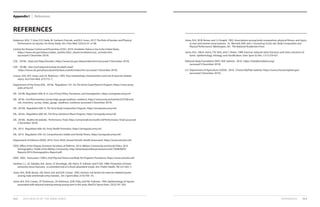
![State Profile Summaries
104 2019 HEALTH OF THE ARNG FORCE
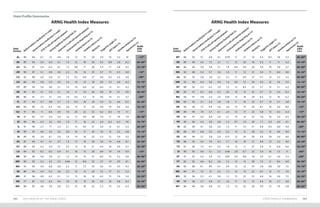
* Please see page 42 for a description of the aerobic activity target. * Please see page 42 for a description of the aerobic activity target.
STATE PROFILE SUMMARIES 105
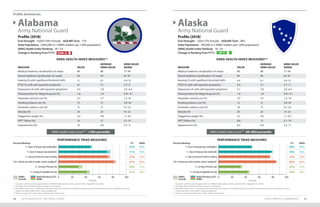
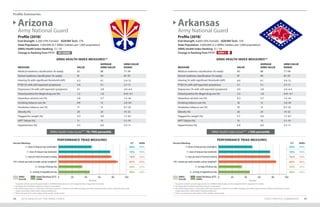
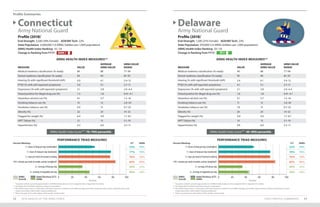
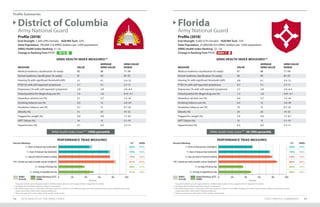
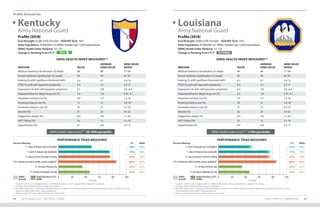
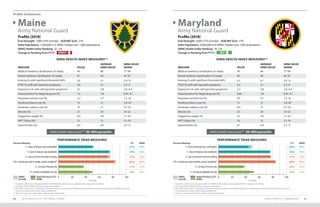
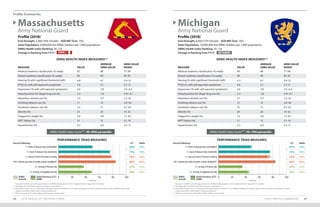
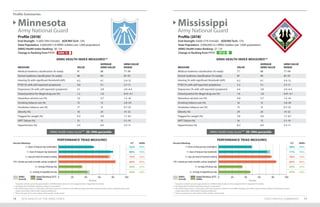
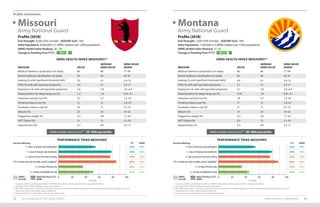
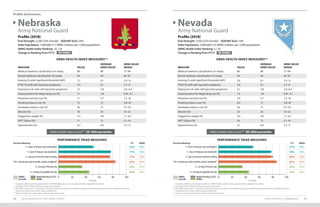
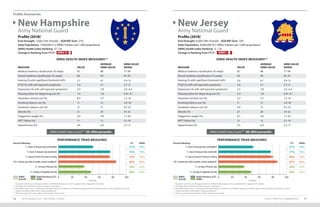
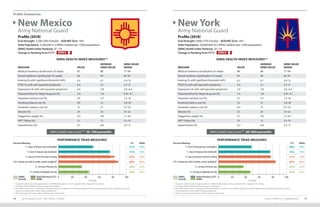
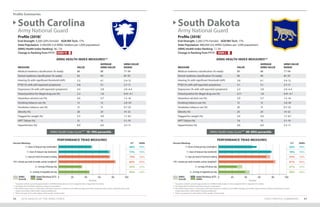
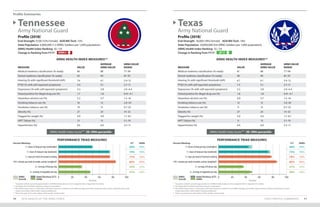
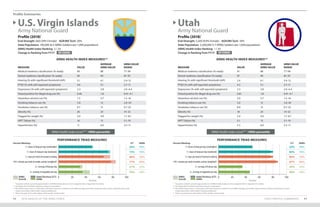
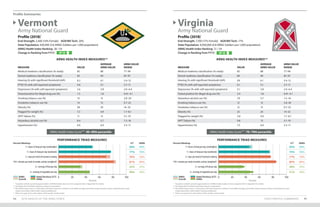
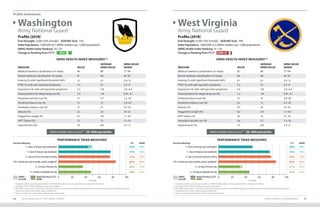
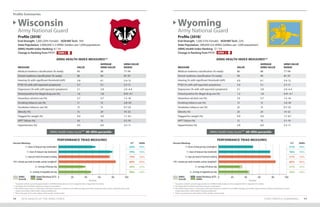
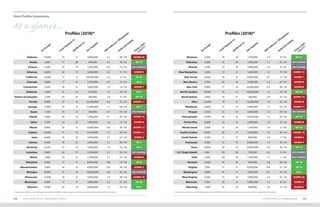
Performance Triad Measures Performance Triad Measures
AL 47 71 72 81 29 41
AK 49 79 75 85 32 43
AZ 48 76 78 87 34 46
AR 50 76 76 85 33 46
CA 46 75 78 86 37 49
CO 52 80 80 86 38 51
CT 53 77 76 83 35 45
DE 52 76 76 82 35 43
DC 45 73 75 81 38 51
FL 50 74 79 86 36 48
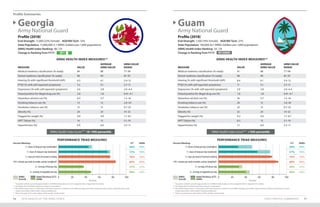
GA 44 72 76 84 37 48
GU 29 57 79 88 30 40
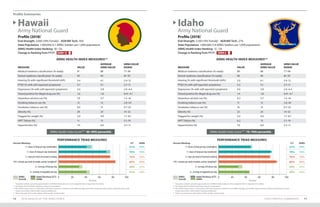
HI 41 70 76 83 30 41
ID 47 78 76 86 29 45
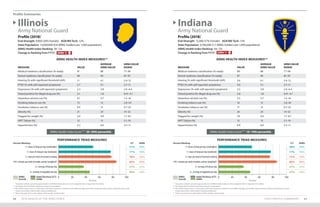
IL 51 77 78 85 37 46
IN 49 77 75 86 37 47
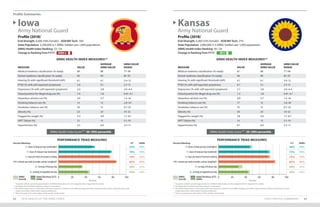
IA 53 78 74 85 34 43
KS 46 73 73 82 29 43
KY 48 74 76 85 34 46
LA 45 72 72 85 34 45
ME 51 74 72 82 37 50
MD 44 76 77 84 38 52
MA 50 75 78 84 37 49
MI 47 75 72 83 35 43
MN 52 80 73 83 34 42
MS 49 71 78 85 35 47
MO 54 78 76 85 36 51
MT 54 79 75 88 33 42
NE 52 77 75 83 34 44
NV 51 78 80 86 35 43
NH 51 76 74 85 38 48
NJ 51 77 80 87 38 48
NM 51 75 82 88 33 43
NY 48 76 77 84 37 47
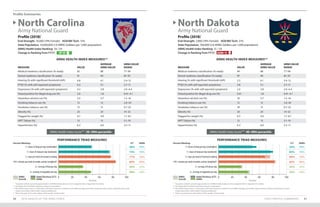
NC 48 74 77 84 36 48
ND 56 80 68 82 33 43
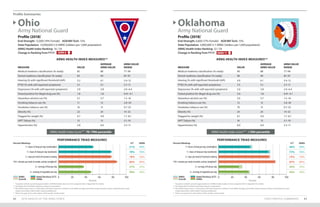
OH 51 78 78 86 37 48
OK 46 73 74 83 30 44
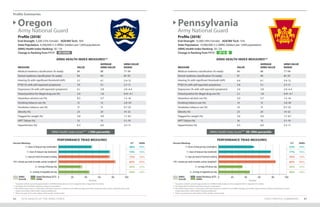
OR 48 74 73 82 32 44
PA 52 77 76 84 35 46
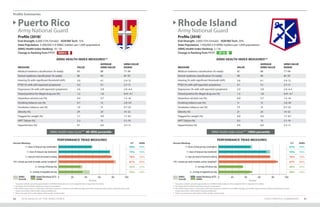
PR 49 75 78 81 32 35
RI 47 70 76 87 36 49
SC 48 73 74 82 33 45
SD 56 78 70 81 27 39
TN 50 74 75 84 33 47
TX 44 73 78 86 37 49
VI 50 73 66 77 31 35
UT 50 80 80 87 35 46
VT 50 77 70 81 32 46
VA 45 75 77 85 38 51
WA 43 77 75 84 36 48
WV 50 75 78 85 31 45
WI 54 79 74 84 39 48
WY 51 76 77 84 31 43
ARNG 49 76 76 84 35 46 ARNG 49 76 76 84 35 46
State/
Territory
State/
Territory
2+ servings of
vegetables per day
(%)
2+ servings of
vegetables per day
(%)
2+ servings of
fruits per day
(%)
2+ servings of
fruits per day
(%)
2+ days per week of
resistance training
(%)
2+ days per week of
resistance training
(%)
7+ hours of sleep
[weekends] (%)
7+ hours of sleep
[weekends] (%)
7+ hours of sleep
[weeknights] (%)
7+ hours of sleep
[weeknights] (%)
150+ minutes per week
of aerobic activity*
(%)
150+ minutes per week
of aerobic activity *
(%)](https://image.slidesharecdn.com/2019health-of-the-arng-force-200525180719/85/2019-health-of-the-arng-force-report-54-320.jpg)