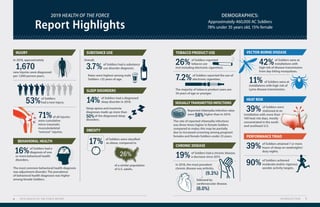
The document is the 2019 Health of the Force Report, which provides population health data and metrics for over 460,000 U.S. Army Active Component soldiers stationed at 40 installations worldwide. Some key highlights include:
- In 2018, 7-12% of soldiers were non-deployable, with 70% due to medical non-readiness issues like musculoskeletal injuries and behavioral health disorders.
- New in 2019, most medical and personnel data is provided through a partnership with the Army Analytics Group, allowing for more granular analysis.
- A new environmental health indicator quantifies heat risk days at installations, which could impact training.
- Common health issues included injuries (53% of soldiers had a new

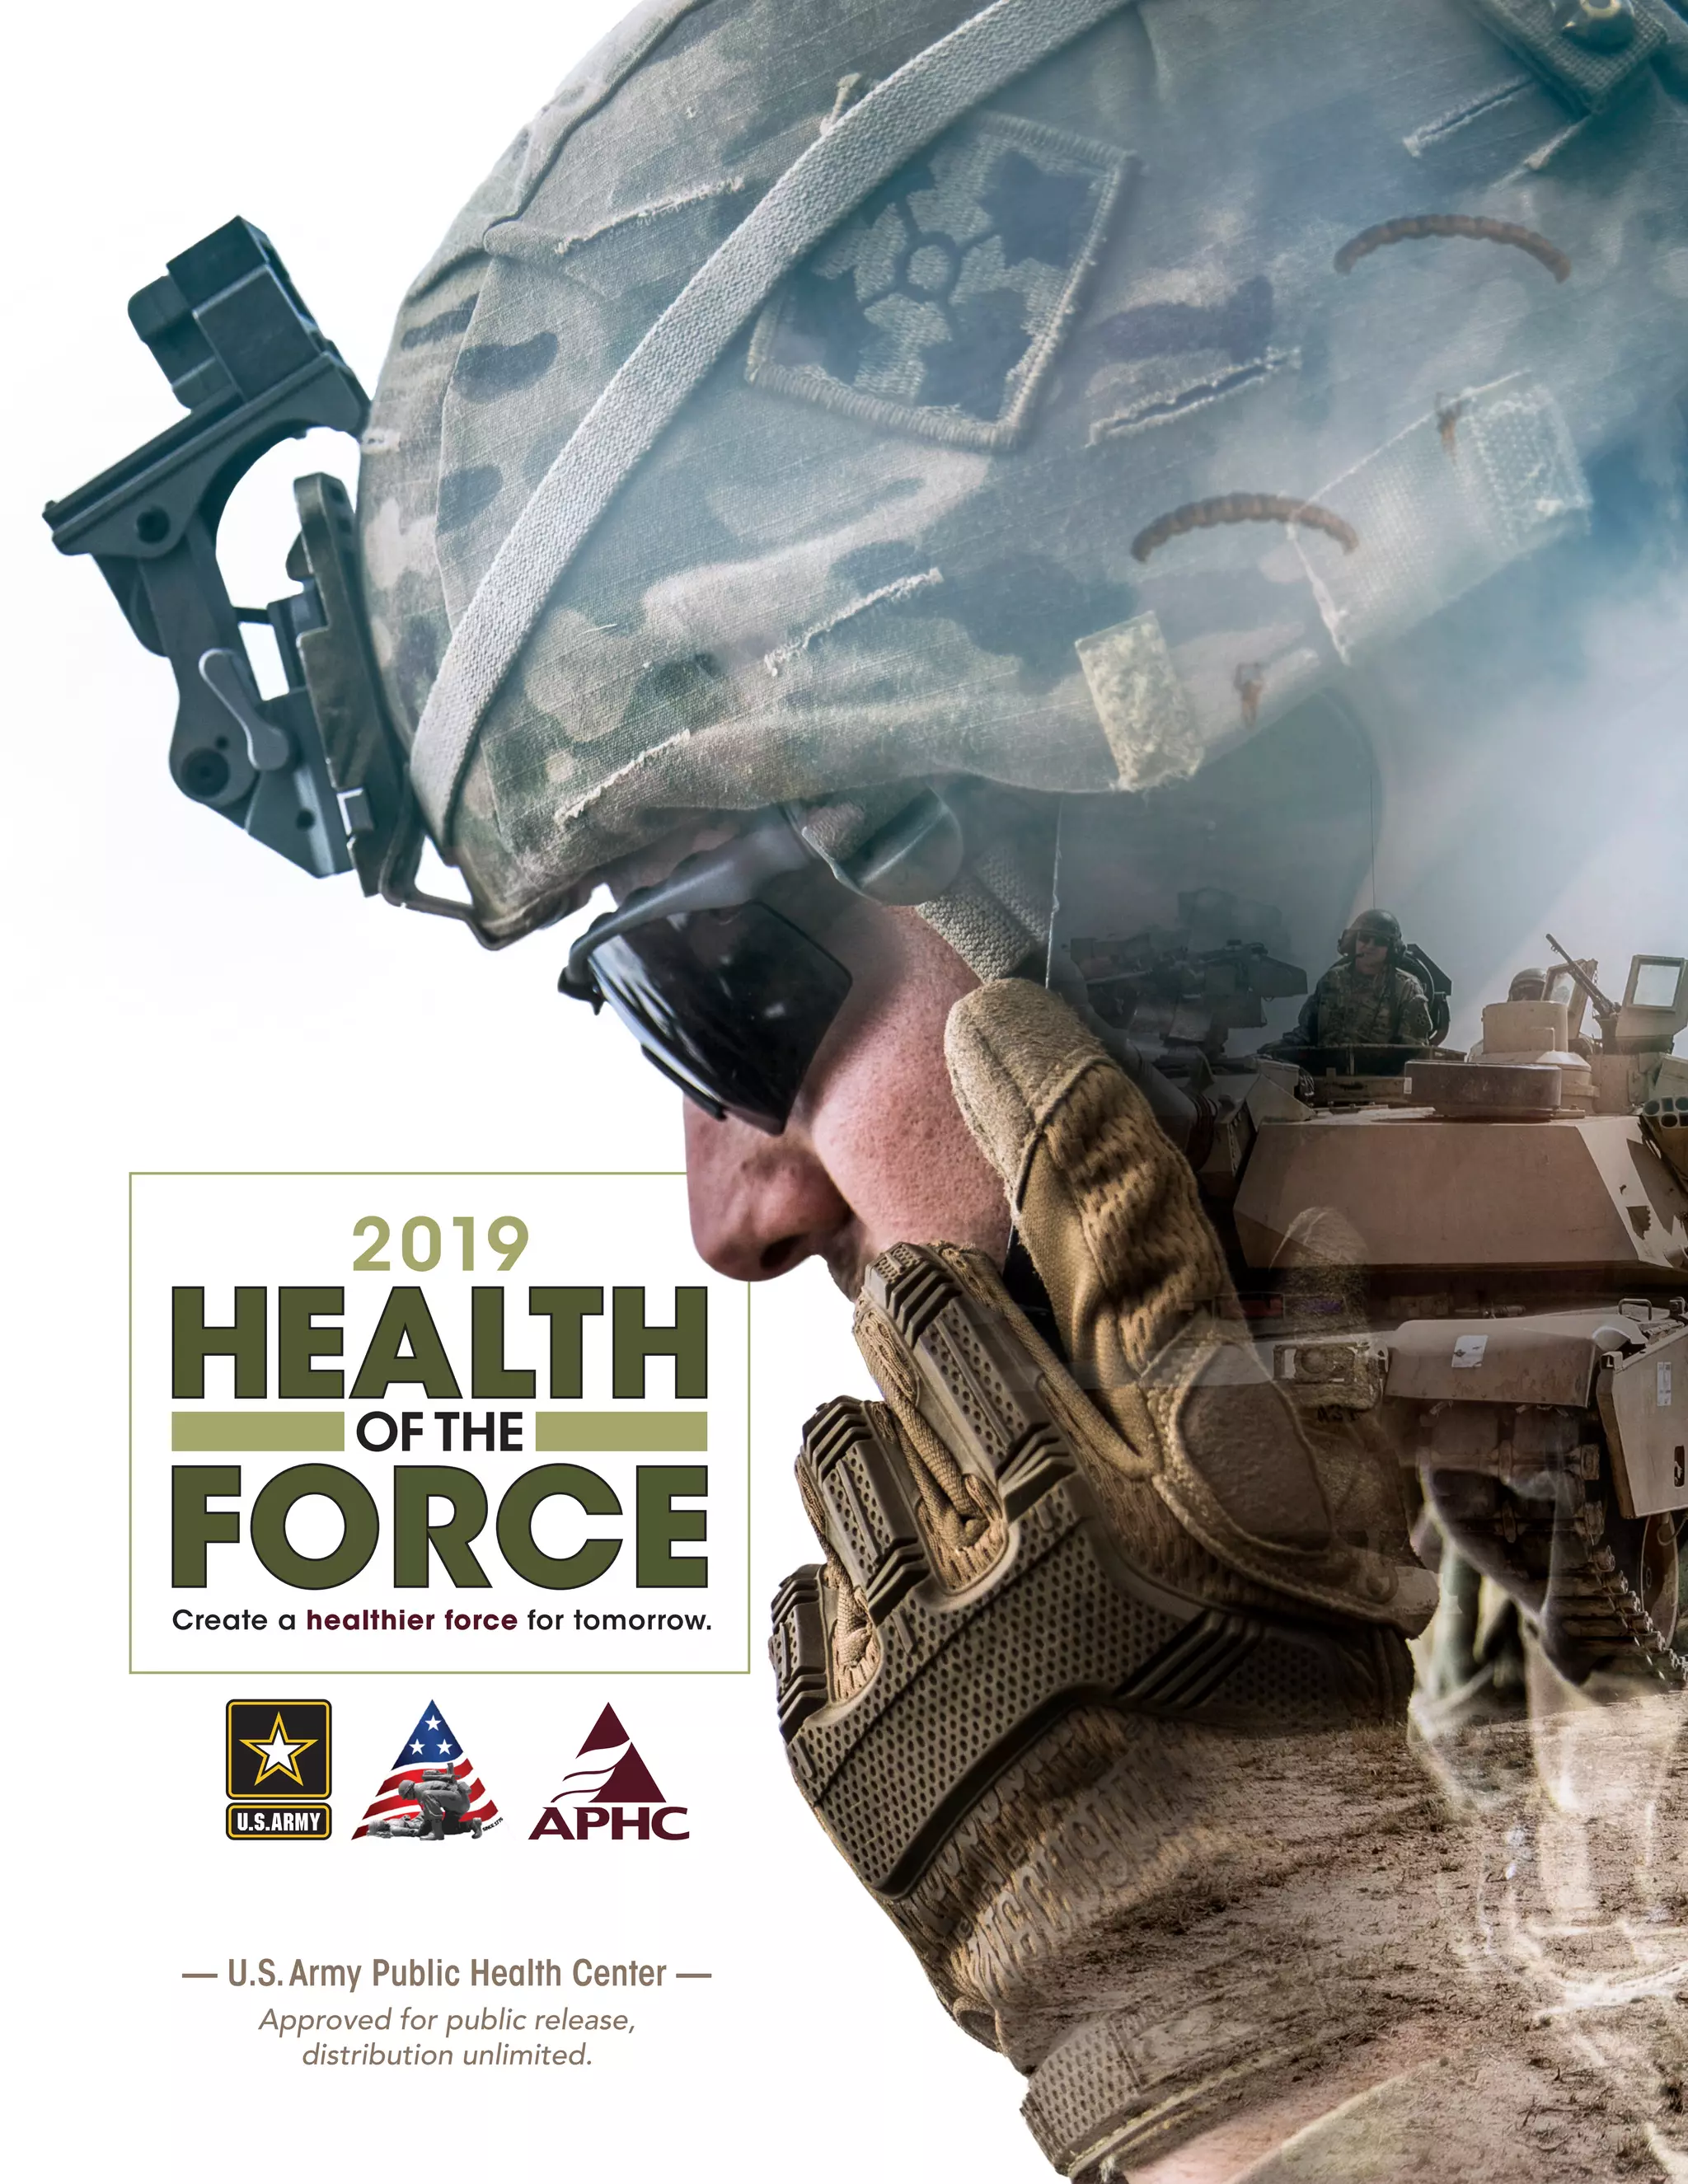
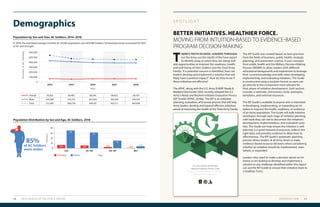
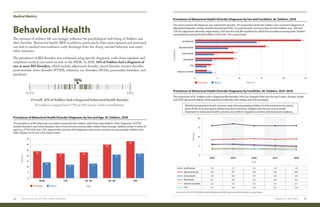
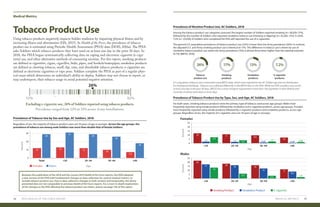
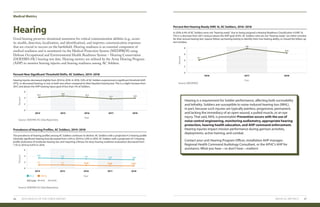
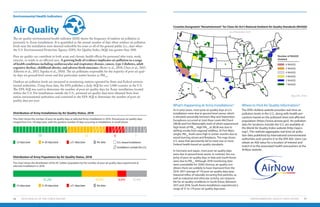
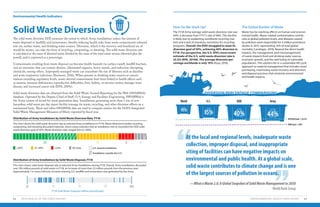
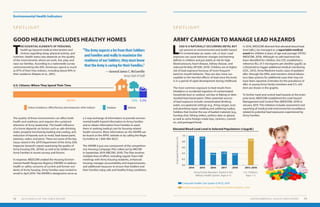
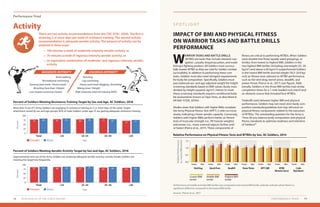
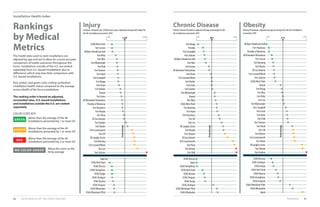
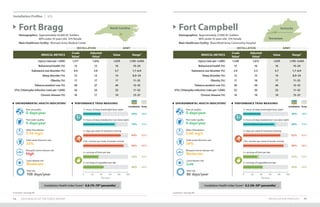
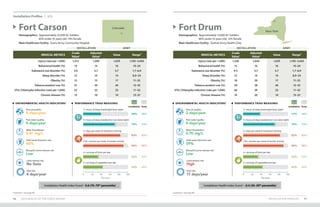
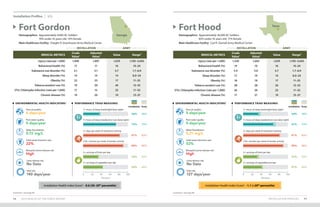
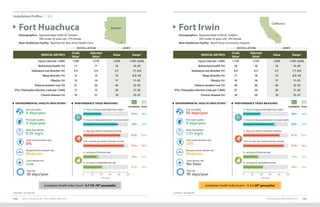
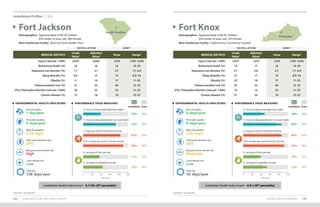
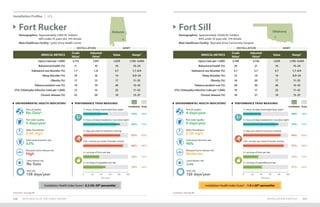
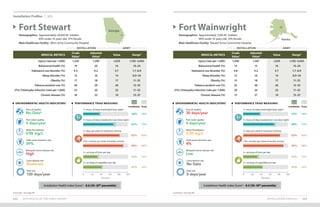
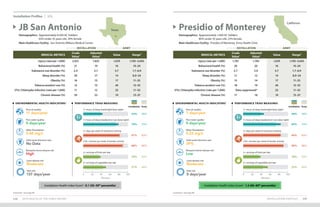
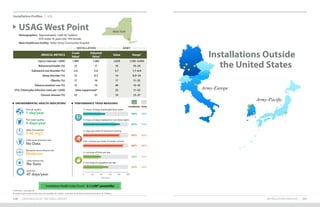
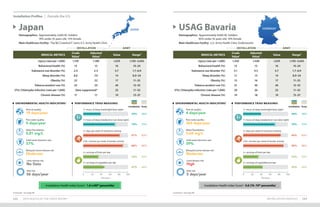
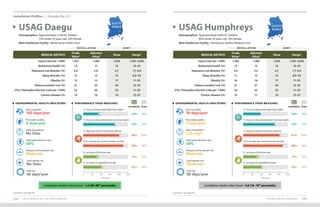
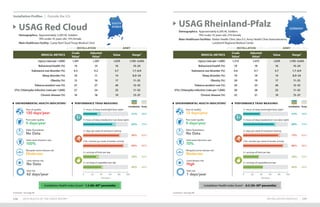
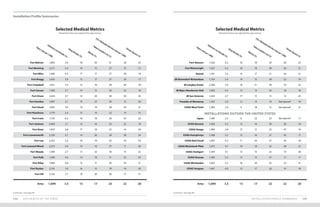

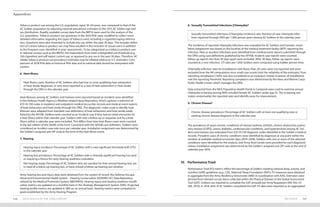
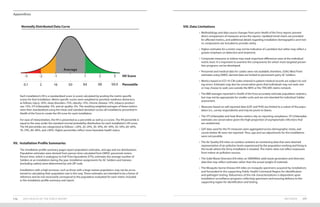
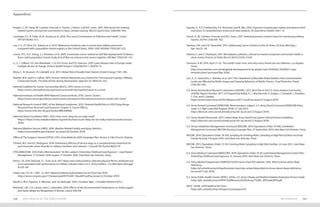
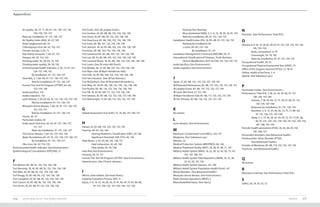
7+hoursofsleep[weeknights](%)
7+hoursofsleep[weekends](%)
7+hoursofsleep[weekends](%)
150+minutesperweek
ofaerobicactivity*(%)
150+minutesperweek
ofaerobicactivity*(%)
2+daysperweekof
resistancetraining(%)
2+daysperweek
ofresistancetraining(%)
2+servingsoffruitsperday(%)
2+servingsoffruitsperday(%)
2+servingsofvegetablesperday(%)
2+servingsofvegetablesperday(%)
Army 39 73 83 90 35 44 Army 39 73 83 90 35 44
Performance Triad Performance Triad](https://image.slidesharecdn.com/2019health-of-the-force-200525180343/85/Army-2019-Health-of-the-Force-71-320.jpg)
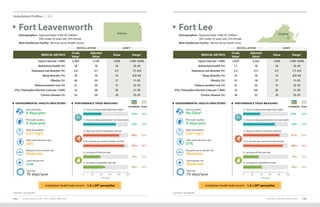
![APPENDICES
• Methods
• Acknowledgments
• References
• Acronyms and Abbreviations
• Index
Appendices
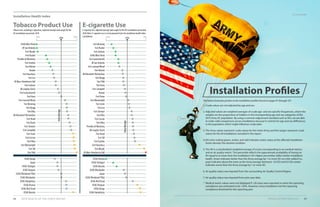
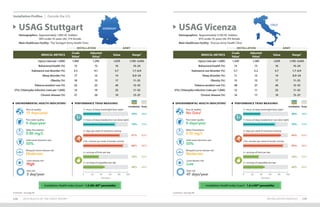
METHODS 141140 2019 HEALTH OF THE FORCE REPORT
METHODS
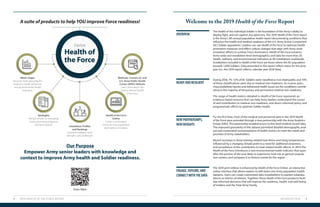
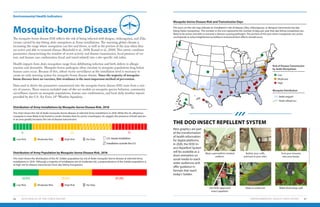
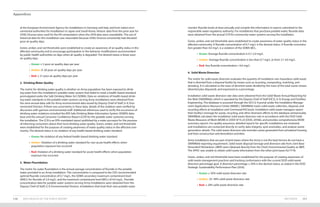
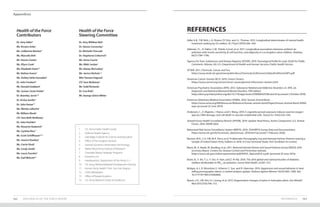
I. Methodological and Data Updates
The 2019 edition of Health of the Force includes methodological and data updates which limit direct
comparison to prior reports. Changes that affected more than one metric are summarized below,
and metric-specific changes are included in subsequent sections.
• The most notable change with this iteration of the Health of the Force report was the use
of the Army Analytics Group (AAG) as the medical encounter and personnel data provider.
Last year, the Armed Forces Health Surveillance Branch (AFHSB) provided these data to
the U.S. Army Public Health Center (APHC). While this change improved the APHC’s ana-
lytic capability, differences in data processing between data providers may have affected
the results generated for metrics derived from medical data (i.e., injury, behavioral health,
substance use, sleep disorders, obesity, and chronic disease). However, both the AAG and
AFHSB rely on the same data sources (i.e., Military Health System [MHS] Data Repository
[MDR] and Defense Manpower Data Center [DMDC]).
• Deployed personnel were not excluded from analyses for the 2019 Health of the Force
report, as was the case in previous editions. In 2018, DMDC reported data quality issues
with the Contingency Tracking System, which precluded accurate identification of
deployed Soldiers. Although operational tempo was low in 2018, the inability to identify
and exclude deployed personnel from analyses may result in underestimation of inci-
dence measures. Some installations may have been impacted more than others by this
change in methodology.
• As with the 2018 edition of the report, Joint Base Lewis-McChord (JBLM) was excluded
due to its transition to MHS Genesis in the fall of 2017. JBLM population statistics that were
unaffected by the MHS Genesis implementation are reported as part of the Army Active
Component (AC) community demographics and the environmental health indicators (EHIs).
• Soldiers’ age was calculated as the difference between the first day of the calendar year
(January 01, 2018) and the Soldier’s date of birth, rather than using the midpoint of the
year, as was done in previous years. This change allowed us to stabilize the age categories
across all data sources.
• When appropriate, multi-year trend charts were included to provide historical Army-wide
estimates. For these presentations, medical metrics for prior years were reanalyzed using
the same methodology and data provider used for the 2018 metrics. Medical metrics may
differ from the corresponding estimates presented in previous Health of the Force edi-
tions. For the most part, 5-year trends are reported (2014–2018); however, injury data were
restricted to 3 calendar years (2016–2018) due to the October 2015 International Classifica-
tion of Diseases, 10th
revision, Clinical Modification (ICD-10-CM) conversion. The ICD-CM-10
medical diagnosis codes used as the foundation for the APHC injury taxonomy and injury
definition are updated annually by the World Health Organization and the Centers for
Disease Control and Prevention (CDC) (APHC, 2017a).](https://image.slidesharecdn.com/2019health-of-the-force-200525180343/85/Army-2019-Health-of-the-Force-72-320.jpg)
![METHODS 155154 2019 HEALTH OF THE FORCE REPORT
Appendices
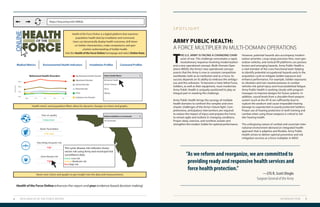
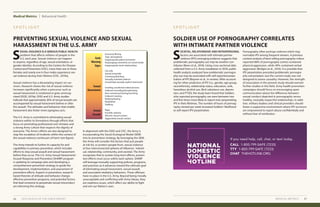
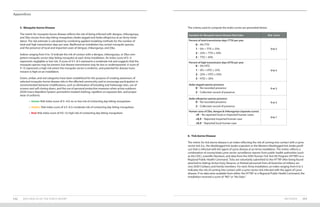
The criteria used to compute the index scores are presented below.
Variables for Tick-borne Disease Risk Index Risk Score
Installation was in the CDC predicted range for either Lyme vector tick species
(I. scapularis or I. pacificus), as published by Eisen et al., 2016.
0 - No Lyme vector tick present,
1 - Lyme vector tick reported,
2 - Lyme vector tick established
0 to 2
The CDC has documented cases of Lyme disease within the last 10 years from
within the county where the installation is located (CDC, 2017e).
0 - False
1 - True
0 or 1
Human-biting ticks submitted to the HTTKP (or a Regional Public Health
Command) in 2018 were identified as Lyme vector ticks.
0 - False
1 - True
0 or 1
Lyme vector ticks submitted to the HTTKP (or a Regional Public Health
Command) in 2018 were positive for Lyme disease pathogen.
0 - False
1 - True
0 or 1
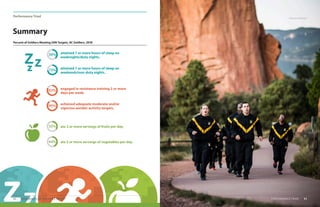
Green, amber, and red categories have been established for the purpose of creating awareness of
Lyme disease risk in the affected community, and to encourage participation in surveillance pro-
grams such as the HTTKP and in the recommended behavior modifications, such as conducting
tick-checks, using repellent, and adhering to the DOD Insect Repellent System.
• Green: Index score of 0–1; no or low risk of contacting a Lyme vector tick
• Amber: Index score of 2–3; moderate risk of contacting a Lyme vector tick
• Red: Index score of 4–5; high risk of contacting a Lyme vector tick
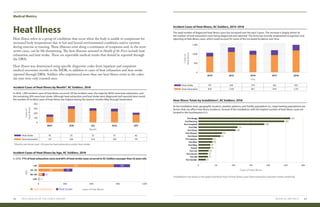
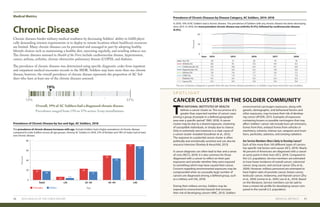
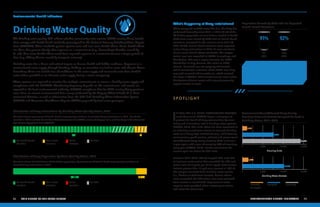
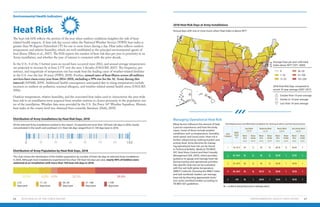
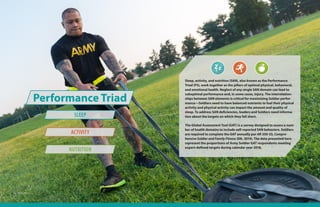
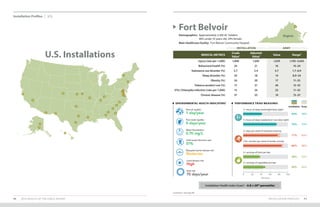
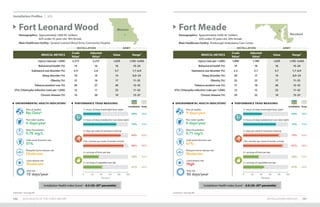
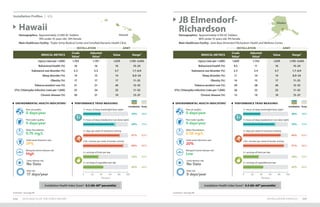
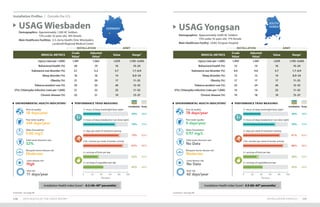
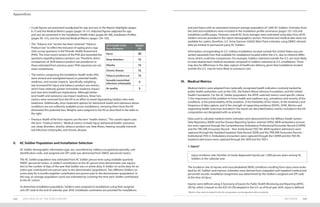
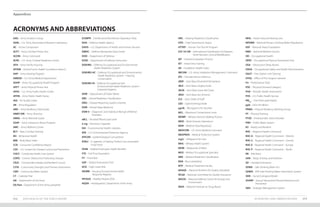
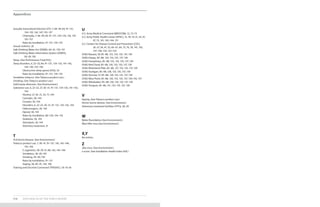
7. Heat Risk
The metric for heat risk reflects the portion of the year when outdoor temperatures heighten the
risk of heat-related health impacts, and whether the year of interest is consistent with or different
from the prior 10-year period. Heat risk days are calculated as the number of days in a calendar year
with at least 1 hour when the heat index is above 90⁰F. This corresponds to an outdoor heat status
of “Extreme Caution” as classified by the National Weather Service.
Hourly measurements for outdoor temperature and relative humidity are obtained from land-based
airport weather stations in closest proximity to installation cantonment areas or population centers.
Using these data, the U.S. Air Force 14th
Weather Squadron computes hourly heat index values for
each location of interest. Annual heat risk days are calculated for the year of interest and each of the
10 years prior to the year of interest. The mean and standard deviation (SD) for the prior 10 years are
calculated. Annual heat risk days for the year of interest are compared to the prior 10-year average
± 1 SD to show whether the year of interest is consistent with the prior decade, or if the year of inter-
est trended higher or lower than the recent past.
VI. Installation Health Index (IHI)
Health indices are widely used to gauge the overall health of populations. Such indices can be used
to rank communities (e.g., installations) relative to each other, which can drive community interest
and motivate improvements in public health. Healthcare and public health decision makers should
take care to review individual measures that comprise these indices in order to identify and effec-
tively target key outcomes or behaviors that have the most significant adverse effects on health and
readiness for each installation.
The core metrics included in this report were prioritized for inclusion and weighting in the IHI cal-
culation based jointly on the prevalence of the condition or factor, the potential health or readiness
impact, the preventability of the condition or factor, the validity of the data, supporting evidence,
and the importance to Army leadership. Although behavioral health impacts readiness, the behav-
ioral health medical metric was not included in the IHI for 2018 to avoid stigmatizing Soldiers who
seek treatment, and because treatment options for behavioral health conditions are not uniformly
available across all installations.
In generating an IHI, six selected medical metrics (injury, obesity, sleep disorders, chronic disease,
tobacco product use, and STIs [chlamydia]) for each included installation were individually standard-
ized to the average across these installations using z-scores. The medical metrics were adjusted by
age and sex prior to standardization to allow more valid comparisons. Z-scores follow a standard
normal distribution, and reflect the number of standard deviations (amount of variation in data val-
ues for a given metric) the installation is from the average for that medical metric. Values above the
average have positive z-scores, while values below the average have negative z-scores.
The IHI also includes one installation environmental health metric – number of poor air quality
days. The poor air quality days data are not normally distributed, and vary widely by geographic
location, particularly for installations outside the U.S., where the number of poor air quality days
were especially high relative to the mean across all installations. Accordingly, the number of poor air
quality days at each installation was scored as follows for use in calculating the IHI: installations with
missing or non-reported air quality data received an air quality score of 0, and thus do not affect the
IHI score; installations with no reported poor air quality days received an air quality score of 2, the
highest (best) possible score; installations with between 1 and 4 poor air quality days received an air
quality score of 1; installations with between 5 and 20 poor air quality days received an air quality
score of -1; and installations with greater than 20 poor air quality days received an air quality score
of -2, the lowest (worst) possible score. These categories align with those used in the Environmental
Health Indicator – Air Quality section of Health of the Force.](https://image.slidesharecdn.com/2019health-of-the-force-200525180343/85/Army-2019-Health-of-the-Force-79-320.jpg)
![Appendices
ACKNOWLEDGMENTS 159158 2019 HEALTH OF THE FORCE REPORT
• The Tick-borne Disease EHI relies on tick specimens submitted to the DOD HTTKP for
identification and pathogen testing. Robustness of the risk estimate is dependent upon
installation populations submitting human ticks to the HTTKP for analysis.
Suggested citation
U.S. Army Public Health Center. 2020. 2019 Health of the Force, [ https://phc.amedd.army.mil/topics/campaigns/hof ].
Joseph Abraham, ScD1
Health of the Force Senior Epidemiologist
Clinical Public Health and Epidemiology Directorate
Amy Millikan Bell, MD, MPH1
Health of the Force Chair
APHC Medical Advisor
Matthew Beymer, PhD, MPH1,2,5
Health of the Force Editor-in-Chief
Armed Forces Health Surveillance Branch
Jill Brown, PhD1
Health of the Force Sleep, Activity, and Nutrition Team Lead
Public Health Assessment Division
Jason Embrey1
Health of the Force Senior Designer
Visual Information Division
Andrew Fiore1,3
ORISE Fellow
Population Health Reporting Program
Christopher Hill, MPH, CPH1
Epidemiologist
Behavioral and Social Health Outcomes Program
Matthew Inscore, MPH1
Health of the Force Chief Epidemiologist
Disease Epidemiology Program
Nikki Jordan, MPH1
Senior Epidemiologist
Disease Epidemiology Program
Alexis Maule, PhD1,2,7
Epidemiologist
Armed Forces Health Surveillance Branch
Lisa Polyak, MSE, MHS1
Health of the Force Environmental Health Metrics Team Lead
Directorate of Environmental Health Sciences and Engineering
Anne Quirin1,5
Health of the Force Technical Editor
Publication Management Division
Lisa Ruth, PhD1
Health of the Force Product Manager
Population Health Reporting Program
George (Ginn) White1
Health of the Force Product Advisor
Public Health Communication Directorate
Shaina Zobel1
Health of the Force Project Operations
Population Health Reporting Program
Health of the Force
Working Group
ACKNOWLEDGMENTS](https://image.slidesharecdn.com/2019health-of-the-force-200525180343/85/Army-2019-Health-of-the-Force-81-320.jpg)
![Appendices
Center for Public Health Systems Science (CPHSS) and the Tobacco Control Legal Consortium. 2014. Pricing
Policy: A Tobacco Control Guide. St. Louis, Missouri.
Centers for Disease Control and Prevention (CDC). 2020. How much physical activity do adults need?
https://www.cdc.gov/physicalactivity/basics/adults/index.htm (accessed January 2020).
CDC. 2019a. Preventing Sexual Violence,
https://www.cdc.gov/violenceprevention/sexualviolence/fastfact.html (accessed 11 October 2019).
CDC. 2019b. Zoonotic Diseases,
https://www.cdc.gov/onehealth/basics/zoonotic-diseases.html (accessed 22 July 2019).
CDC. 2019c. Measles (Rubeola),
https://www.cdc.gov/measles/index.html (accessed 19 September 2019).
CDC. 2019d. Measles Cases and Outbreaks,
https://www.cdc.gov/measles/cases-outbreaks.html (accessed 29 January 2020).
CDC. 2017. How much sleep do I need?
https://www.cdc.gov/sleep/about_sleep/how_much_sleep.html (accessed 24 October 2019).
CDC. 2015. Measles. In: Hamborsky, J., A. Kroger, and C. Wolfe, eds. Epidemiology and Prevention of Vaccine-
Preventable Diseases. 13th
Edition, https://www.cdc.gov/vaccines/pubs/pinkbook/meas.html (accessed 19
September 2019).
CDC. 2012. Low Level Lead Exposure Harms Children: A Renewed Call for Primary Prevention, Report of the Advisory
Committee on Childhood Lead Poisoning Prevention,
https://www.cdc.gov/nceh/lead/acclpp/Final_Document_030712.pdf (accessed 26 November 2019).
CDC/NIOSH. 2012. Cancer Clusters,
https://www.cdc.gov/niosh/topics/cancer/clusters.html
Chang, A.M., D. Aeschback, J.F. Duffy, and C.A. Czeisler. 2015. Evening Use of Light-Emitting e-Readers
Negatively Affects Sleep, Circadian Timing, and Next-Morning Alertness. PNAS 112(4):1232–7.
Chen, H., J.C. Kwong, R. Copes, et al. 2017. Exposure to ambient air pollution and the incidence of dementia: A
population-based cohort study. Environ Int 108:271–277.
Code of Federal Regulations. 2019. Title 40, Part 141, National Primary Drinking Water Regulations, Subpart I –
Control of Lead and Copper,
https://www.ecfr.gov/cgi-bin/ECFR?page=browse
Composite Health Care System (CHCS). 2019. Health Level 7, Chemistry Data System. Falls Church, Virginia:
Defense Health Agency.
Crimmins, A., J. Balbus, J.L. Gamble, et al., eds. 2016. The Impacts of Climate Change on Human Health in the
United States: A Scientific Assessment, http://dx.doi.org/10.7930/J0R49NQX (accessed 22 October 2019).
Cunningham, A.A. 2005. A walk on the wild side—emerging wildlife diseases. BMJ 331(7527):1214–15.
Dahl, K., and S. Udvardy. 2019. US Military on the Front Lines of Extreme Heat,
https://www.ucsusa.org/resources/us-military-bases-risk-extreme-heat (accessed 13 February 2020).
164 2019 HEALTH OF THE FORCE REPORT REFERENCES 165
Defense Health Agency. 2019. Military Health System Management Analysis and Reporting Tool (M2),
https://www.health.mil/Military-Health-Topics/Technology/Clinical-Support/Military-Health-System-
Management-Analysis-and-Reporting-Tool (accessed September 2019).
De Oliveira, C.G., and J. Nadal. 2005. Transmissibility of helicopter vibration in the spines of pilots in flight. Aviat
Space Environ Med 76:576–580.
Department of the Army (DA). Office of The Surgeon General. 2019a. Information Brief, Army Substance Abuse
Program into Substance Use Disorder Clinical Care within the Behavioral Health System of Care. Presented by
Jill Londagin, Program Director, Substance Use Disorder Clinical Care. Falls Church, Virginia.
DA. 2019b. Directive 2019-12, Policy for Voluntary Alcohol-Related Behavioral Healthcare,
https://armypubs.army.mil/epubs/DR_pubs/DR_a/pdf/web/ARN16186_AD2019-12_Web_Final.pdf
DA. 2019c. New option to treat alcohol addiction early,
https://www.army.mil/article/220022/new_option_to_treat_alcohol_addiction_early (accessed 29
November 2019).
DA. 2019d. Inspector General Special Interest Item Assessment of the Residential Communities Initiatives (RCI), 14
February–22 March 2019, Report ID-1903. Washington, D.C.
DA. 2019e. Regulation 600–9, The Army Body Composition Program, https://armypubs.army.mil
DA. Office of The Surgeon General. 2018. Information Brief, Transforming Substance Use Disorders Clinical Care
within the Army. Presented by Jill Londagin, Program Director, Substance Use Disorder Clinical Care. Falls
Church, Virginia.
DA. 2017a. Office of the Assistant Secretary of the Army for Installations, Energy and Environment. Army
Environment, Safety, and Occupational Health Strategy 2025,
www.army.mil/e2/c/downloads/472081.pdf (accessed 19 November 2019).
DA. 2017b. Regulation 670–1, Wear and Appearance of Army Uniforms and Insignia,
https://armypubs.army.mil
DA. 2015. Regulation 600–63, Army Health Promotion,
https://armypubs.army.mil
DA. 2014. Regulation 350–53, Comprehensive Soldier and Family Fitness,
https://armypubs.army.mil
DA. 2003. Technical Bulletin, Medical (TB MED) 507, Heat Stress Control and Heat Casualty Management [AFPAM
48-152(I)],
https://armypubs.army.mil
Department of Defense (DOD). 2019a. Department of Defense Annual Report on Sexual Assault in the Military
Fiscal Year 2018,
https://www.sapr.mil/reports (accessed 11 October 2019).
DOD. 2019b. Office of the Under Secretary of Defense for Acquisition and Sustainment. Report on Effects of a
Changing Climate to the Department of Defense,
https://media.defense.gov/2019/Jan/29/2002084200/-1/-1/1/CLIMATE-CHANGE-REPORT-2019.PDF (accessed
22 October 2019).
DOD. 2016a. Form 3024, Annual Periodic Health Assessment,
http://www.esd.whs.mil/dd](https://image.slidesharecdn.com/2019health-of-the-force-200525180343/85/Army-2019-Health-of-the-Force-84-320.jpg)


![Unplanned art-treatment-interruptions-in-southern-africa-final-report[1]](https://cdn.slidesharecdn.com/ss_thumbnails/unplanned-art-treatment-interruptions-in-southern-africa-final-report1-100511101150-phpapp02-thumbnail.jpg?width=640&height=640&fit=bounds)


![CASE_PRESENTATION_ON_subdural_hematoma(SDH)[1 FINAL PPT]-1.pptx](https://cdn.slidesharecdn.com/ss_thumbnails/casepresentationonsubduralhematomasdh1finalppt-1-260129172522-d405d375-thumbnail.jpg?width=640&height=640&fit=bounds)


