Download as PDF, PPTX

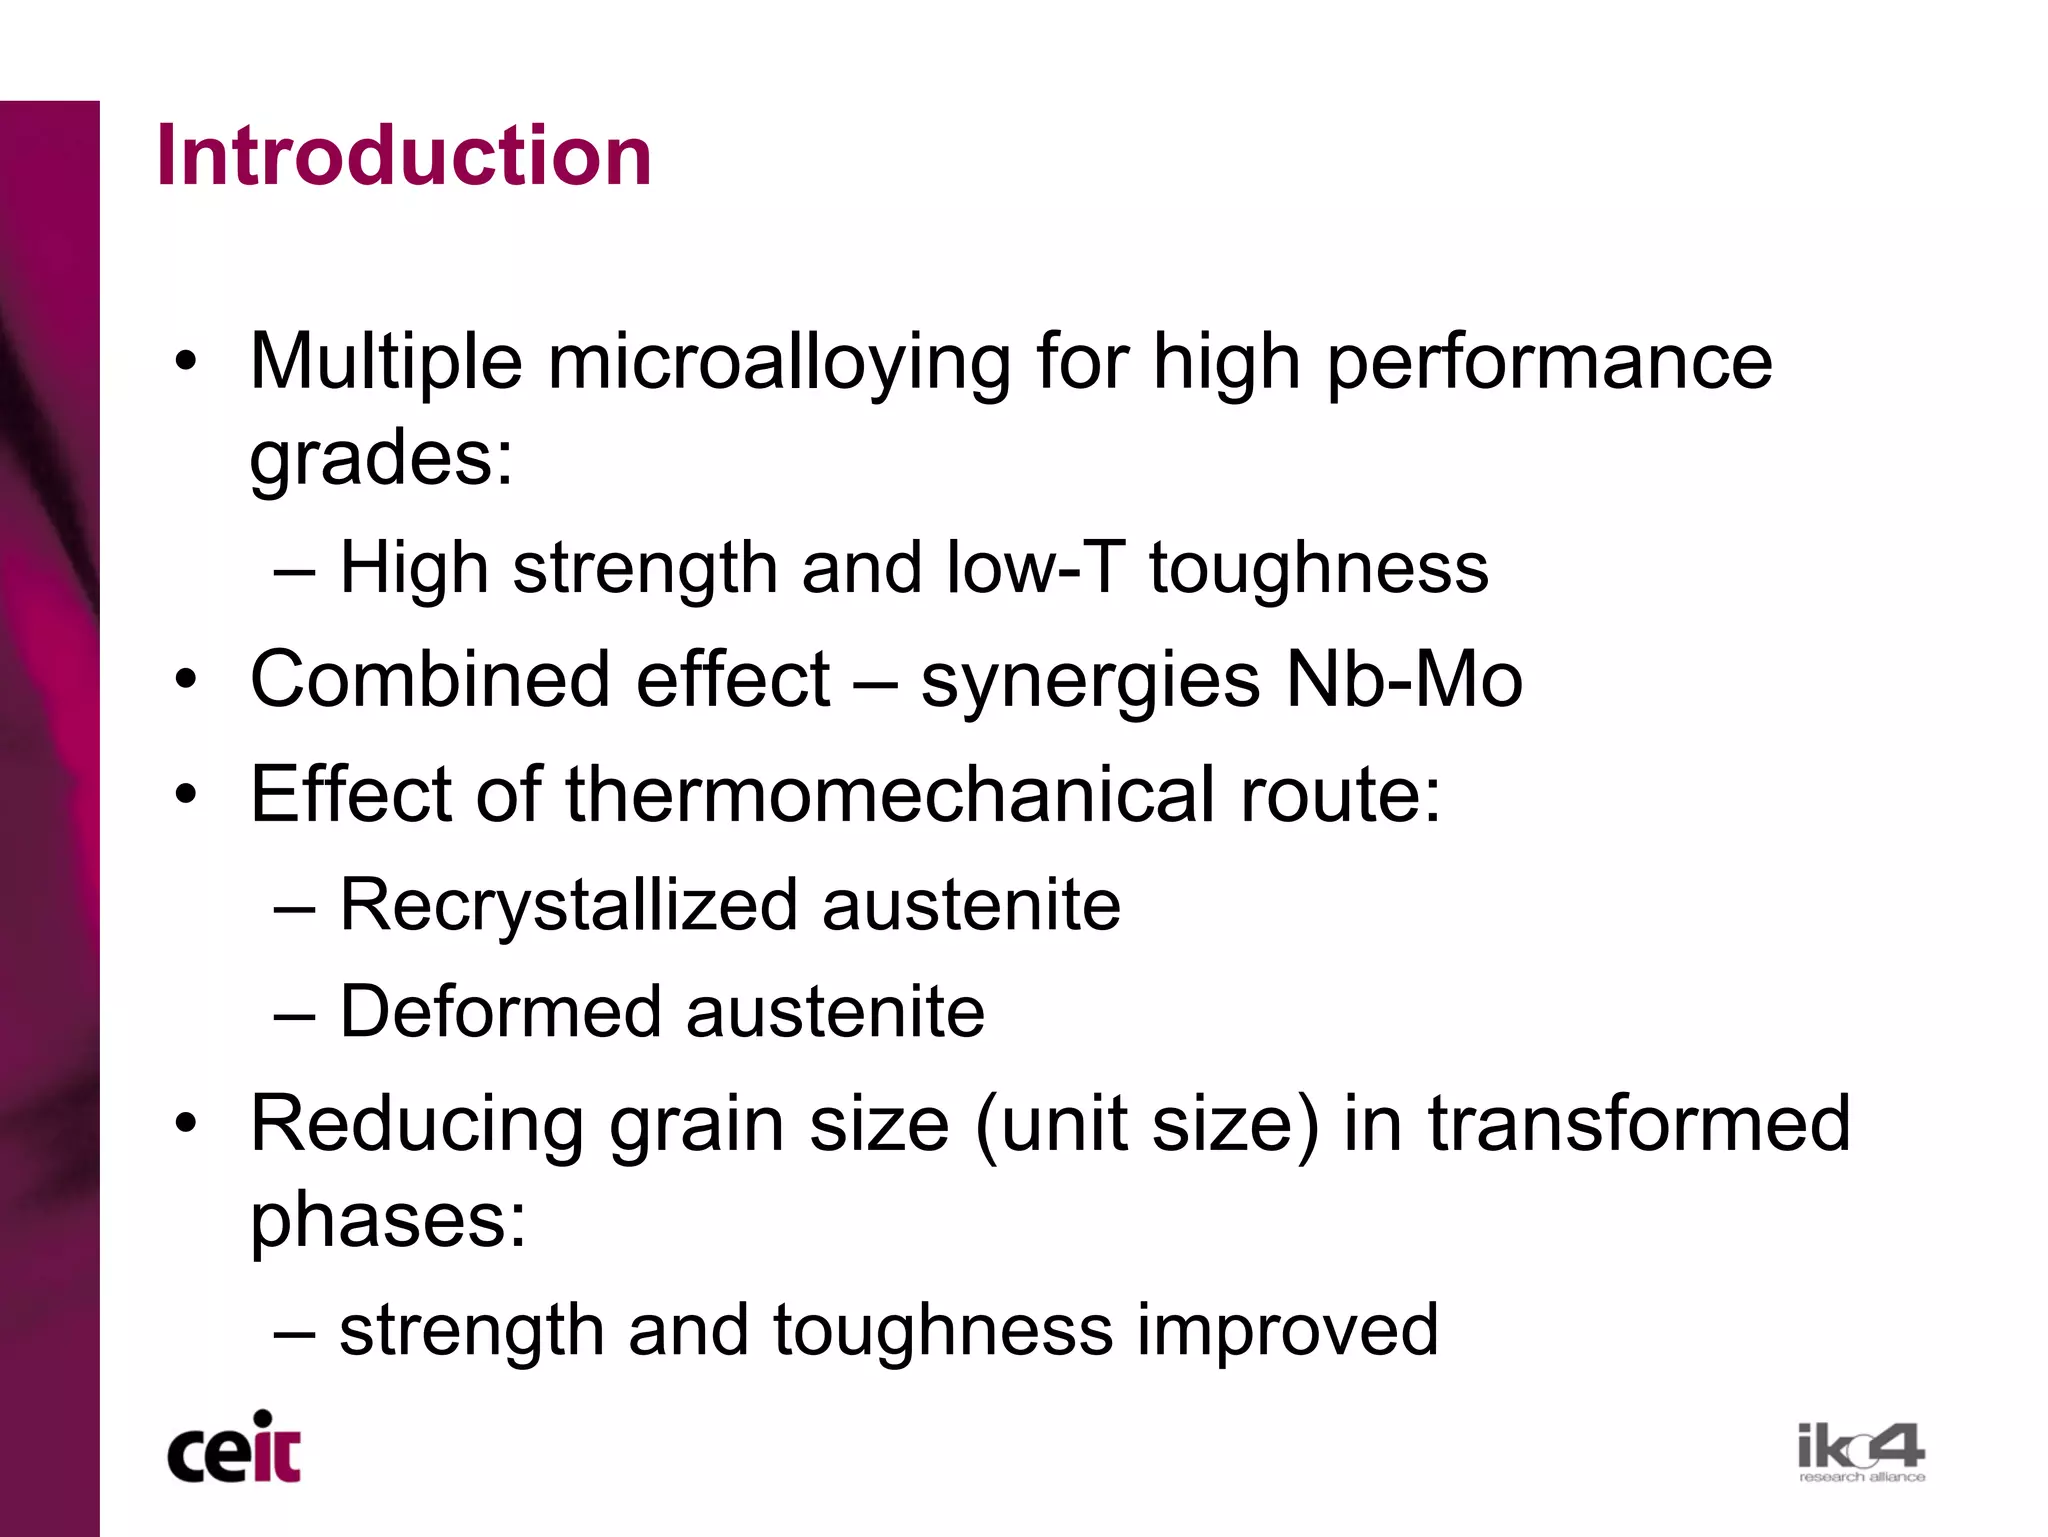
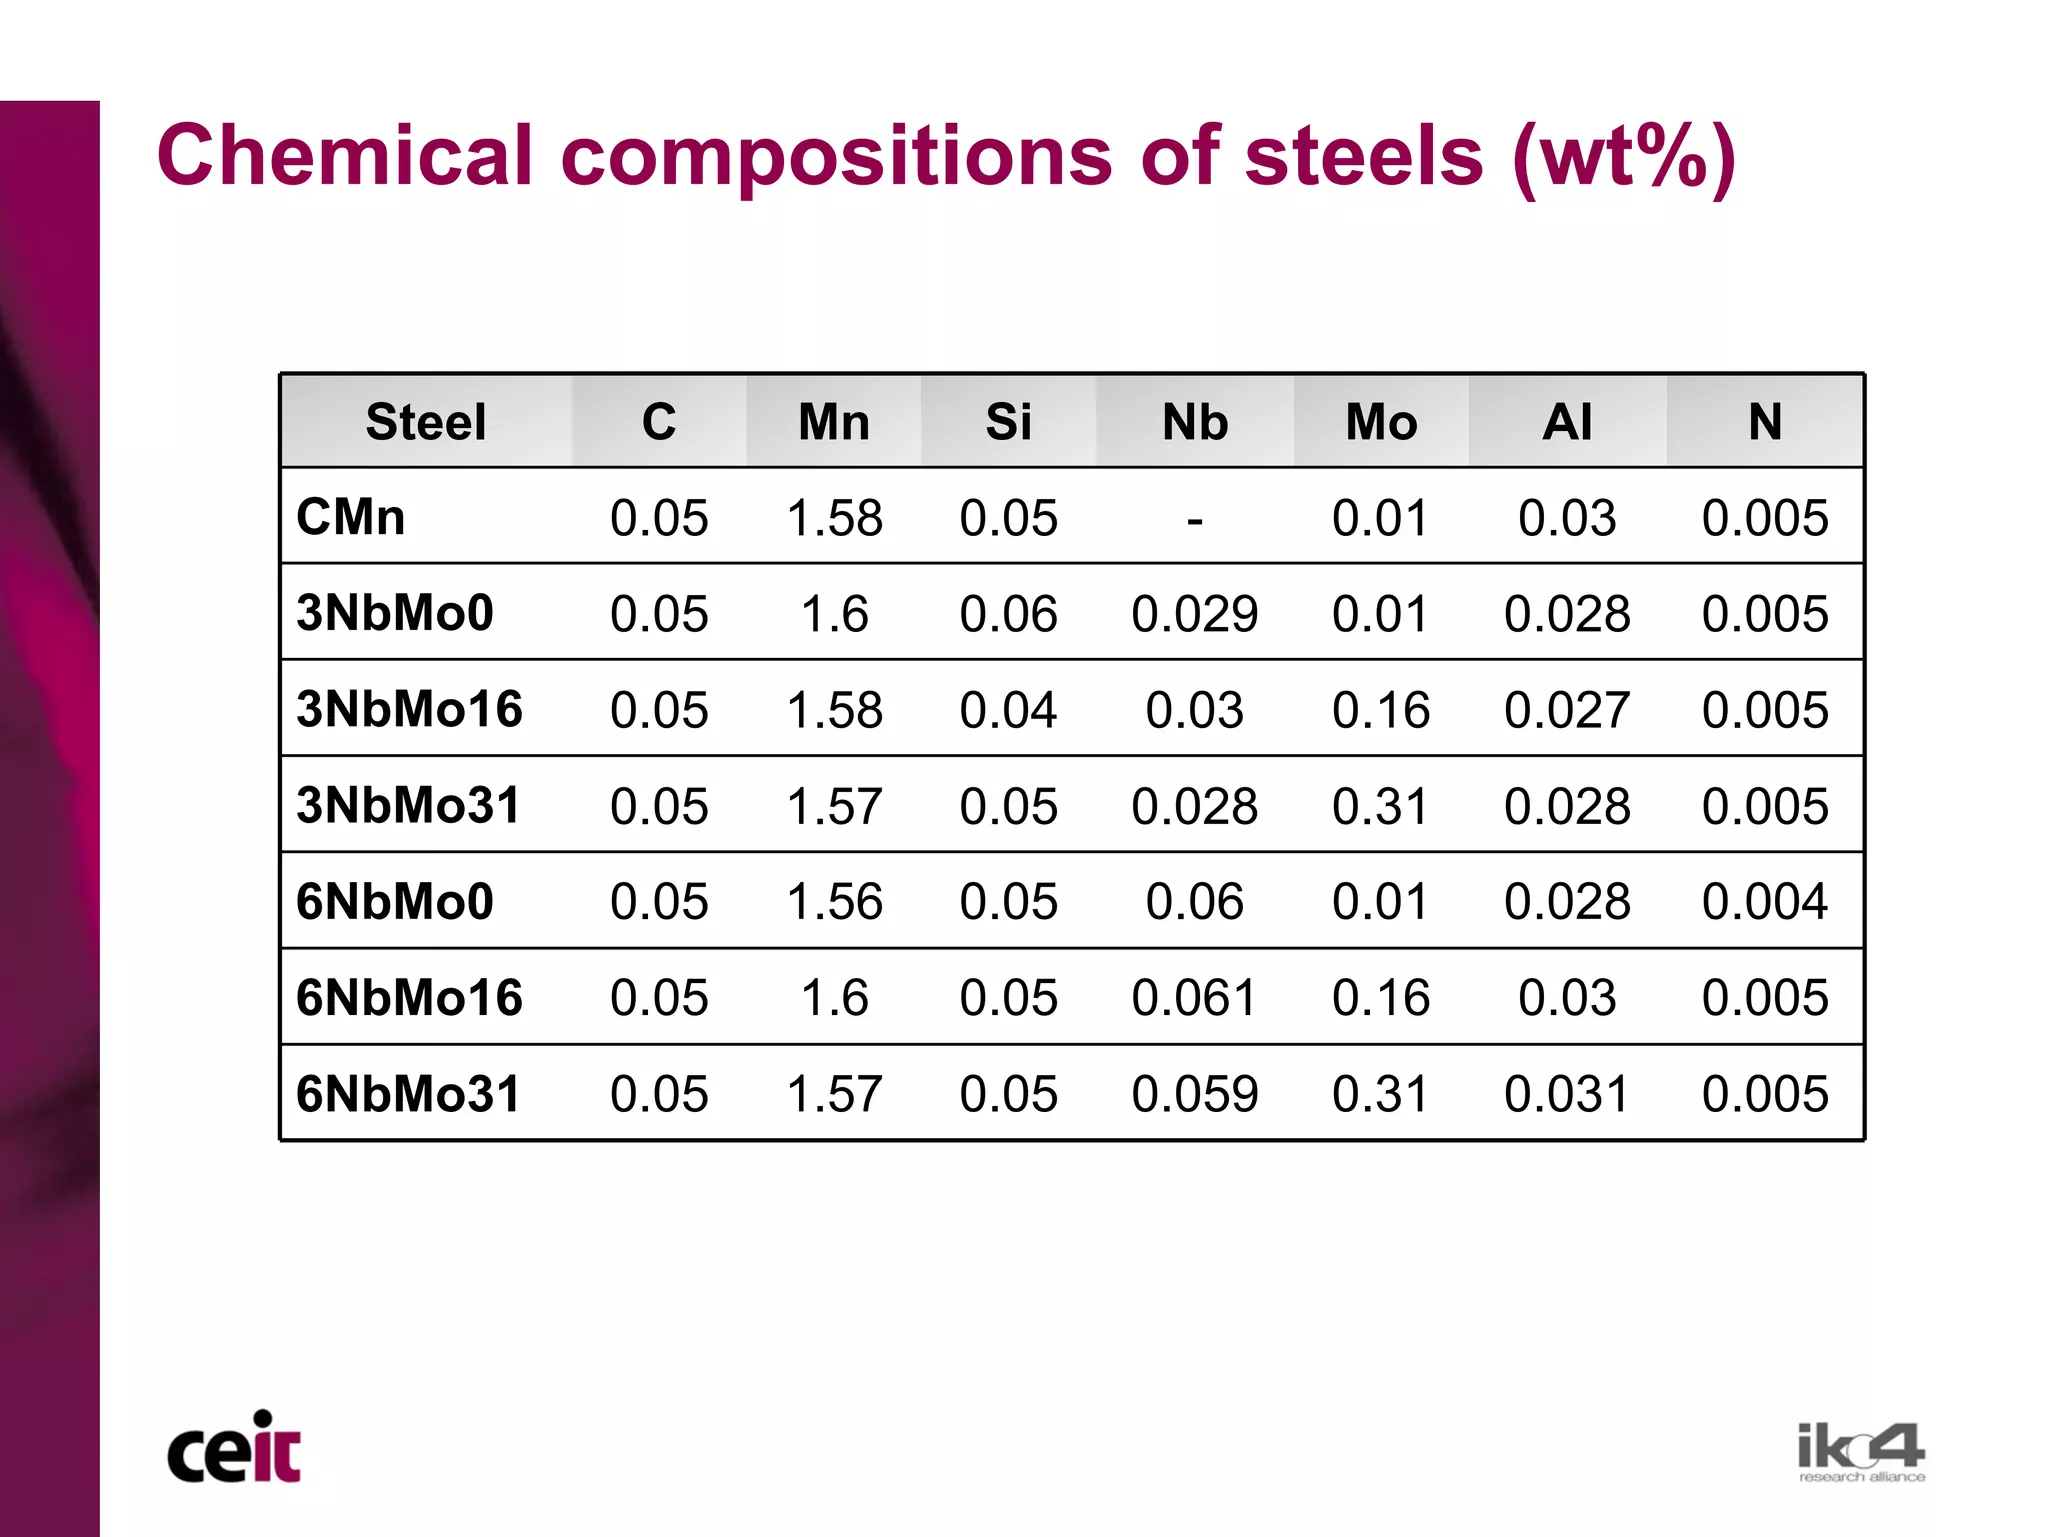
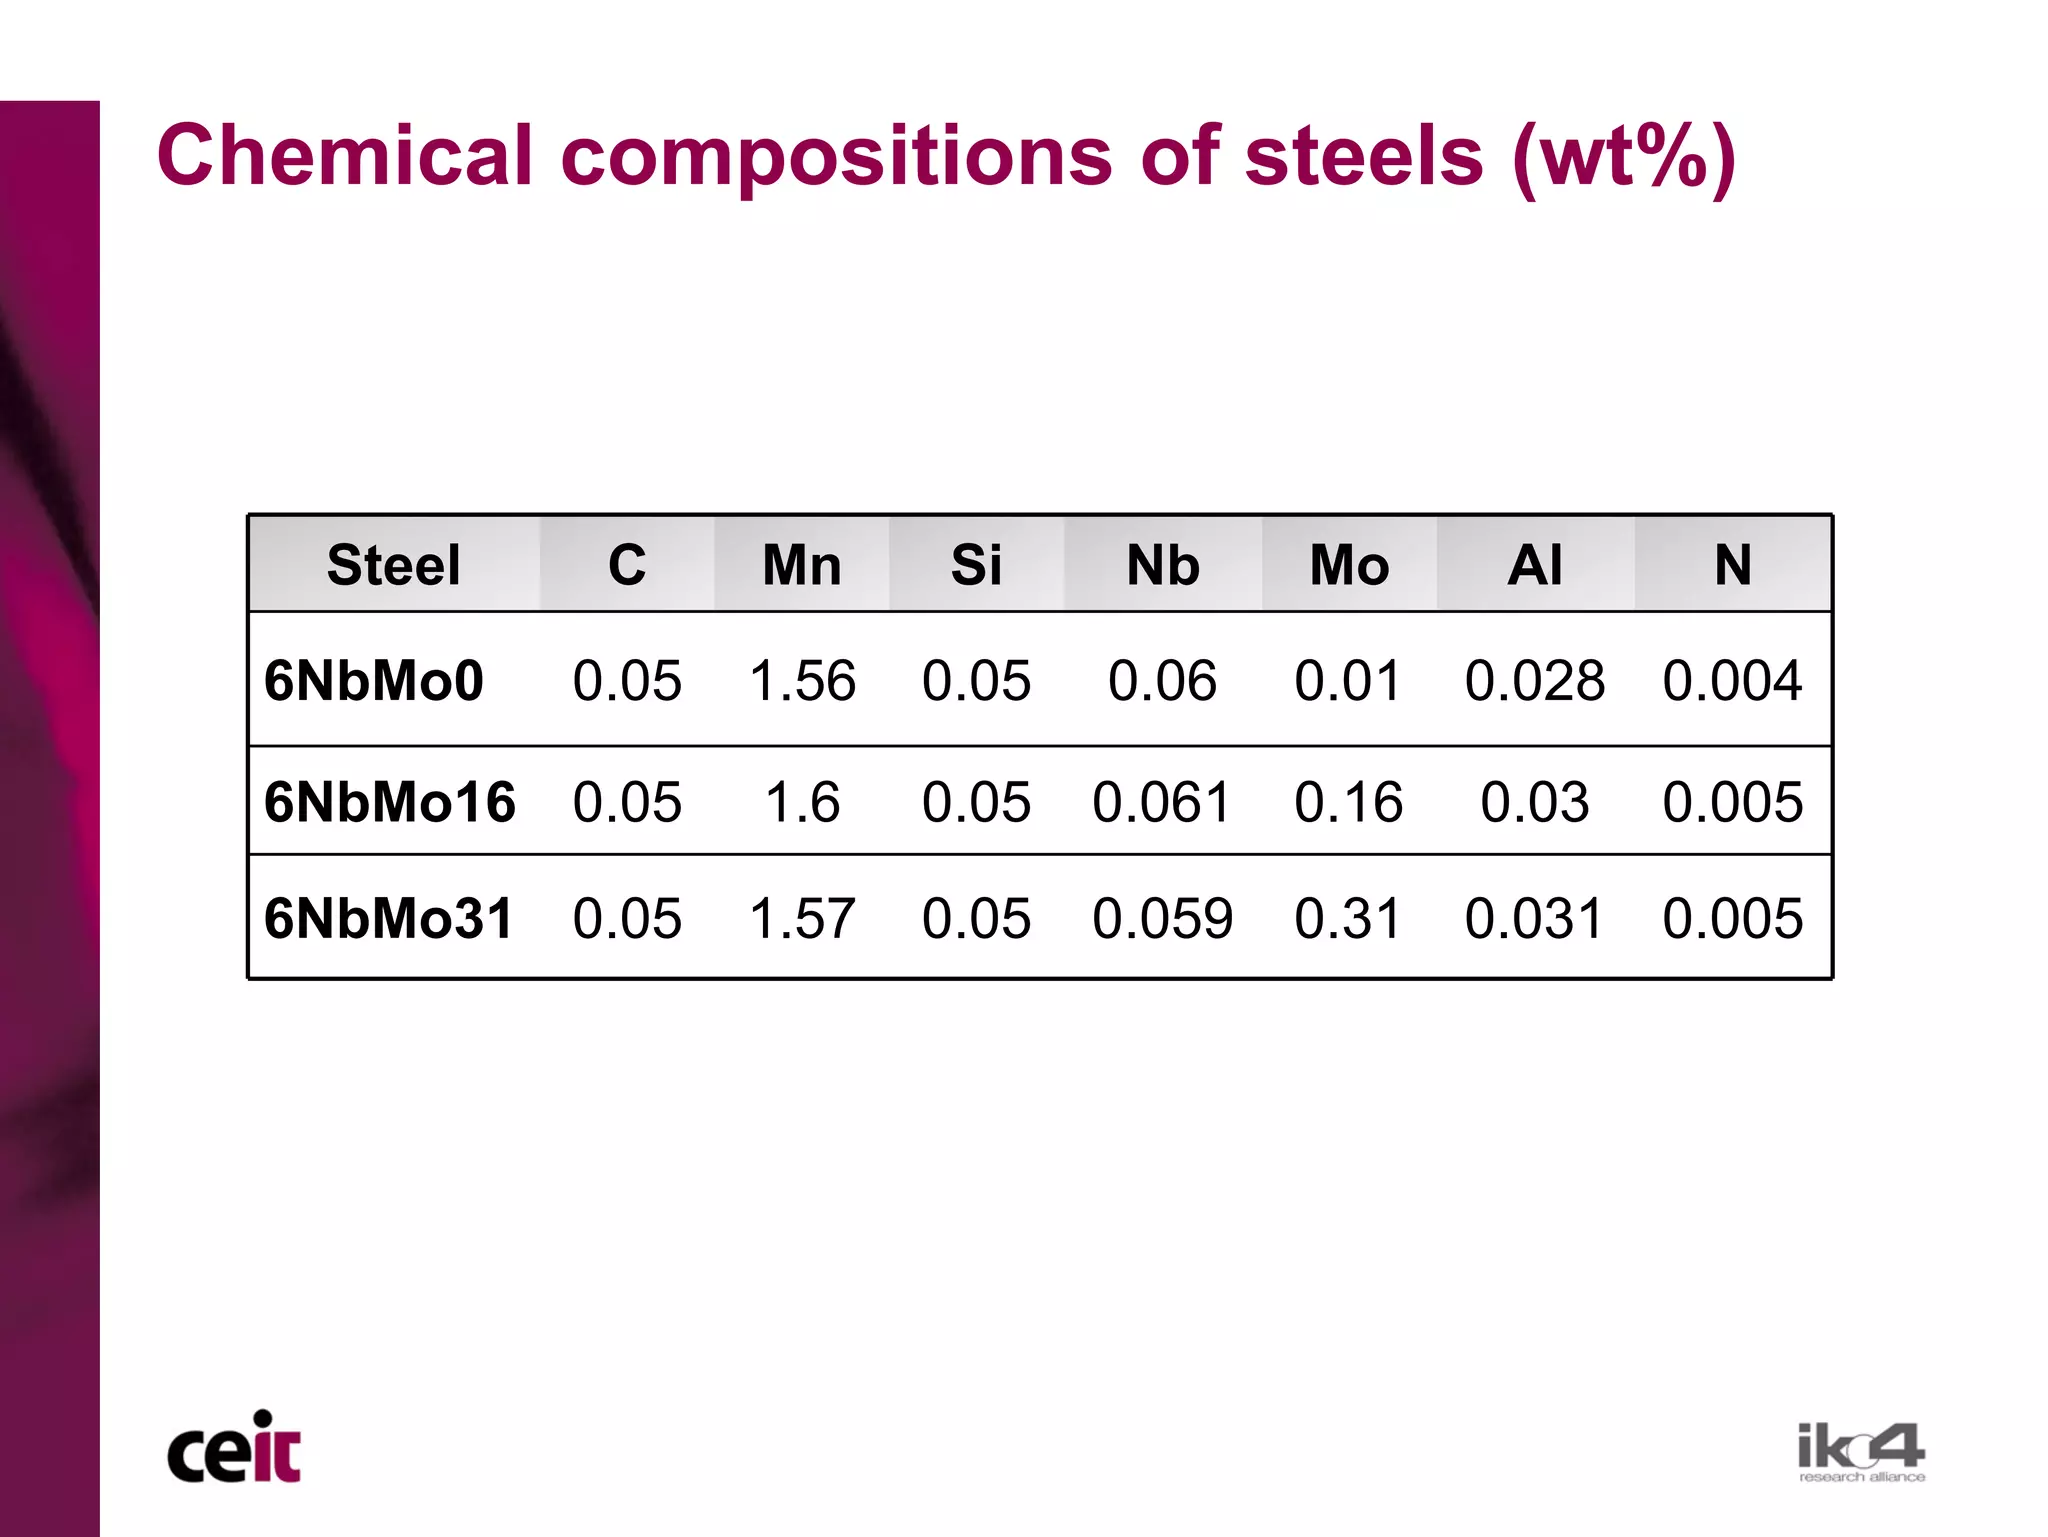
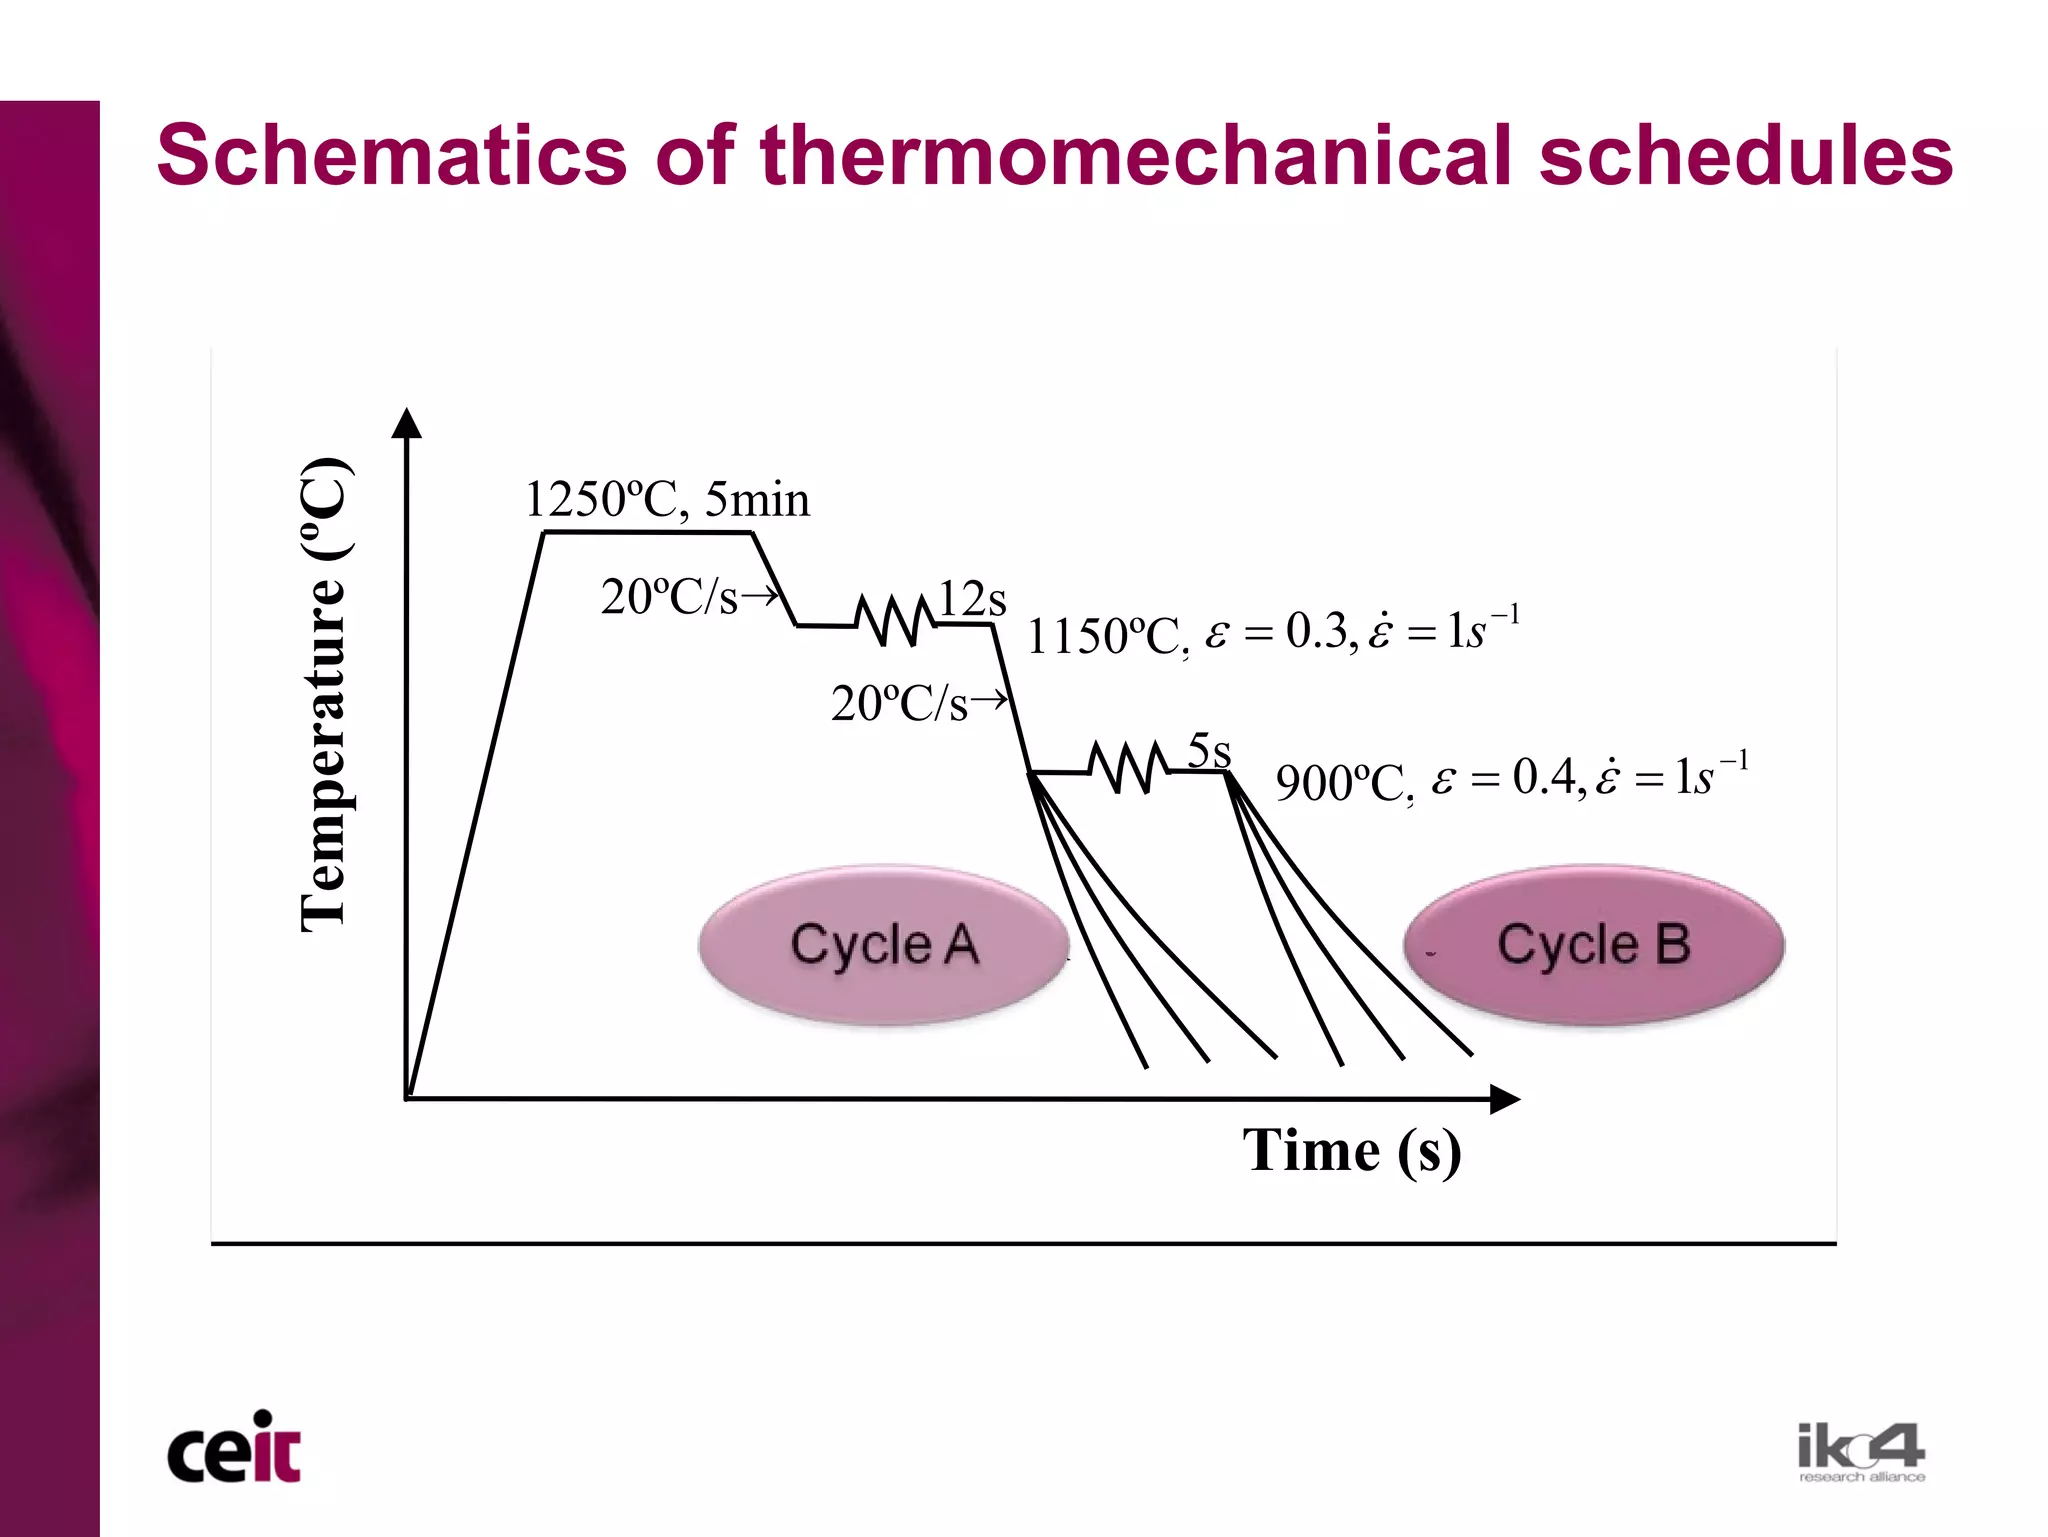
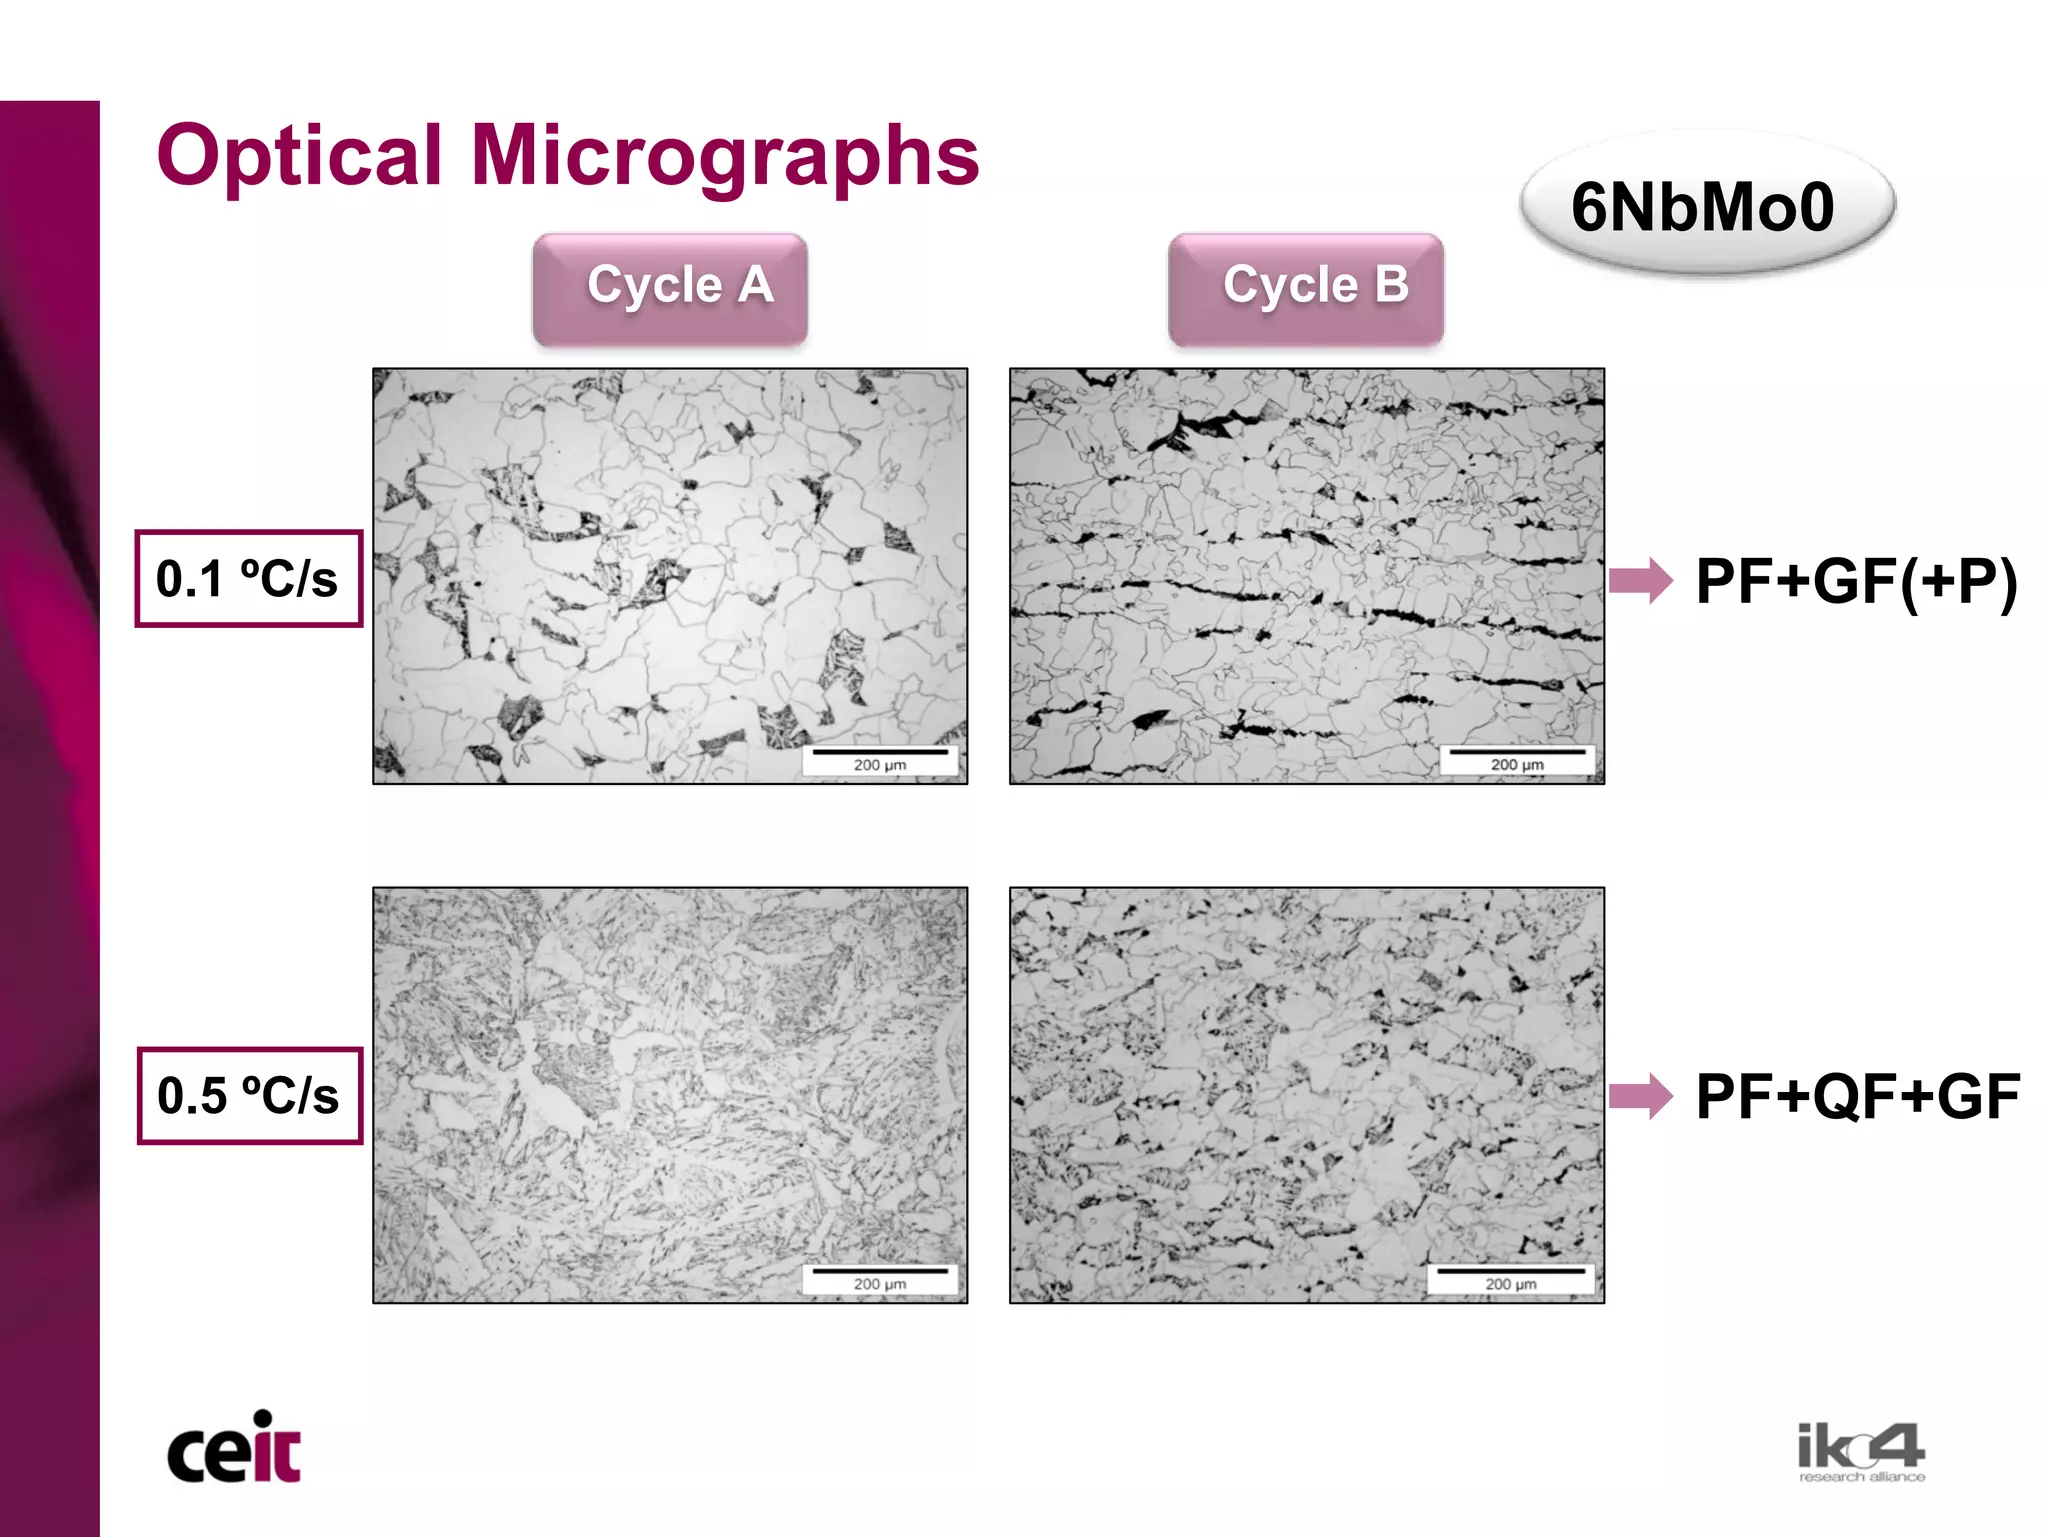
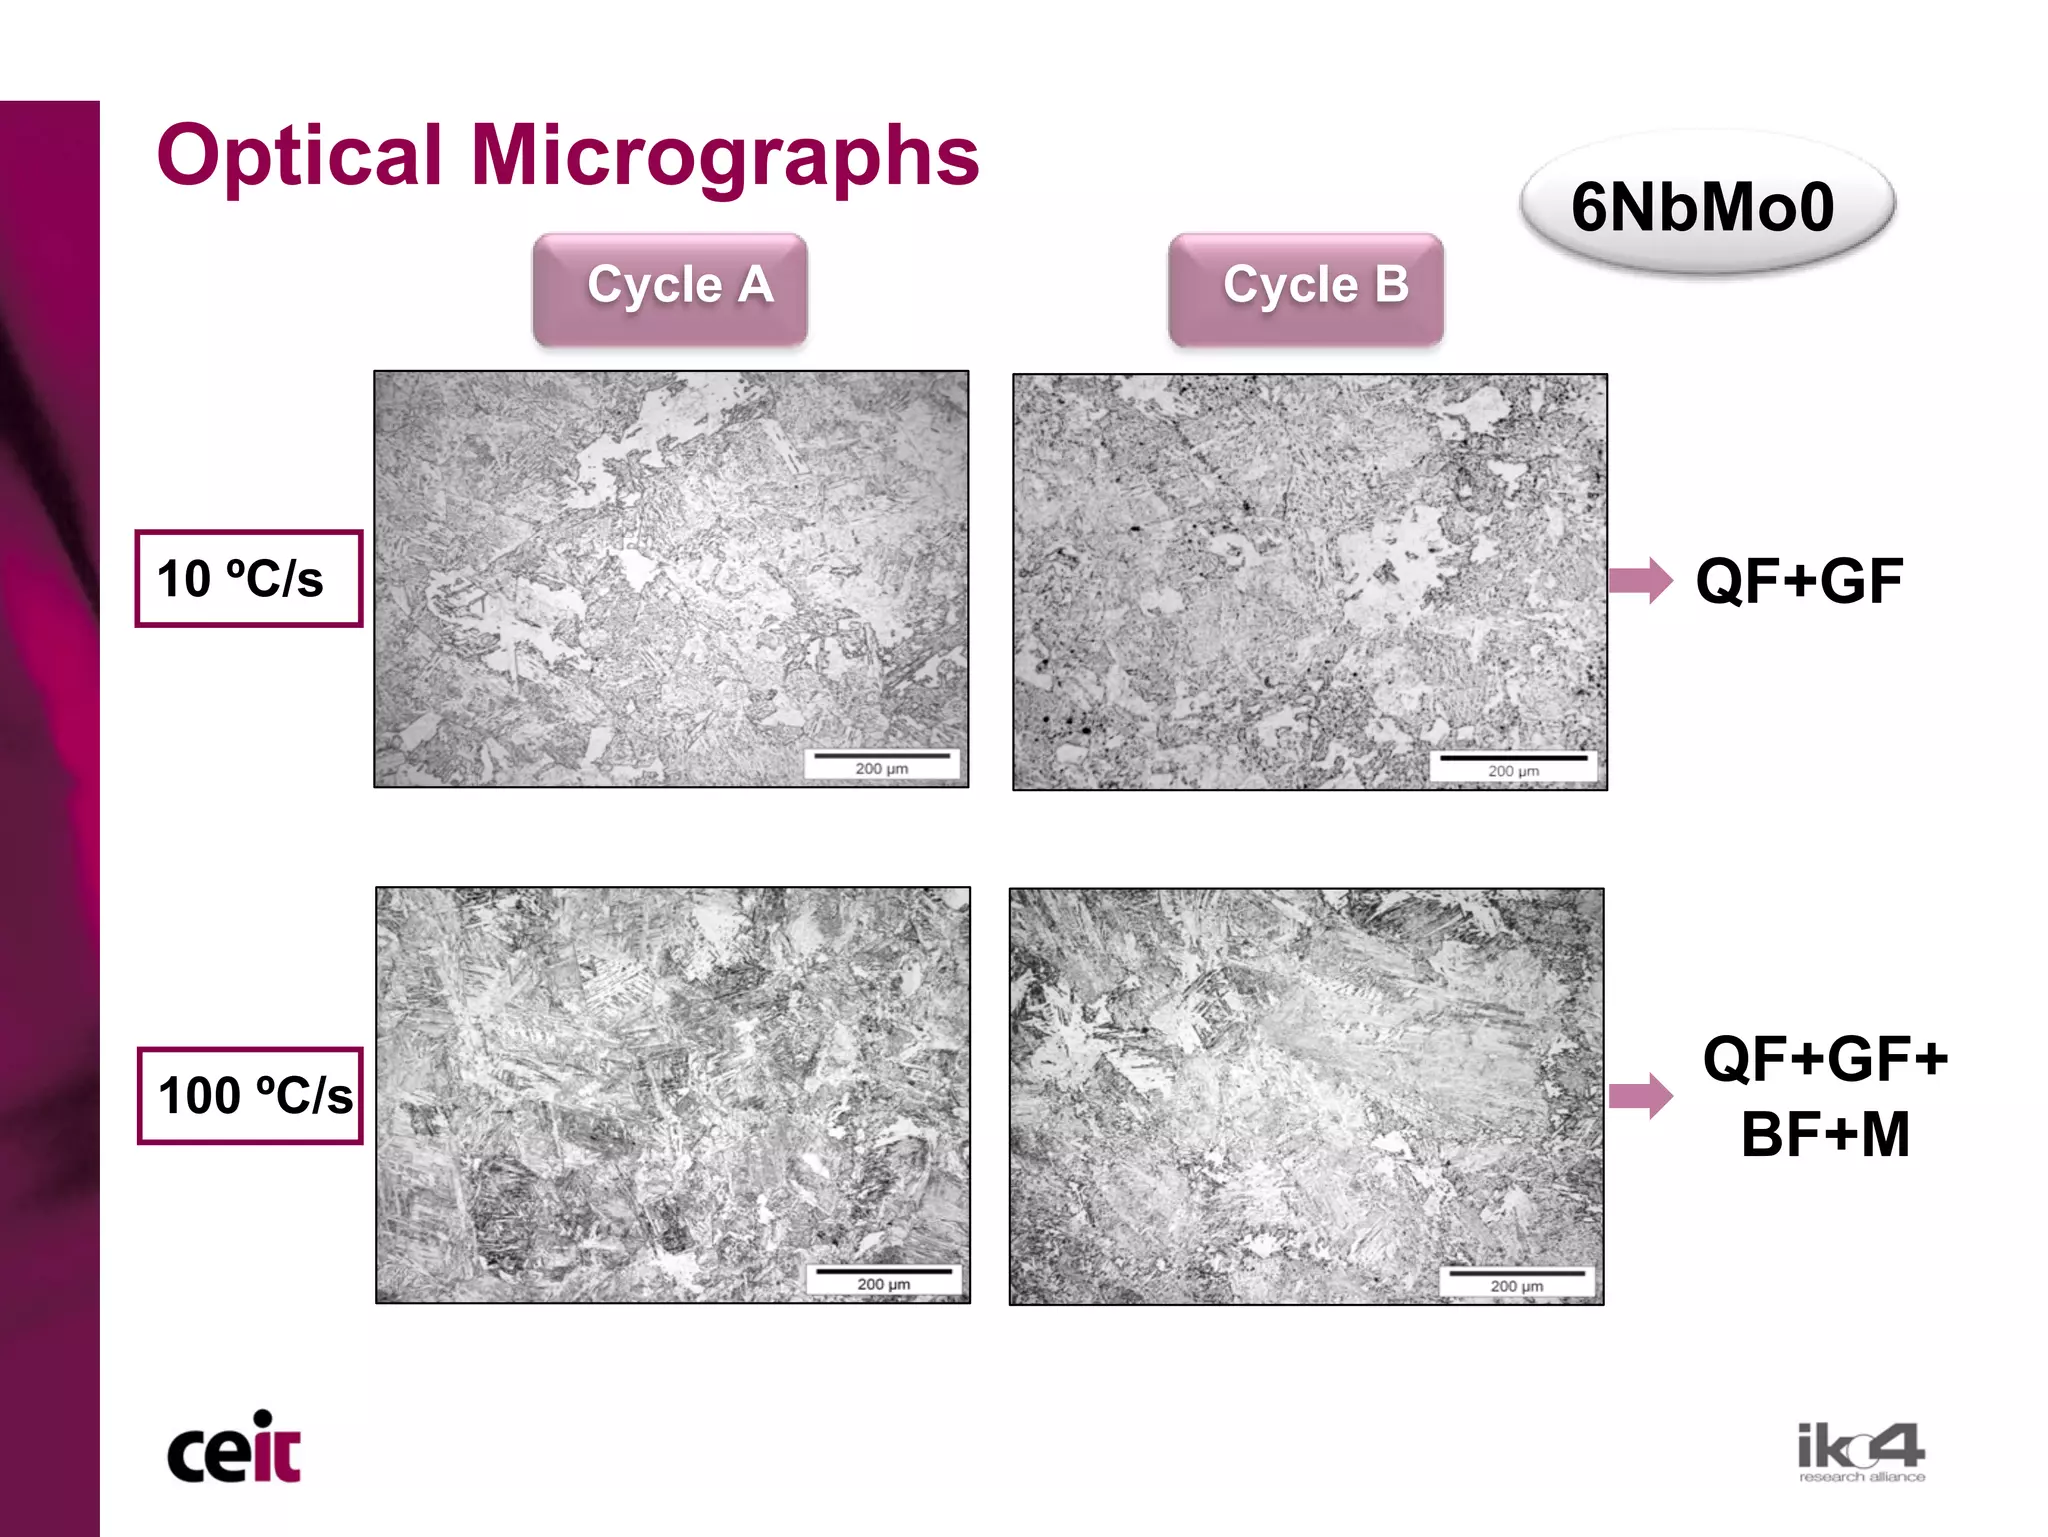
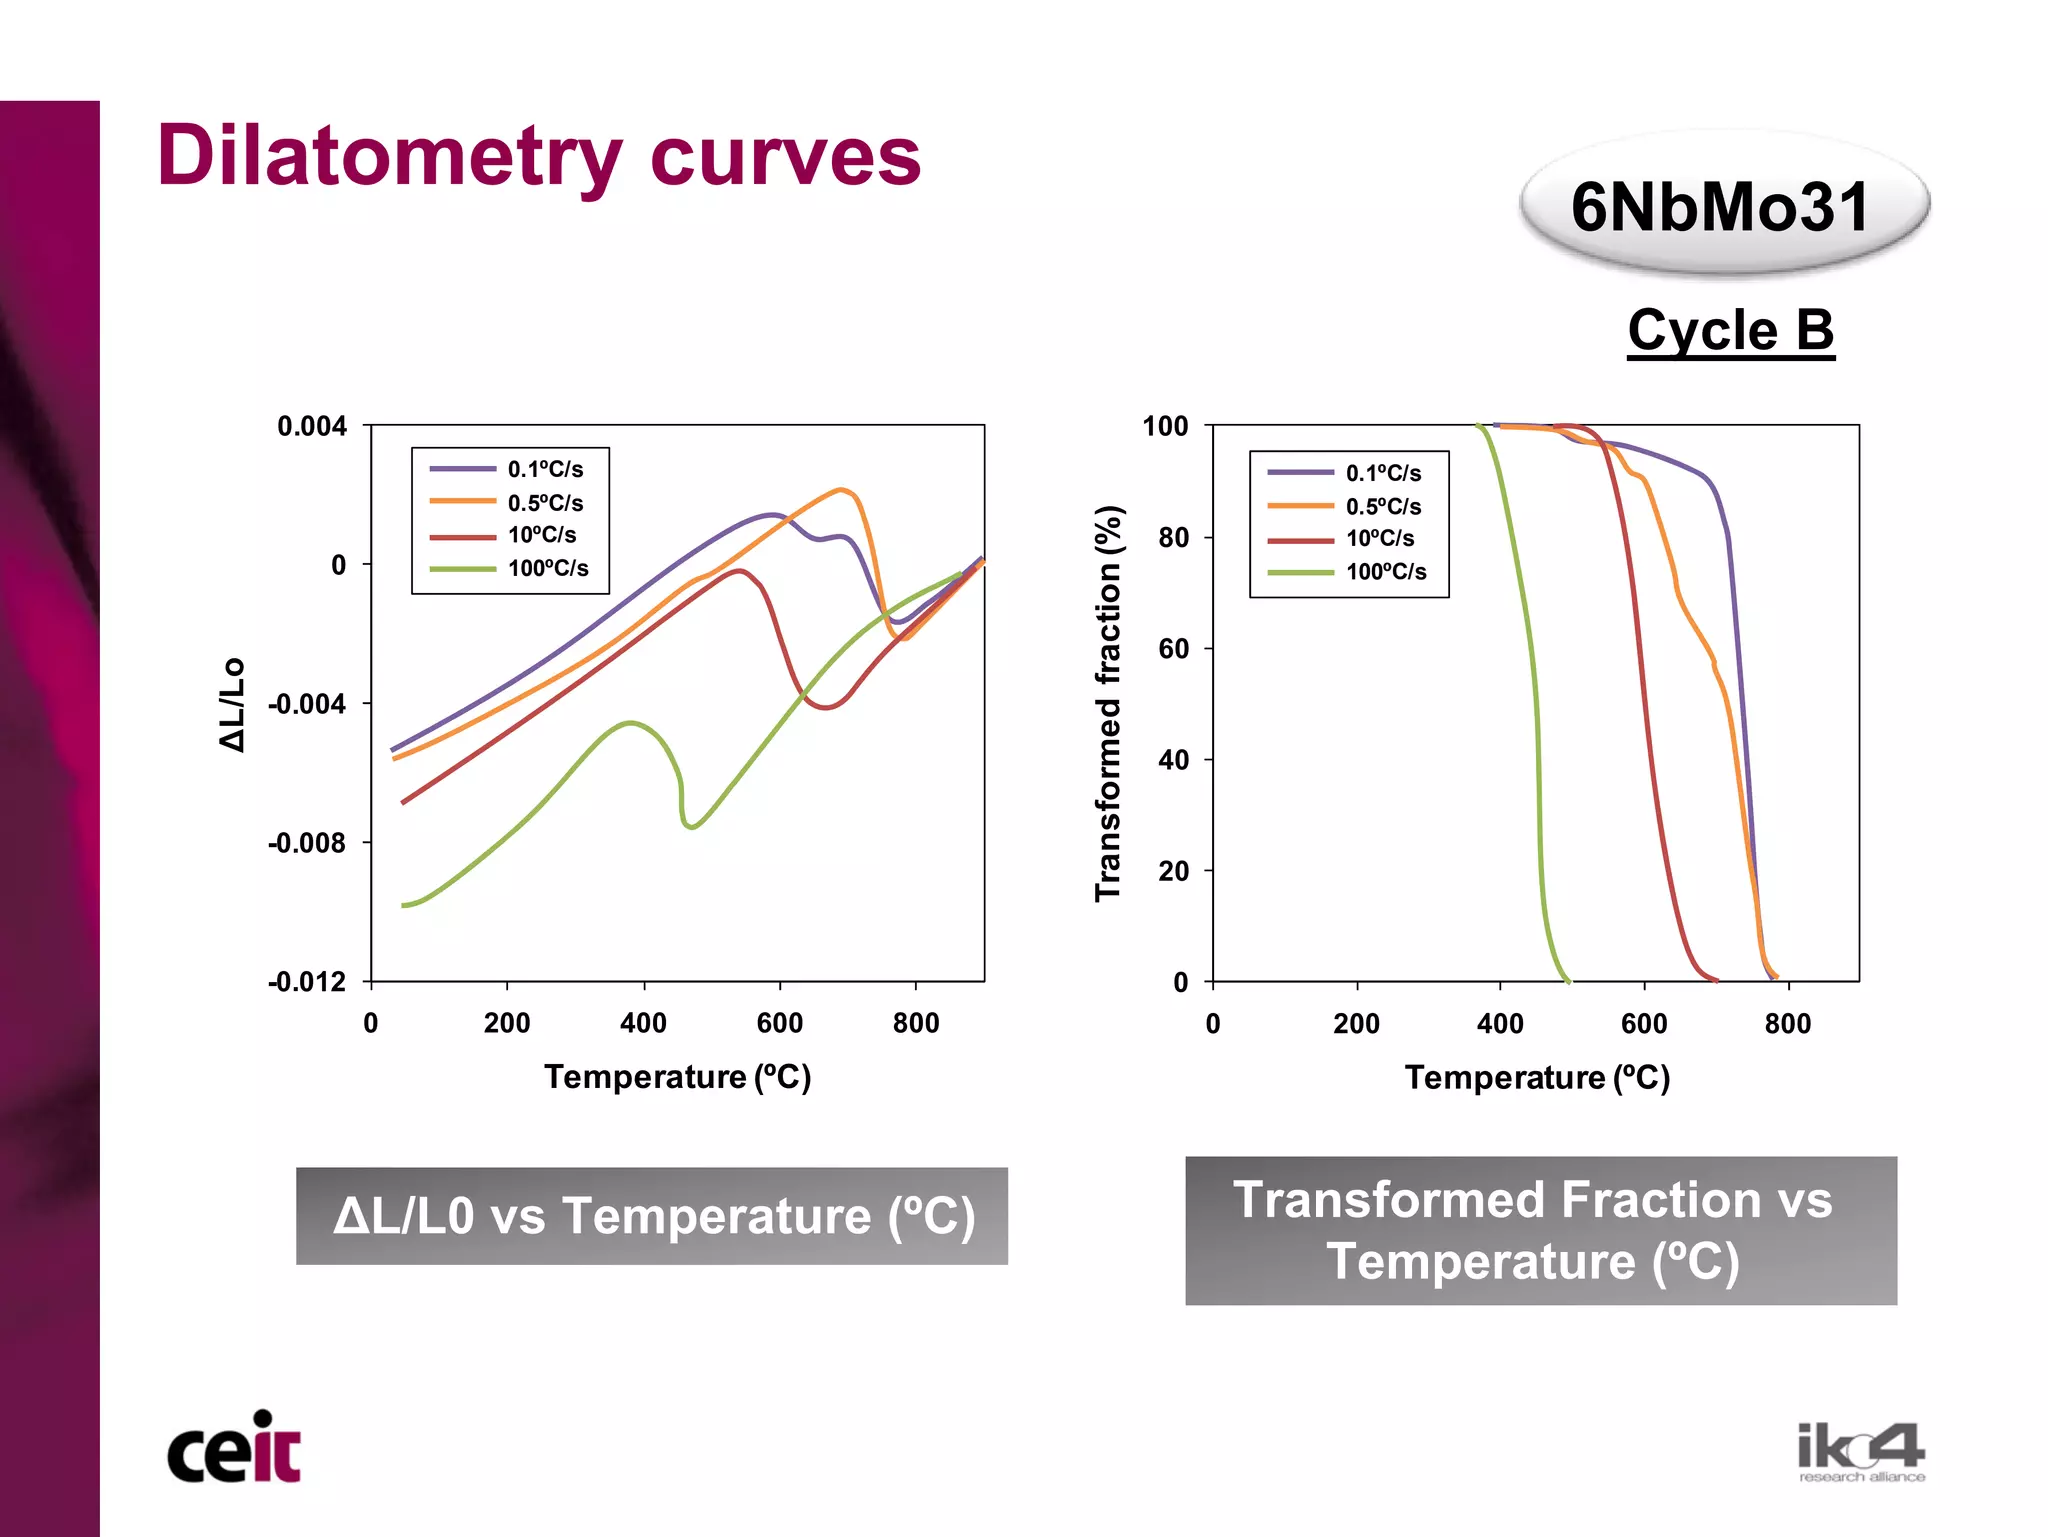
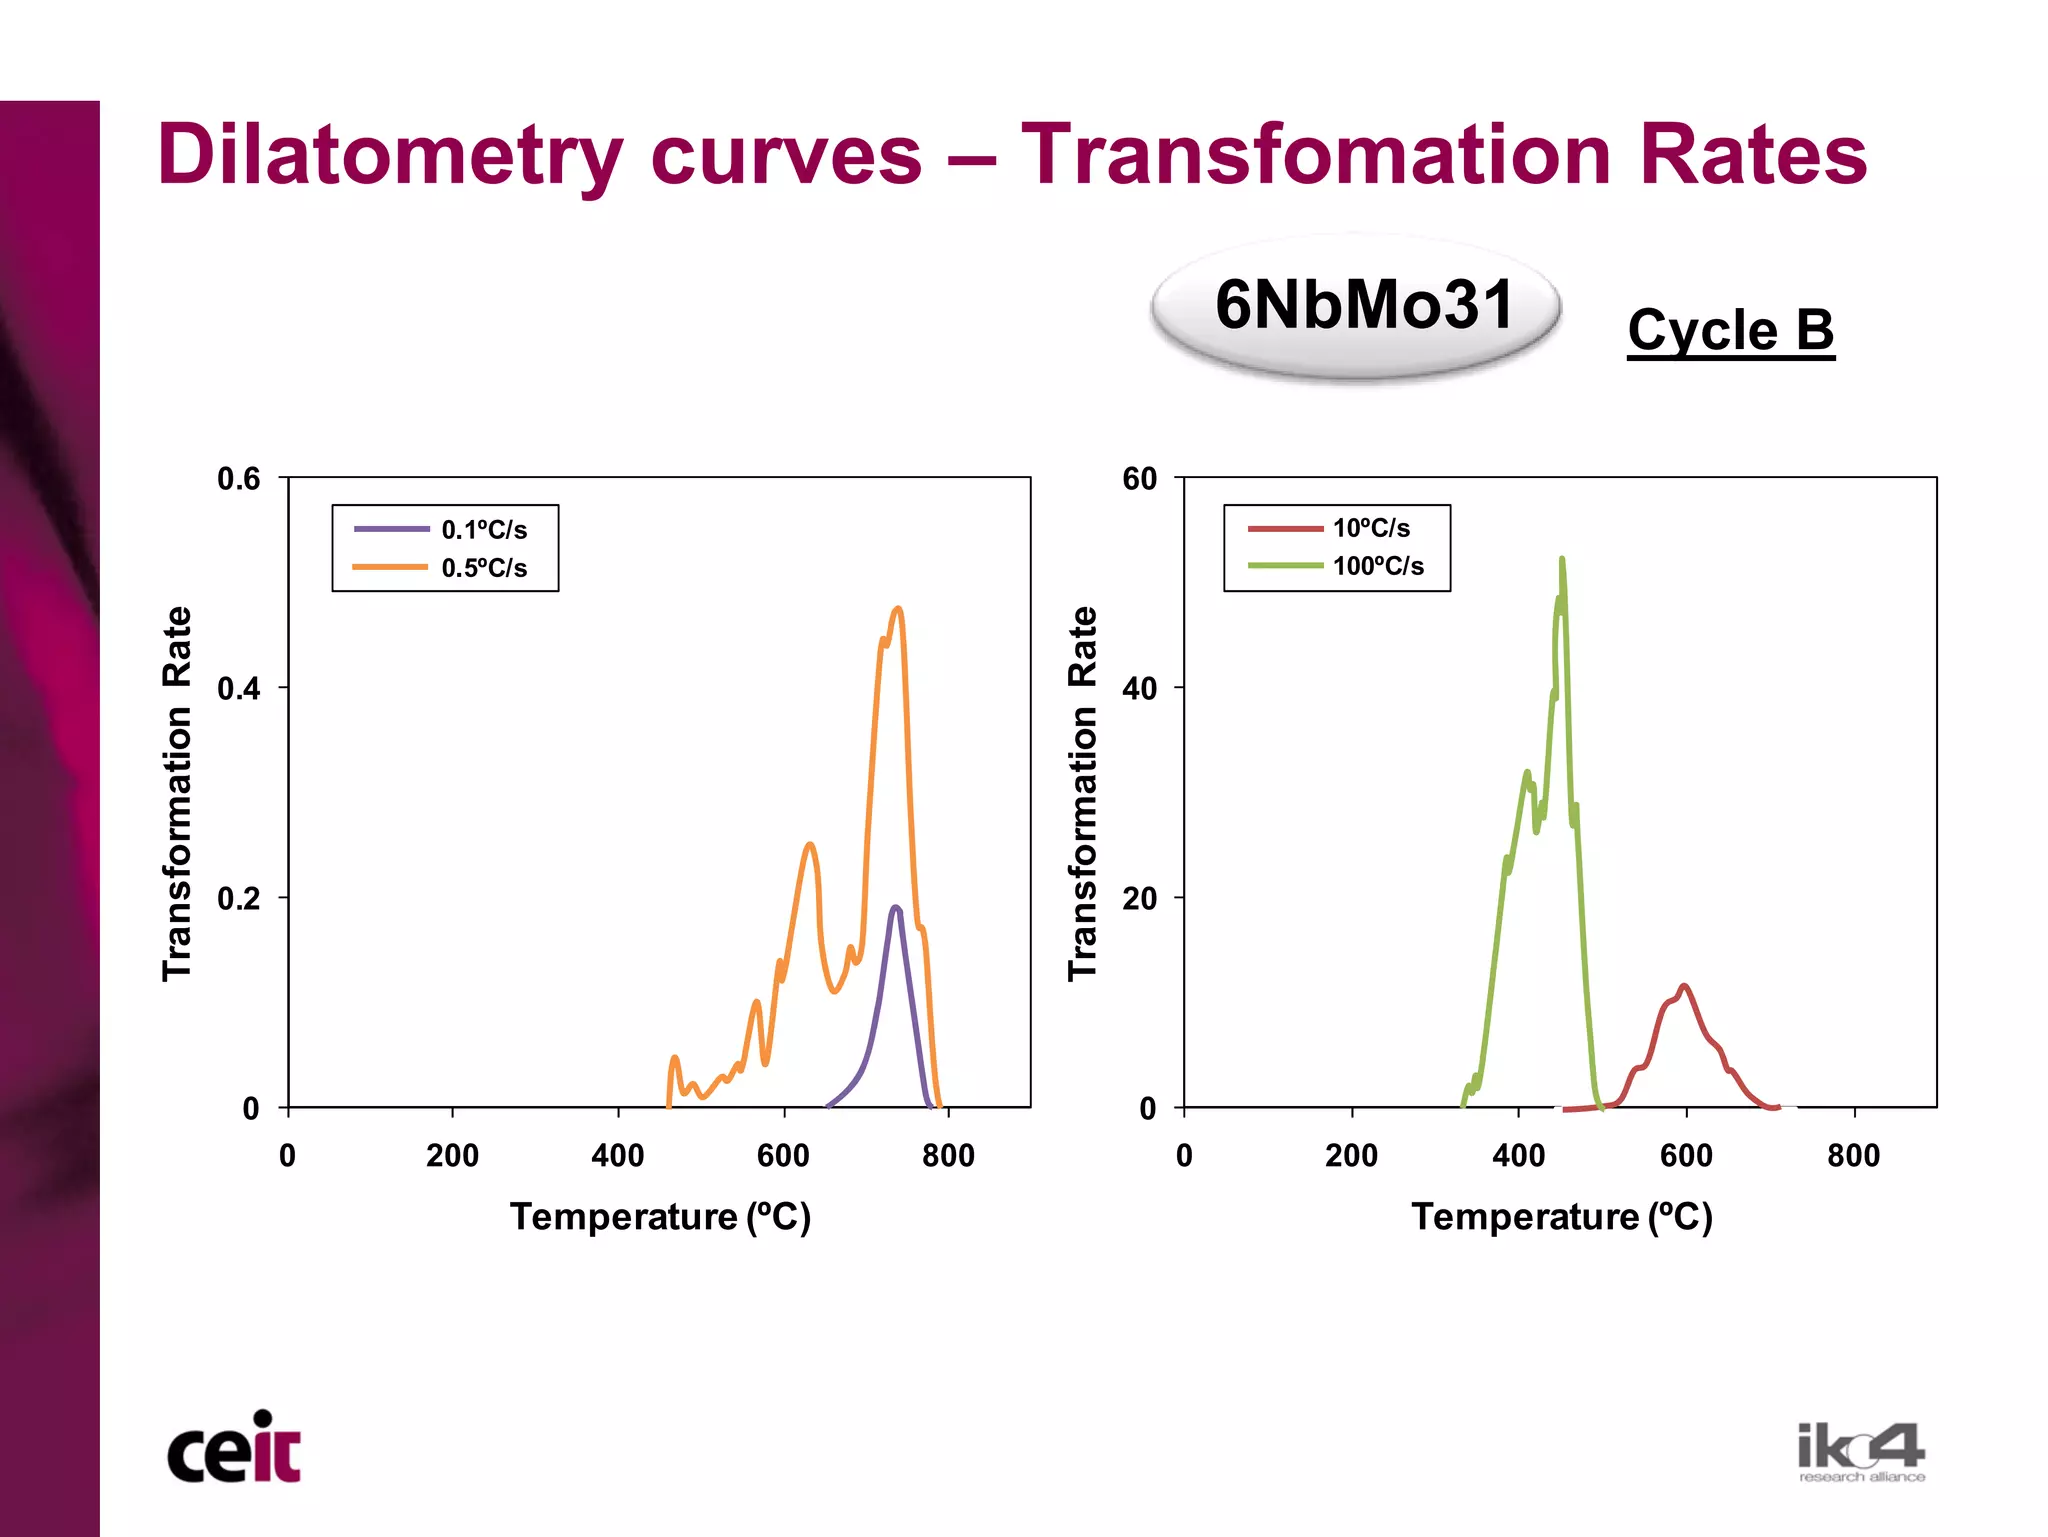
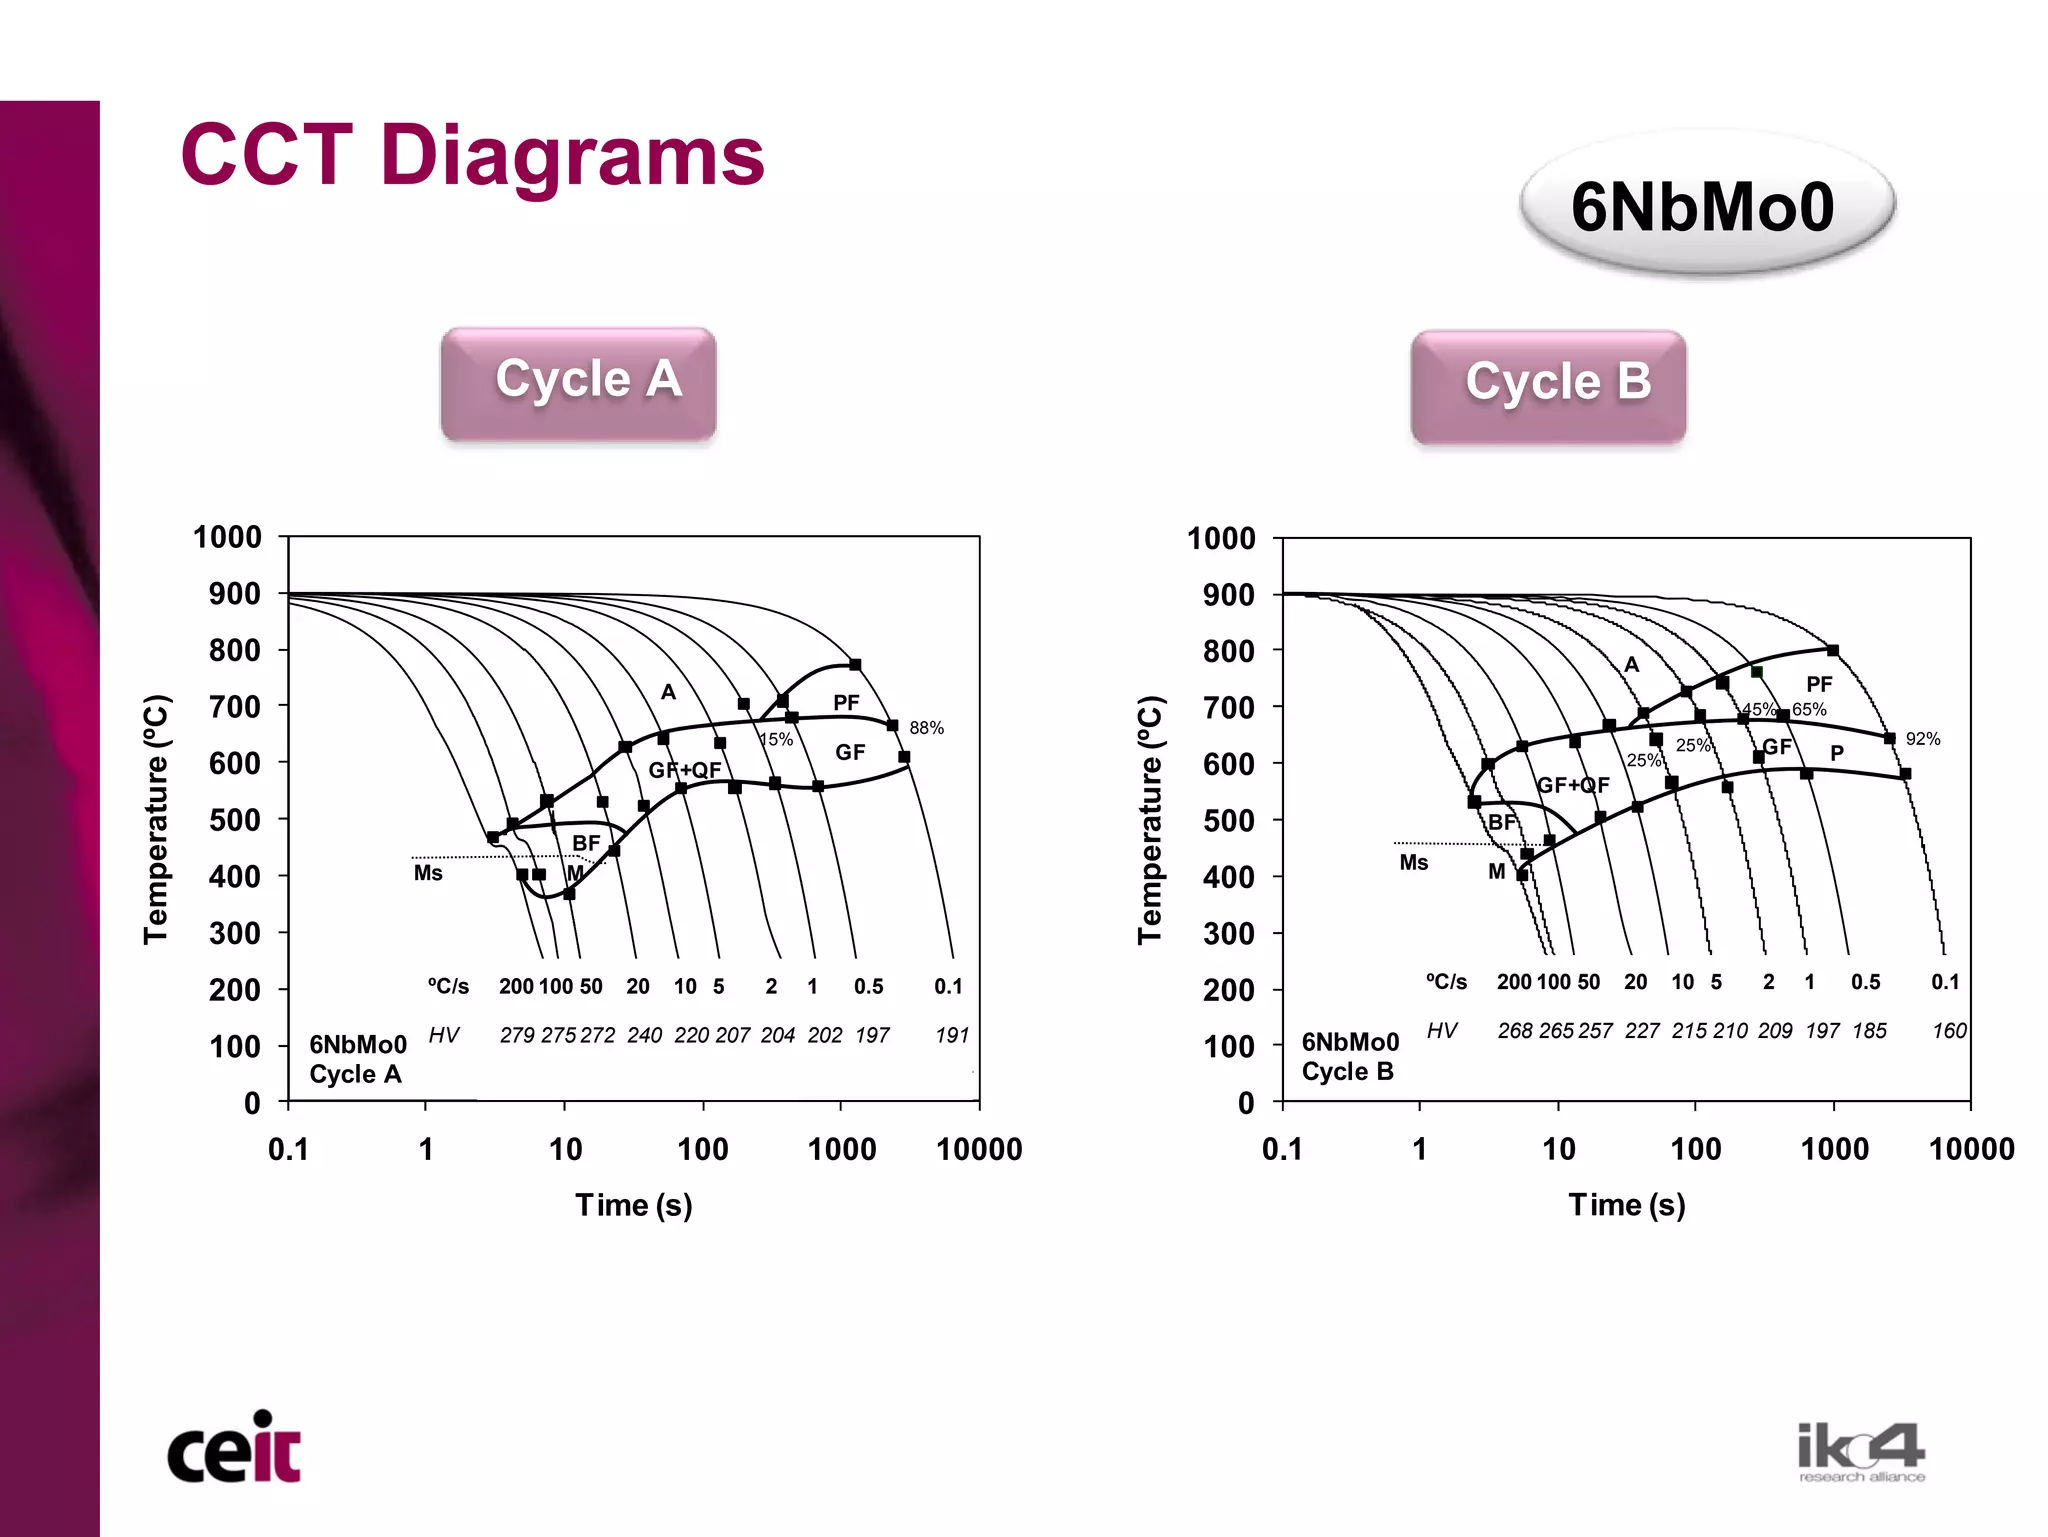

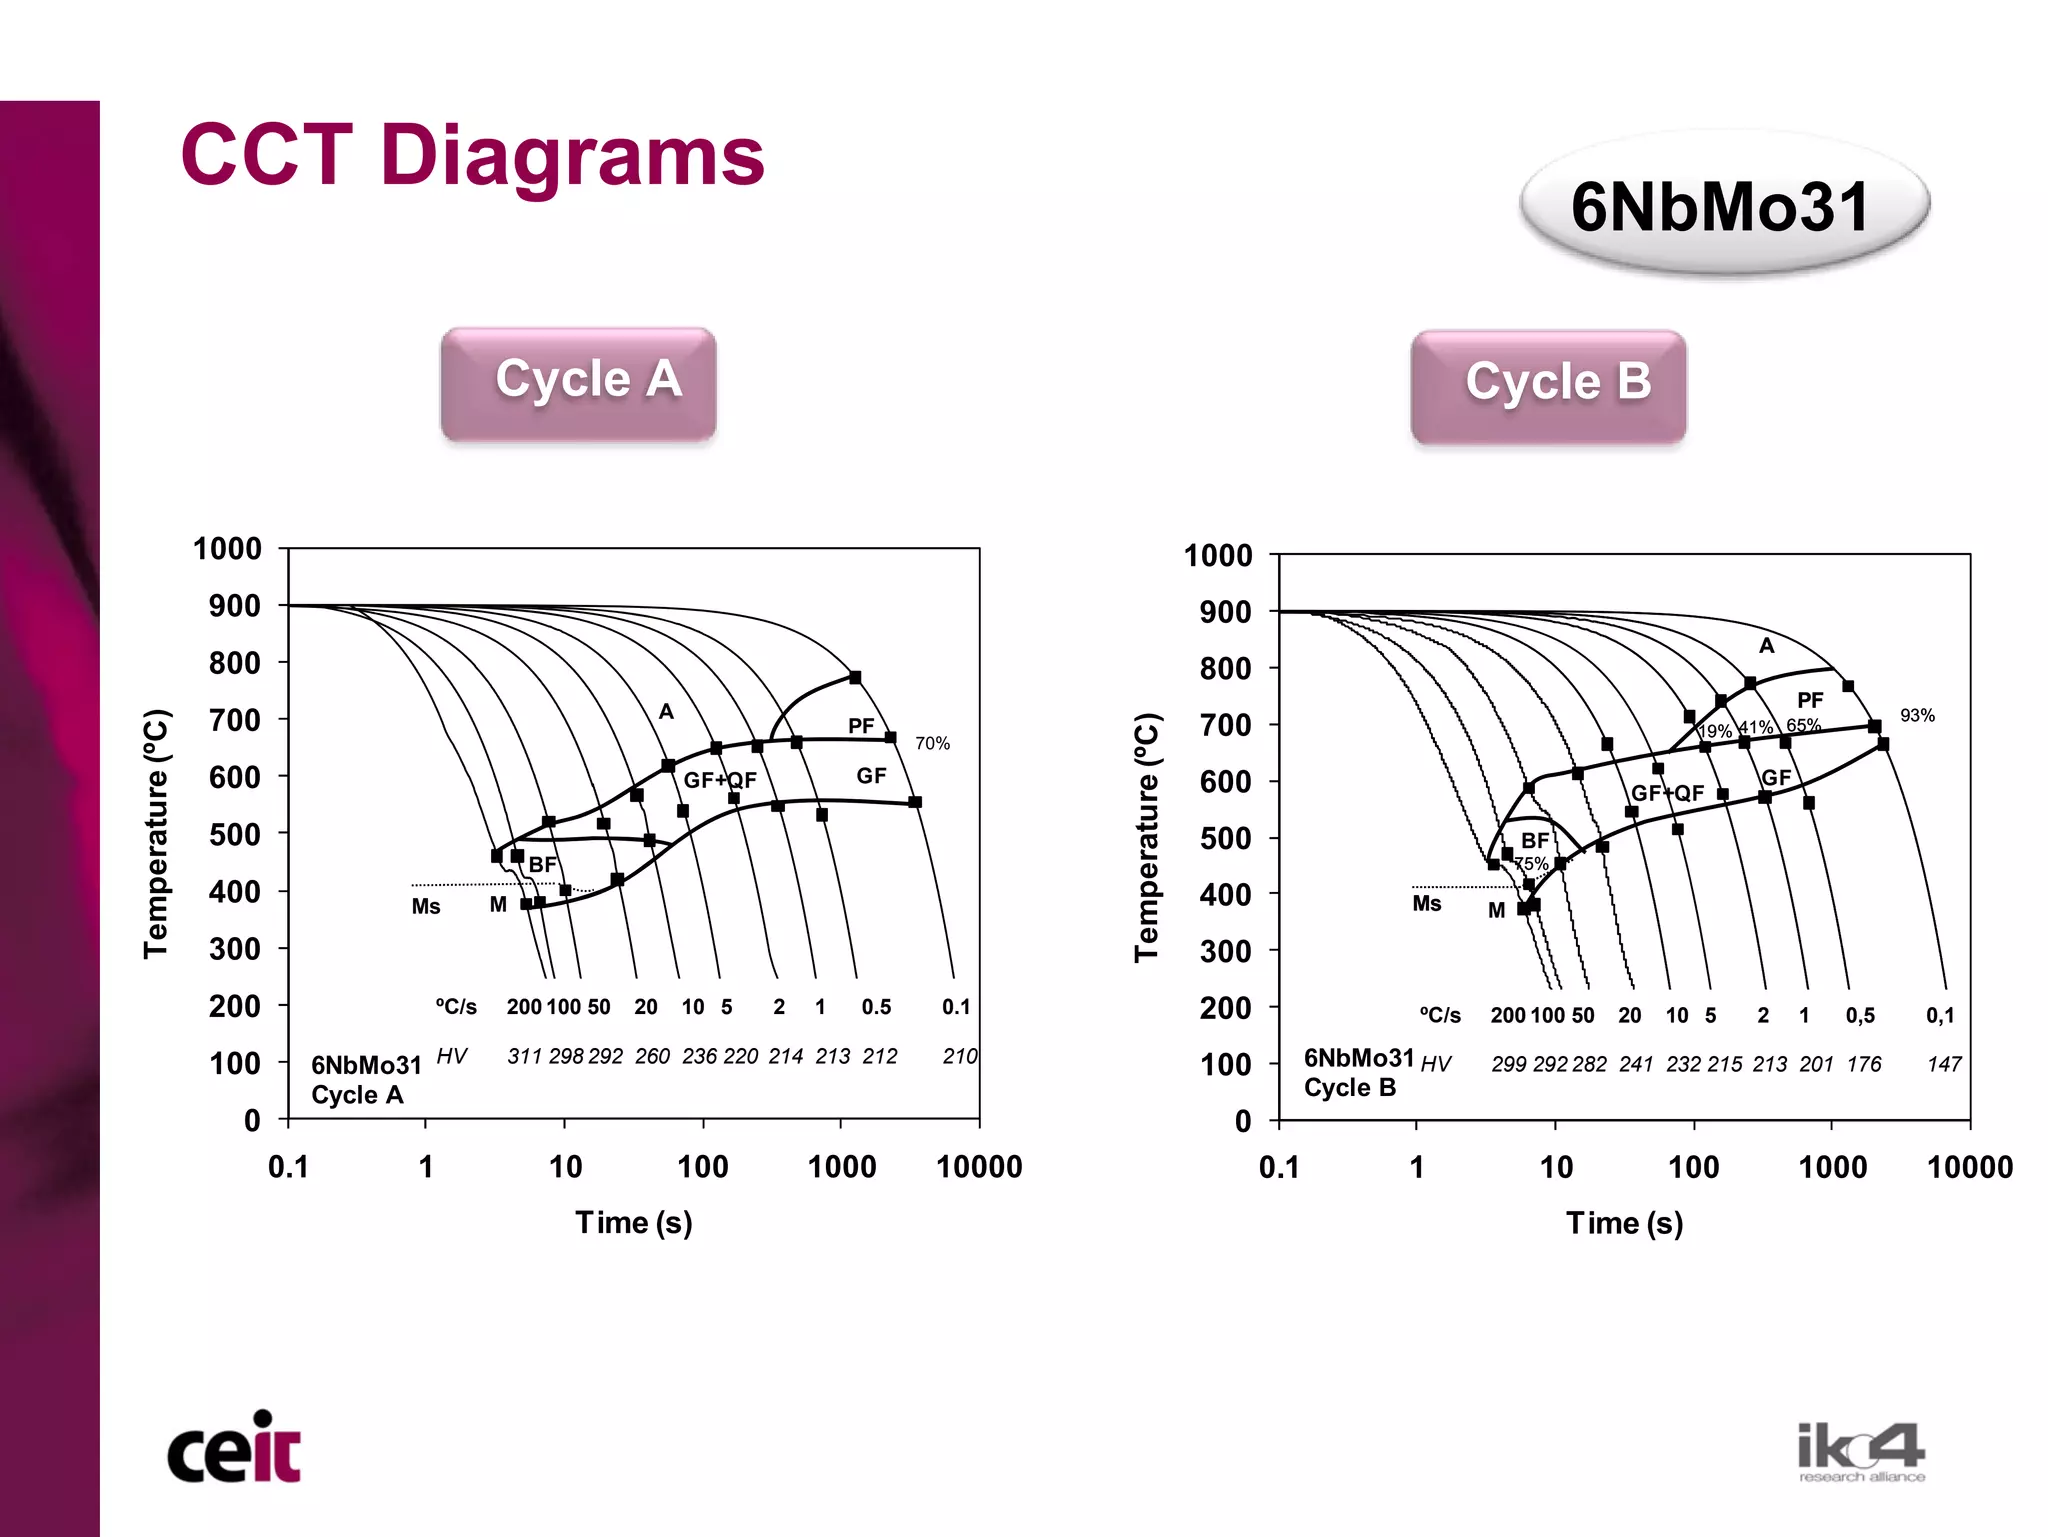
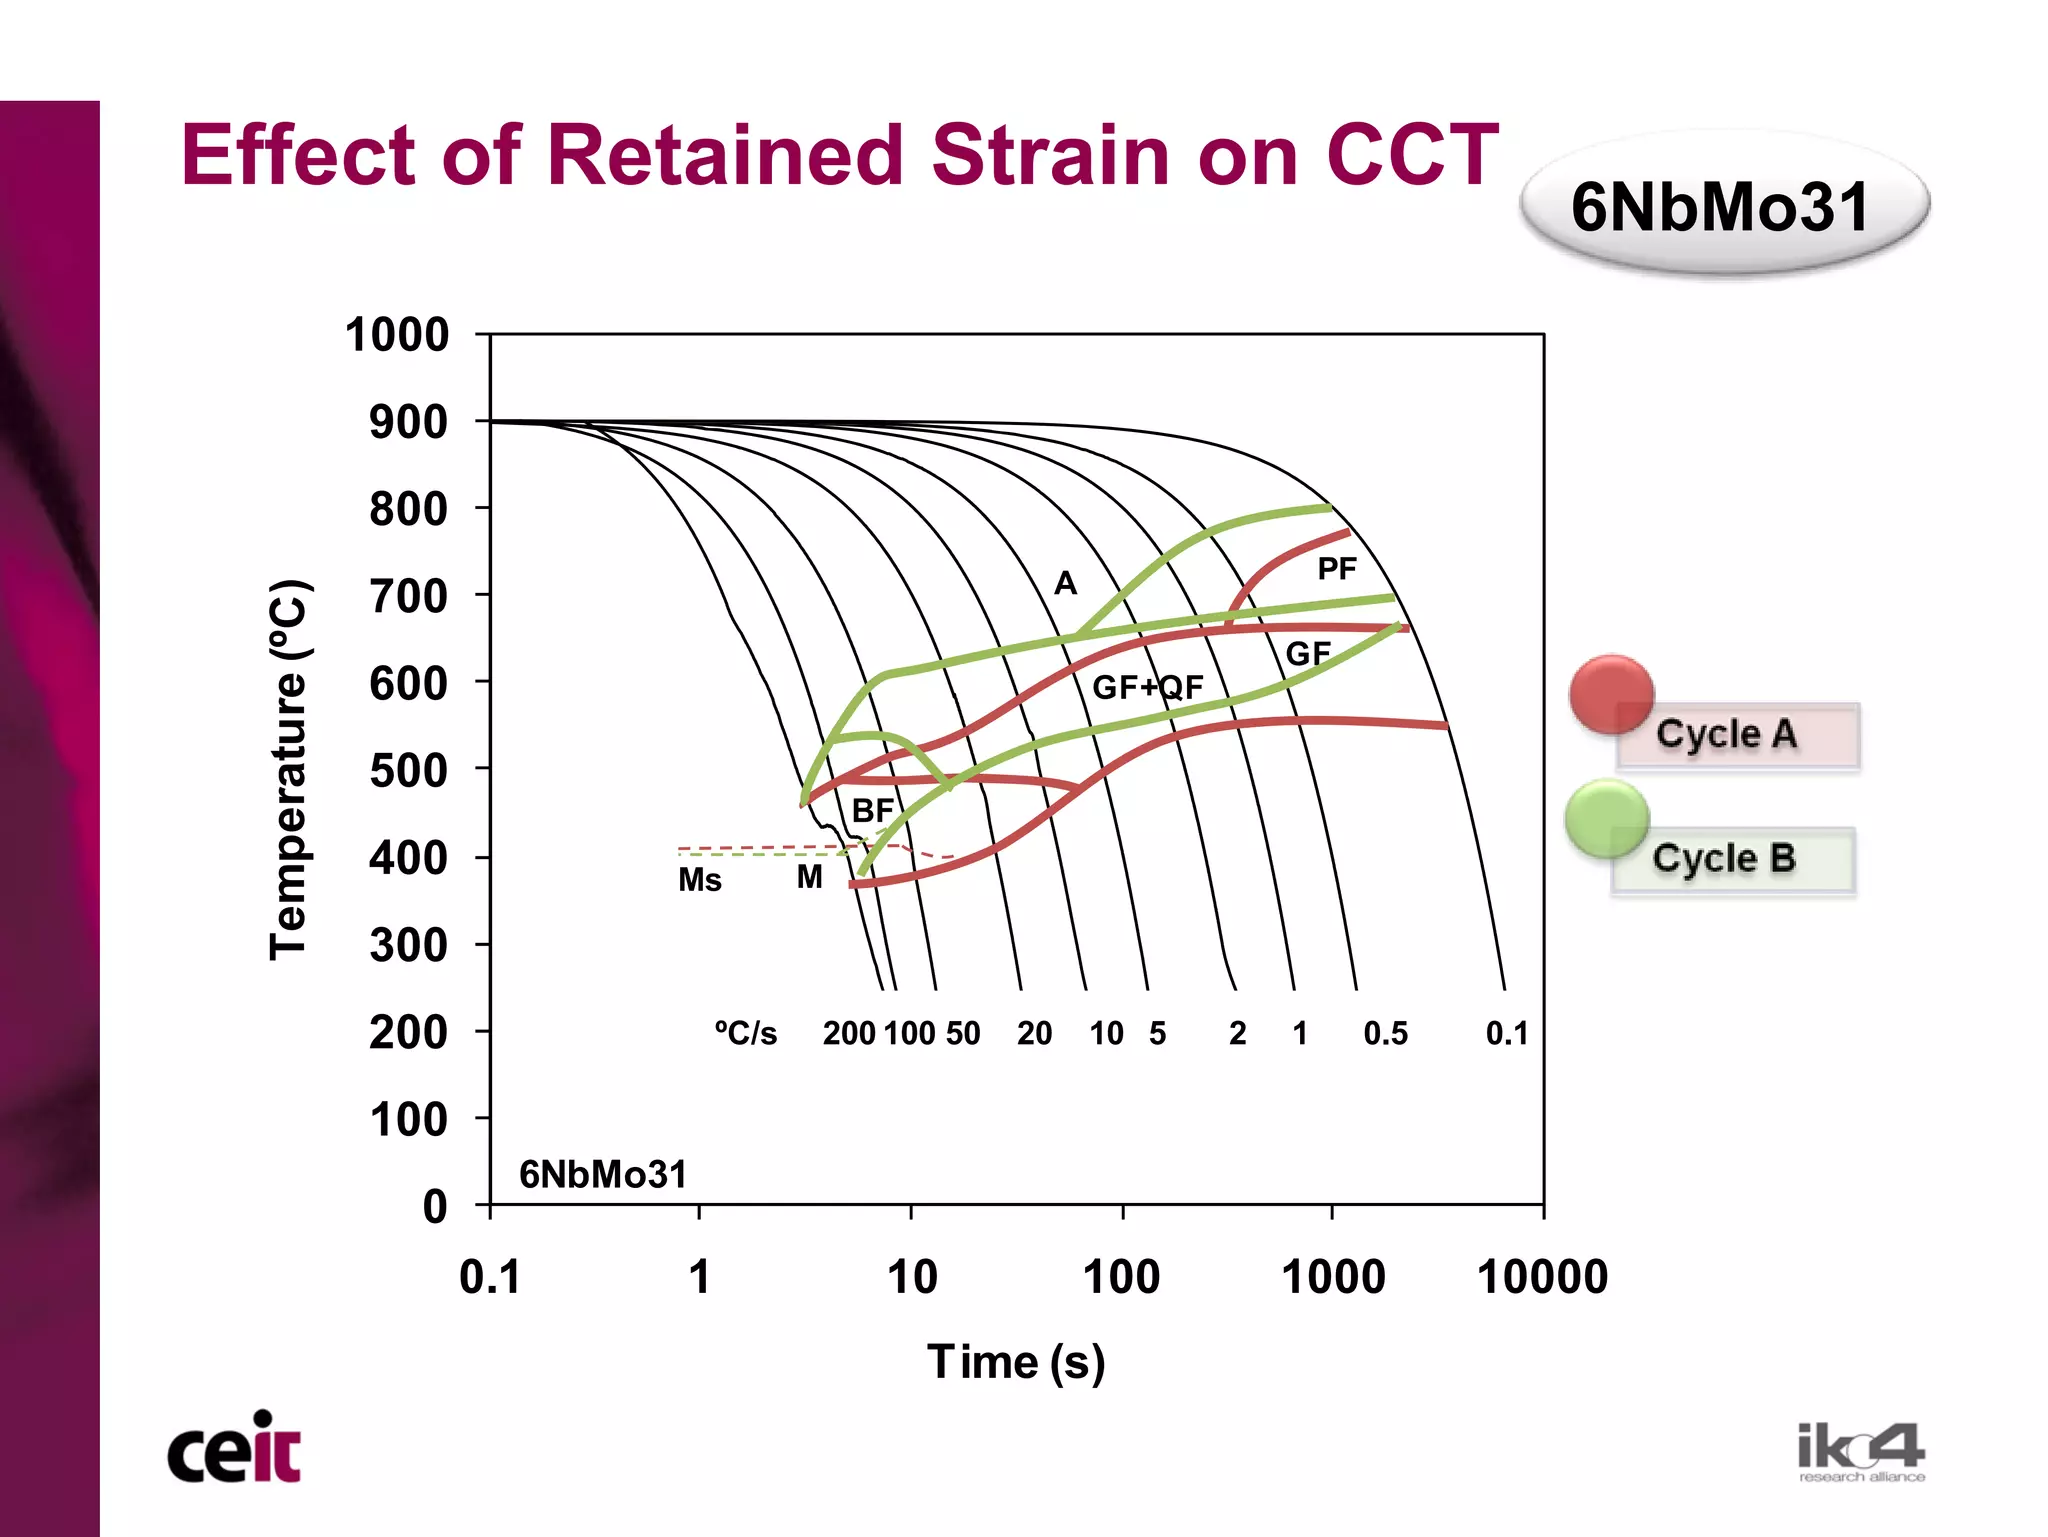
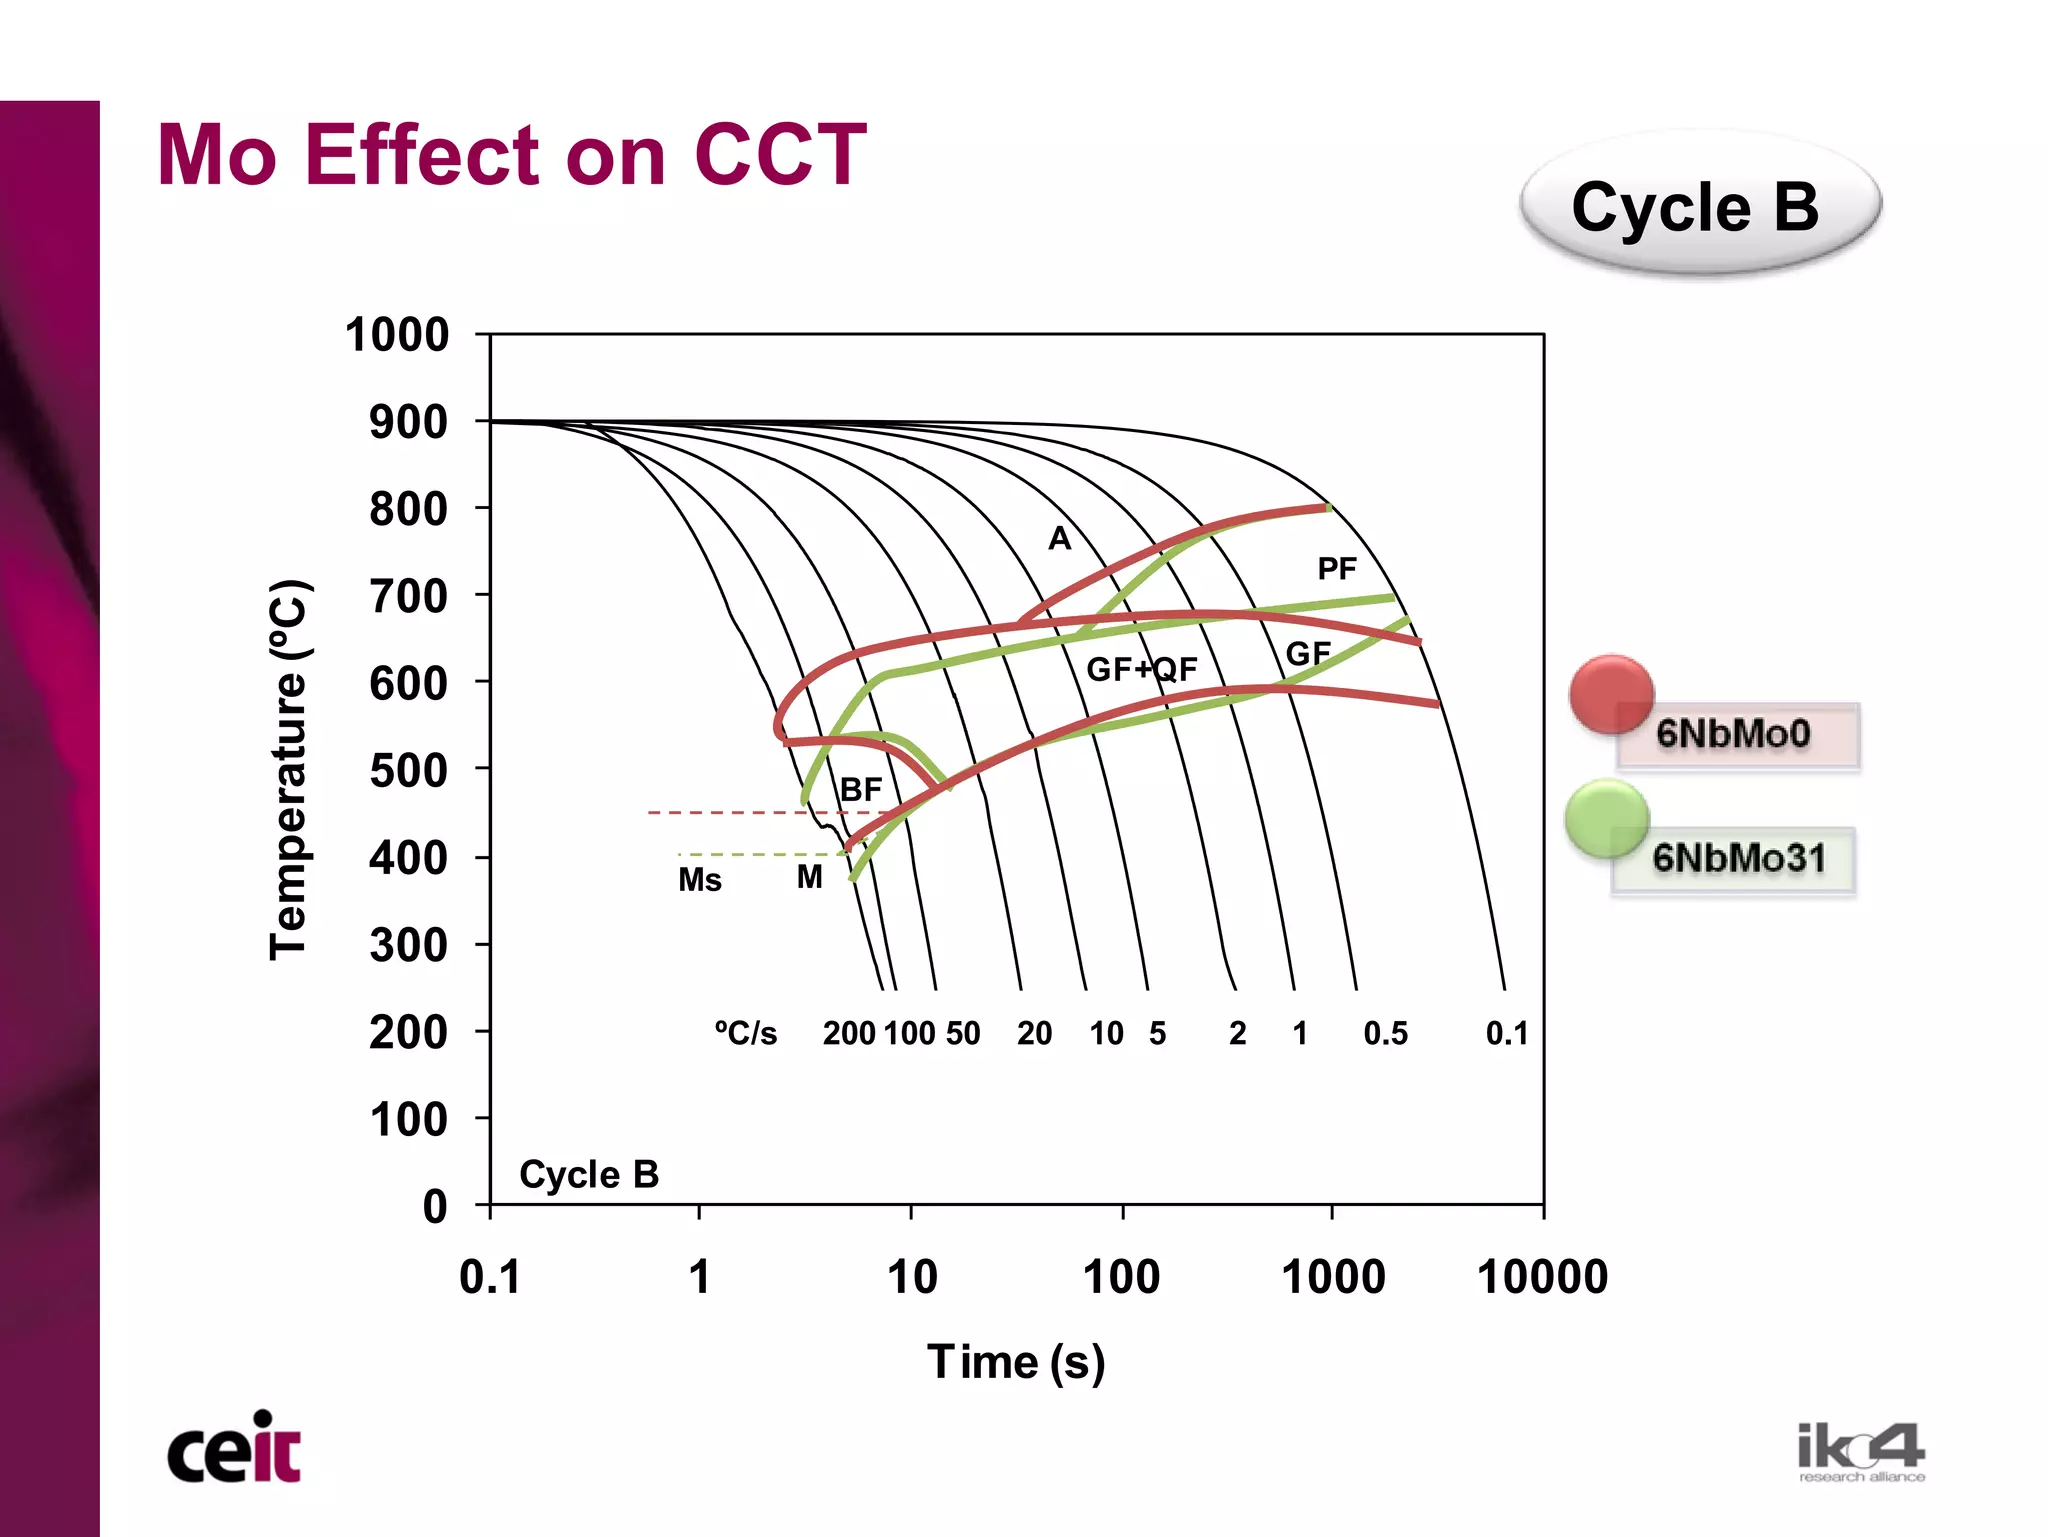

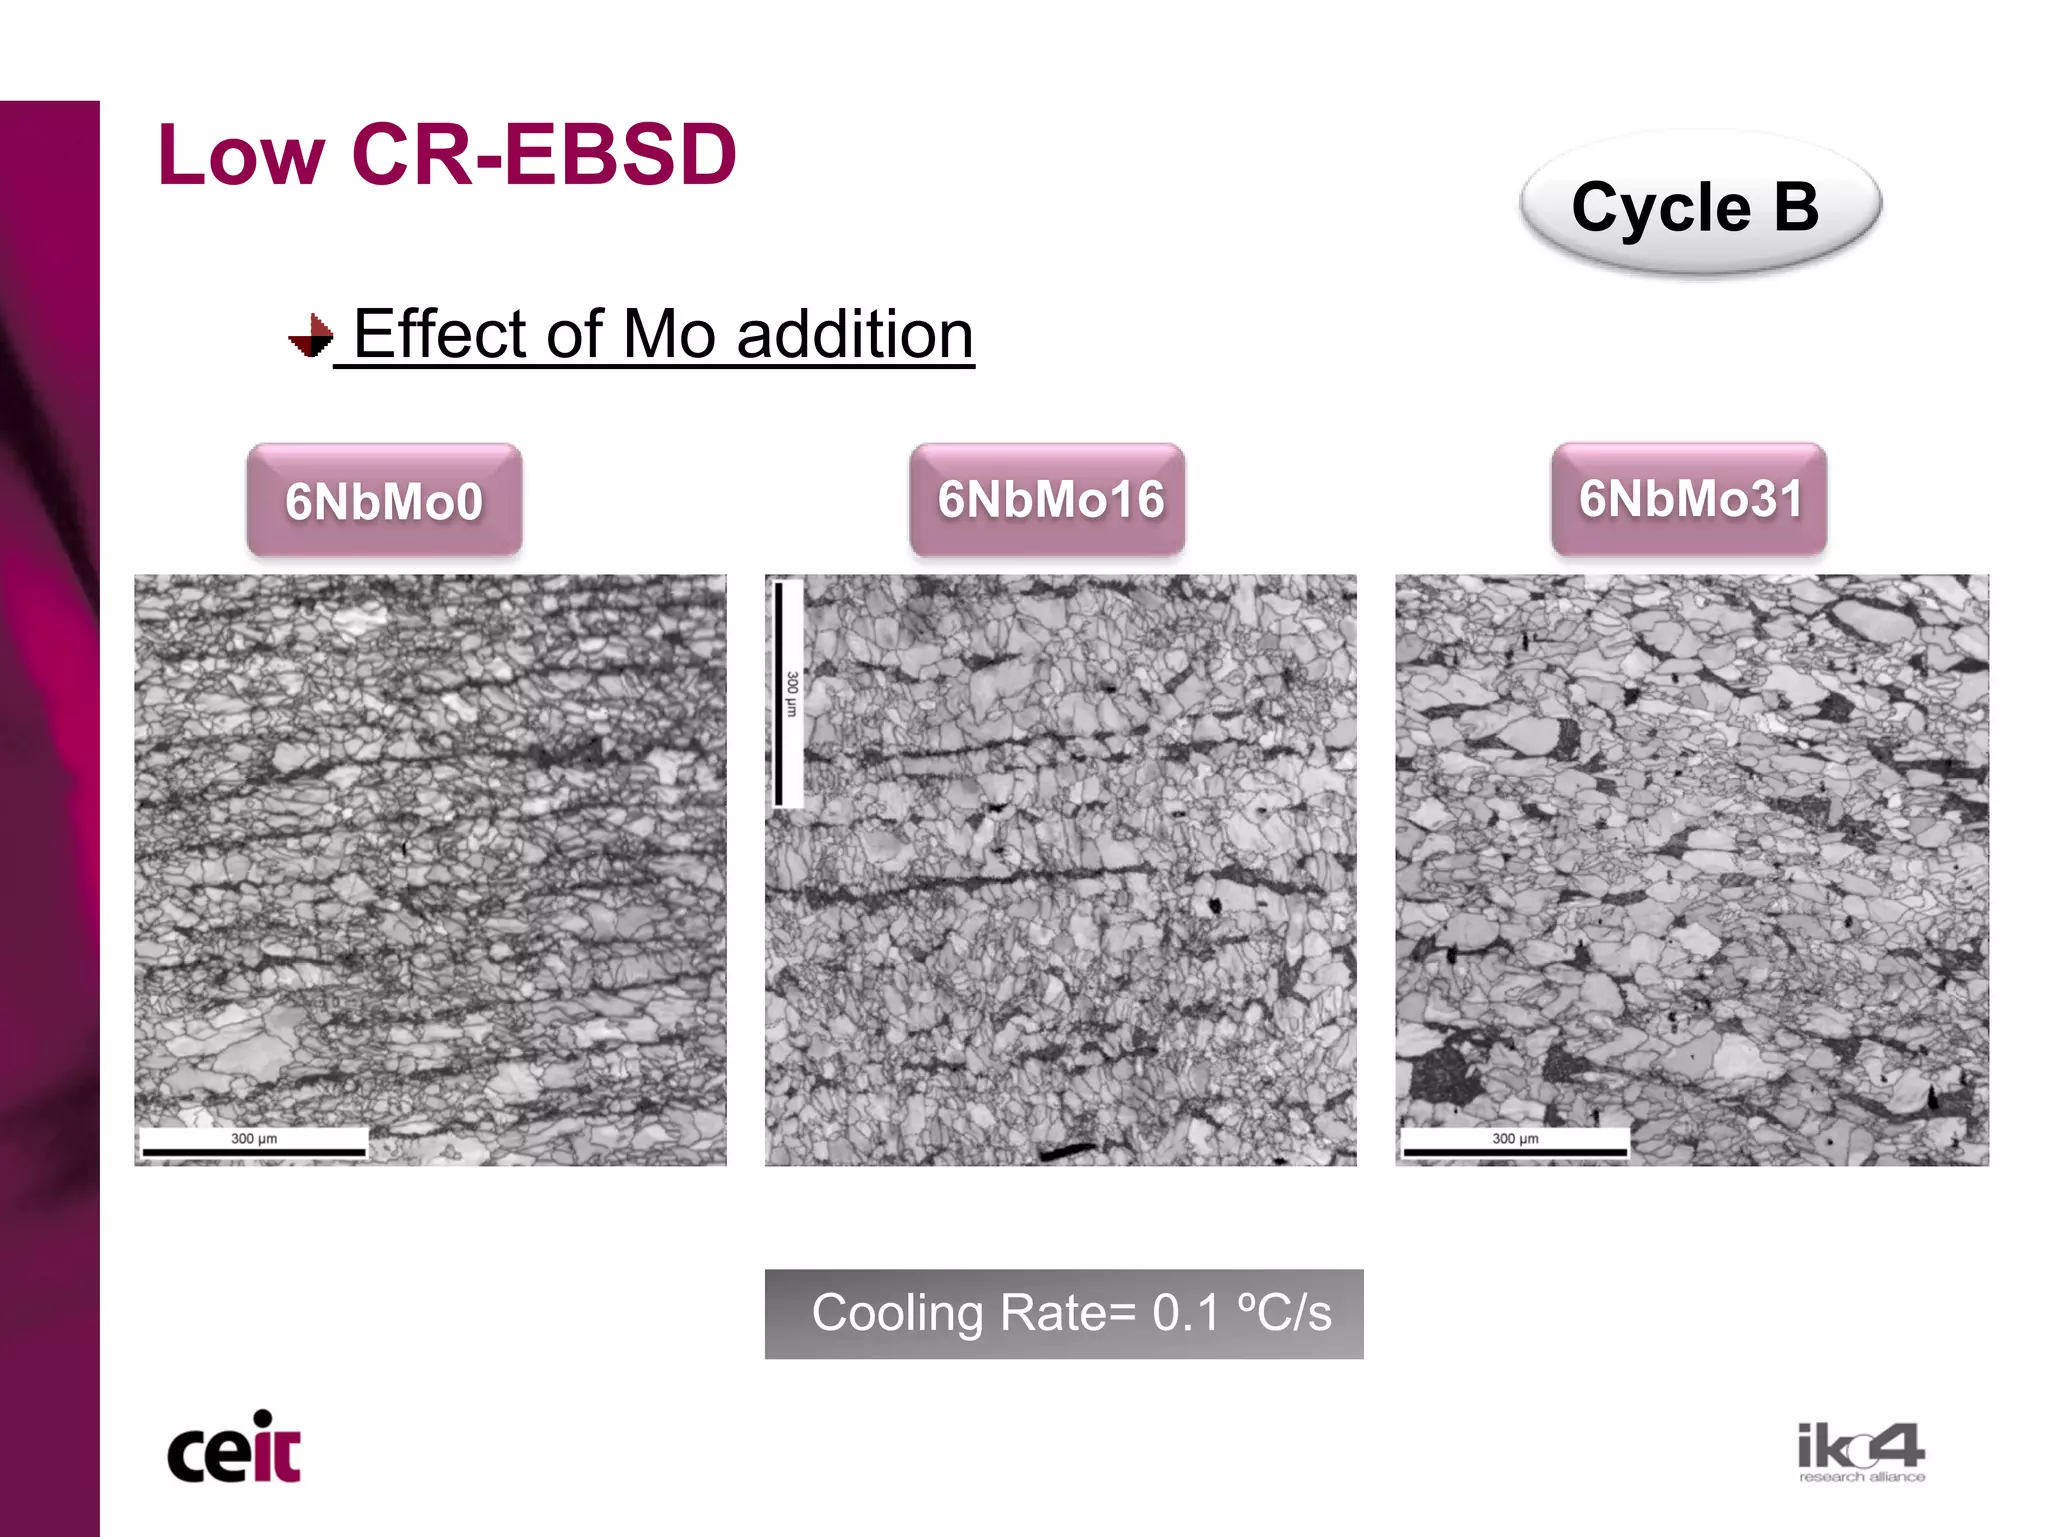
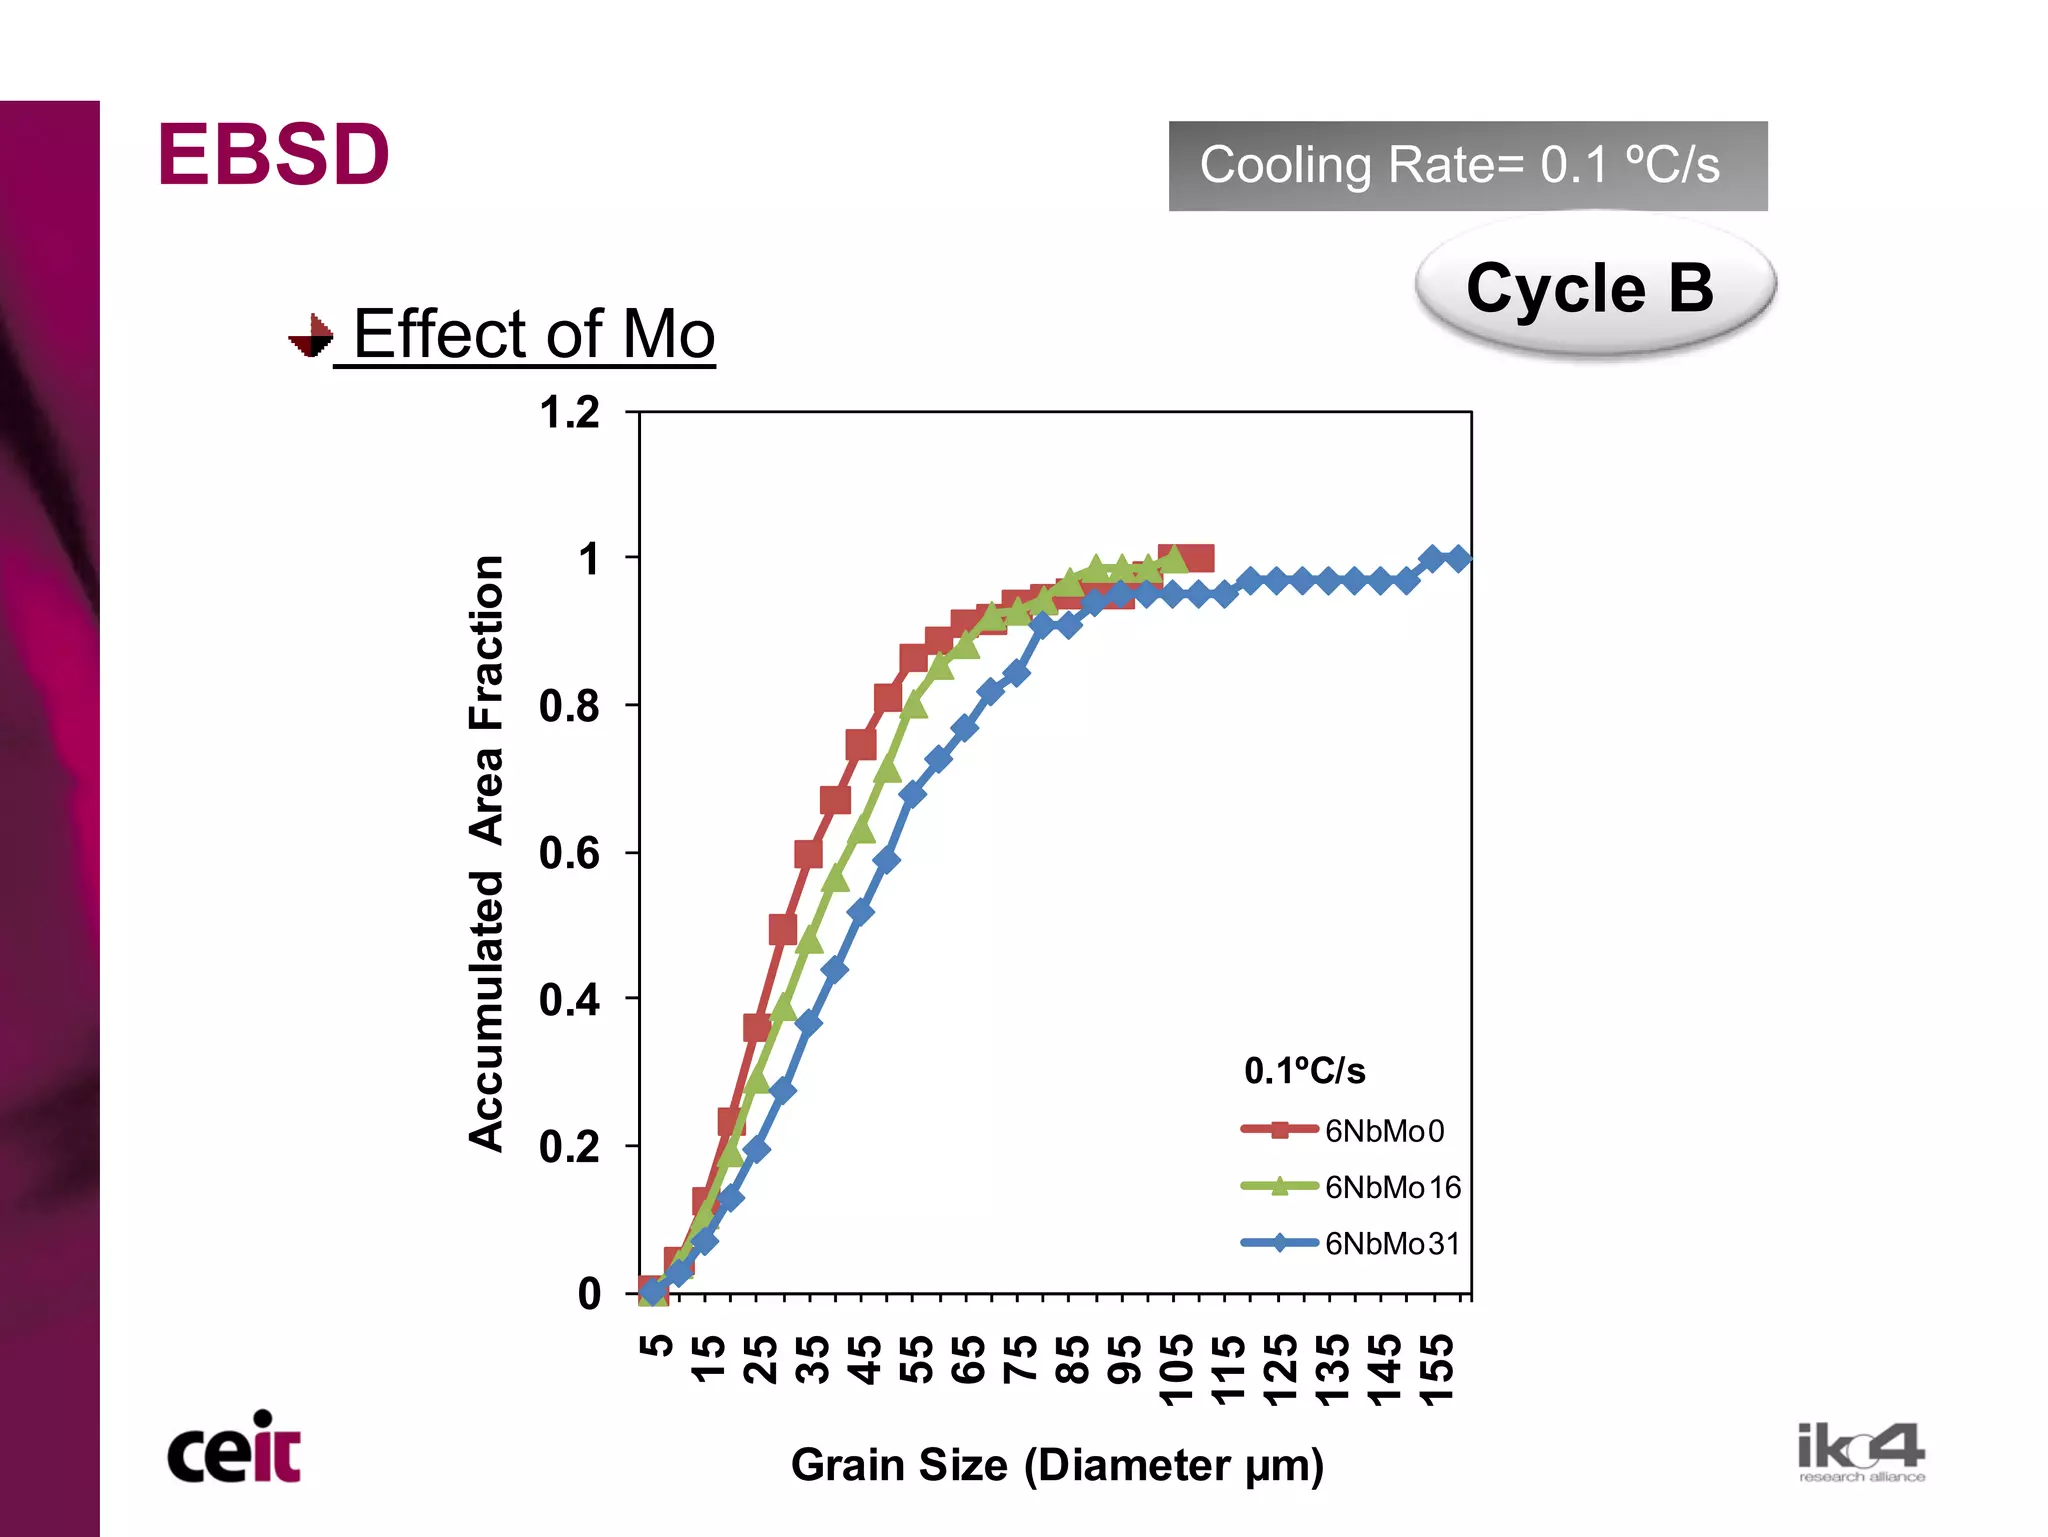
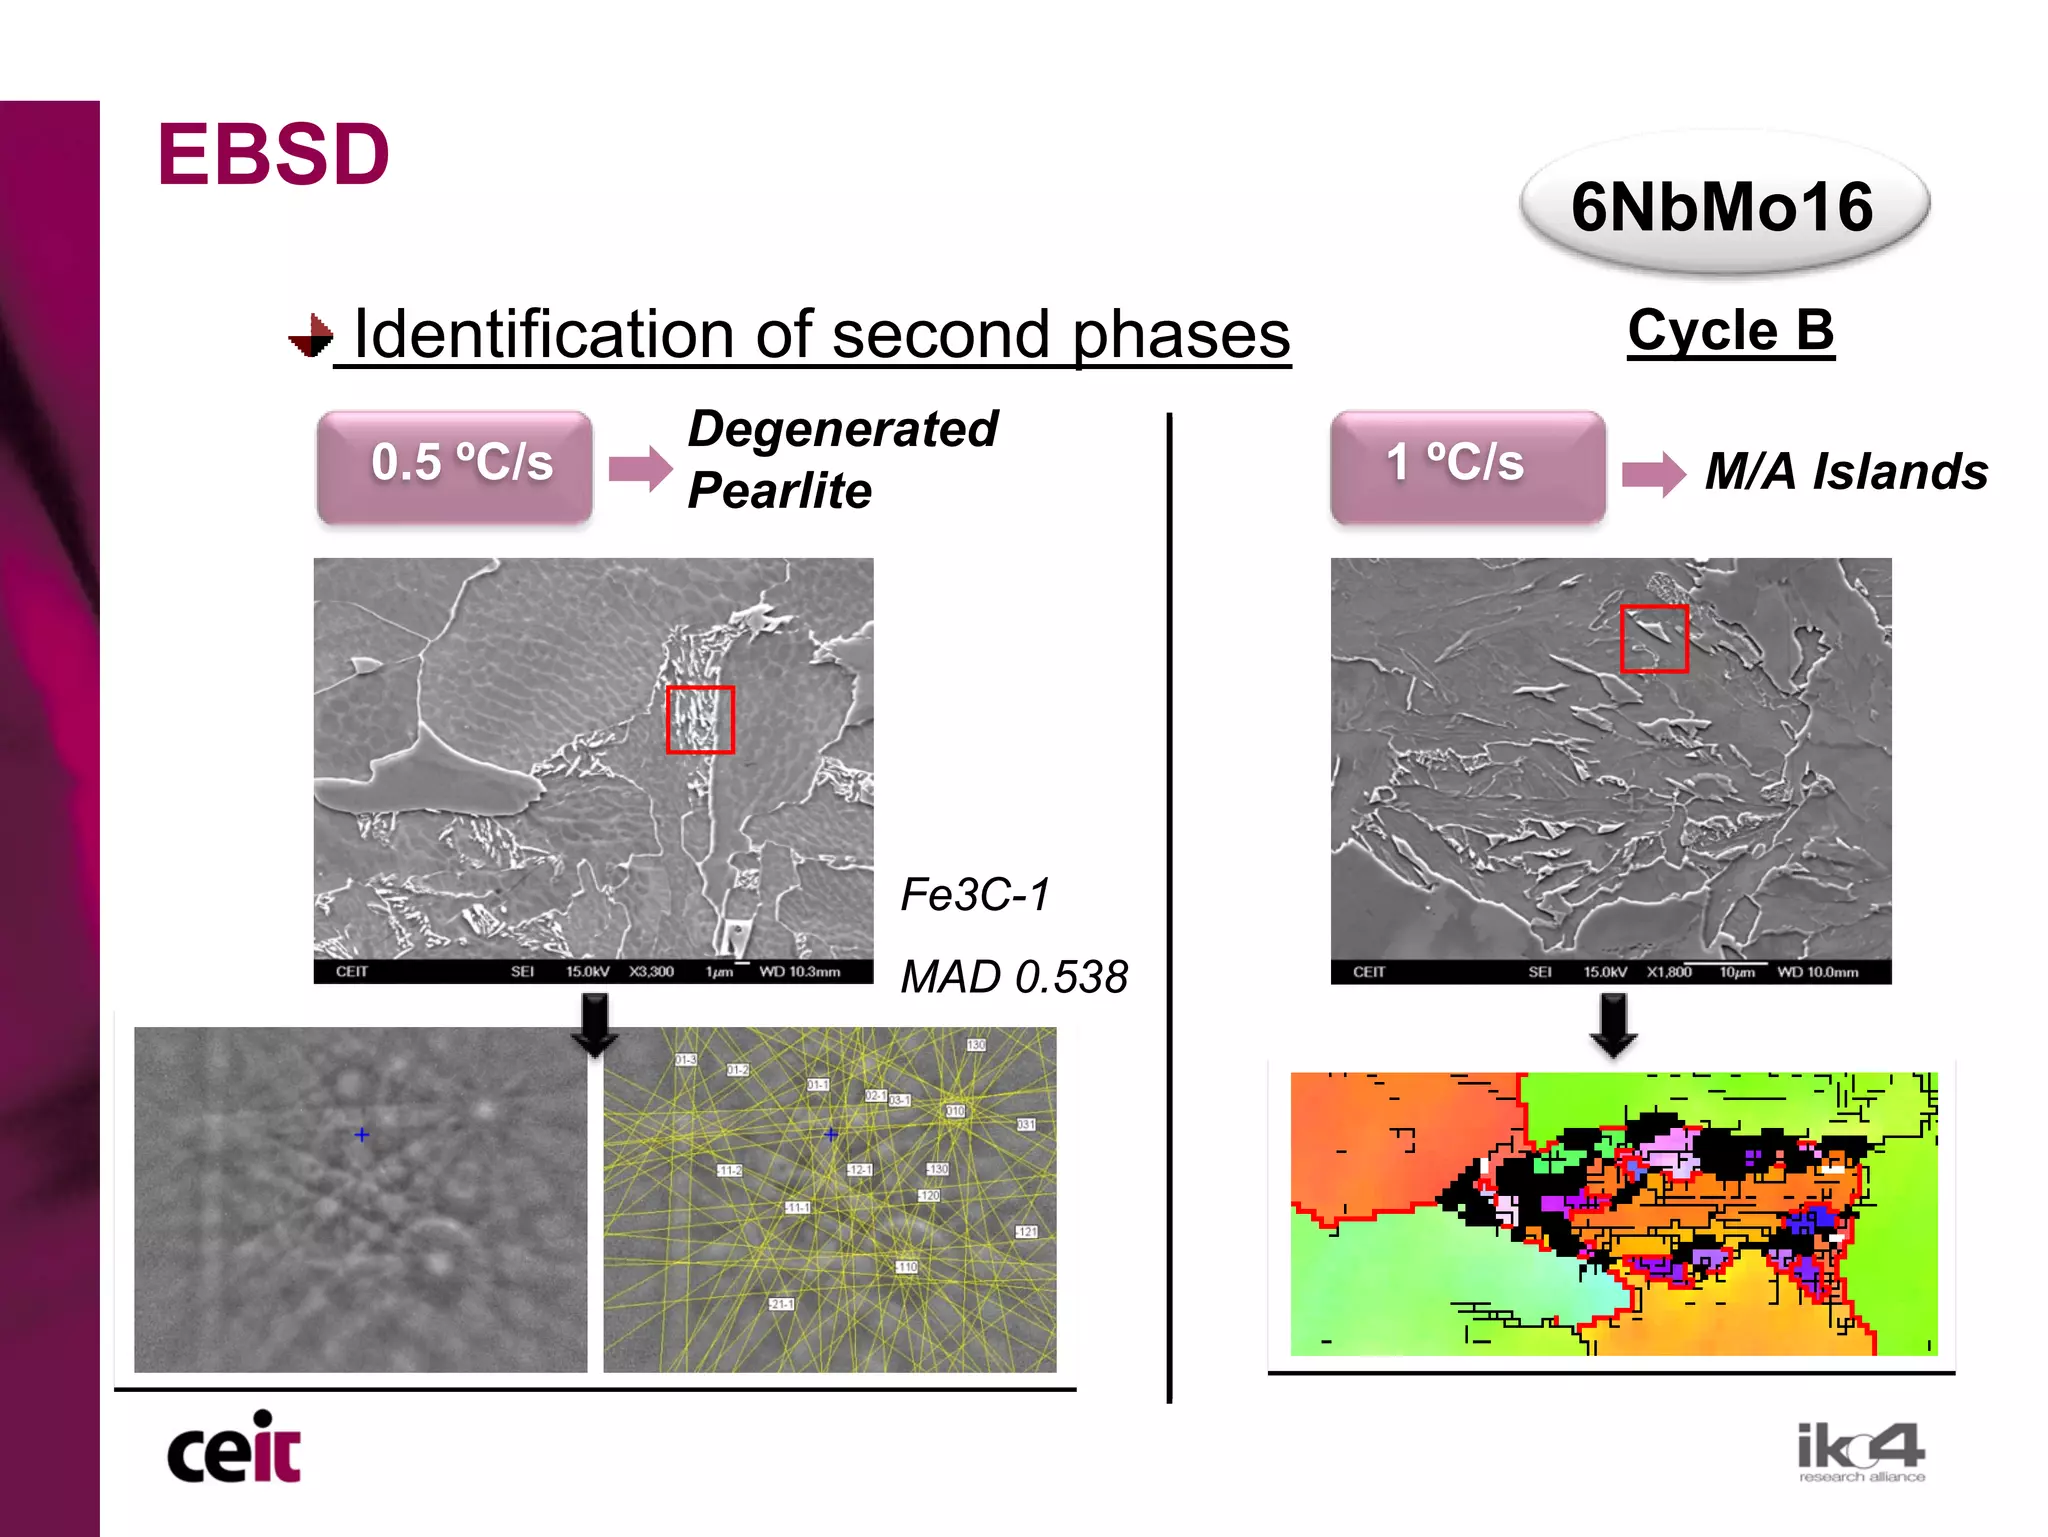

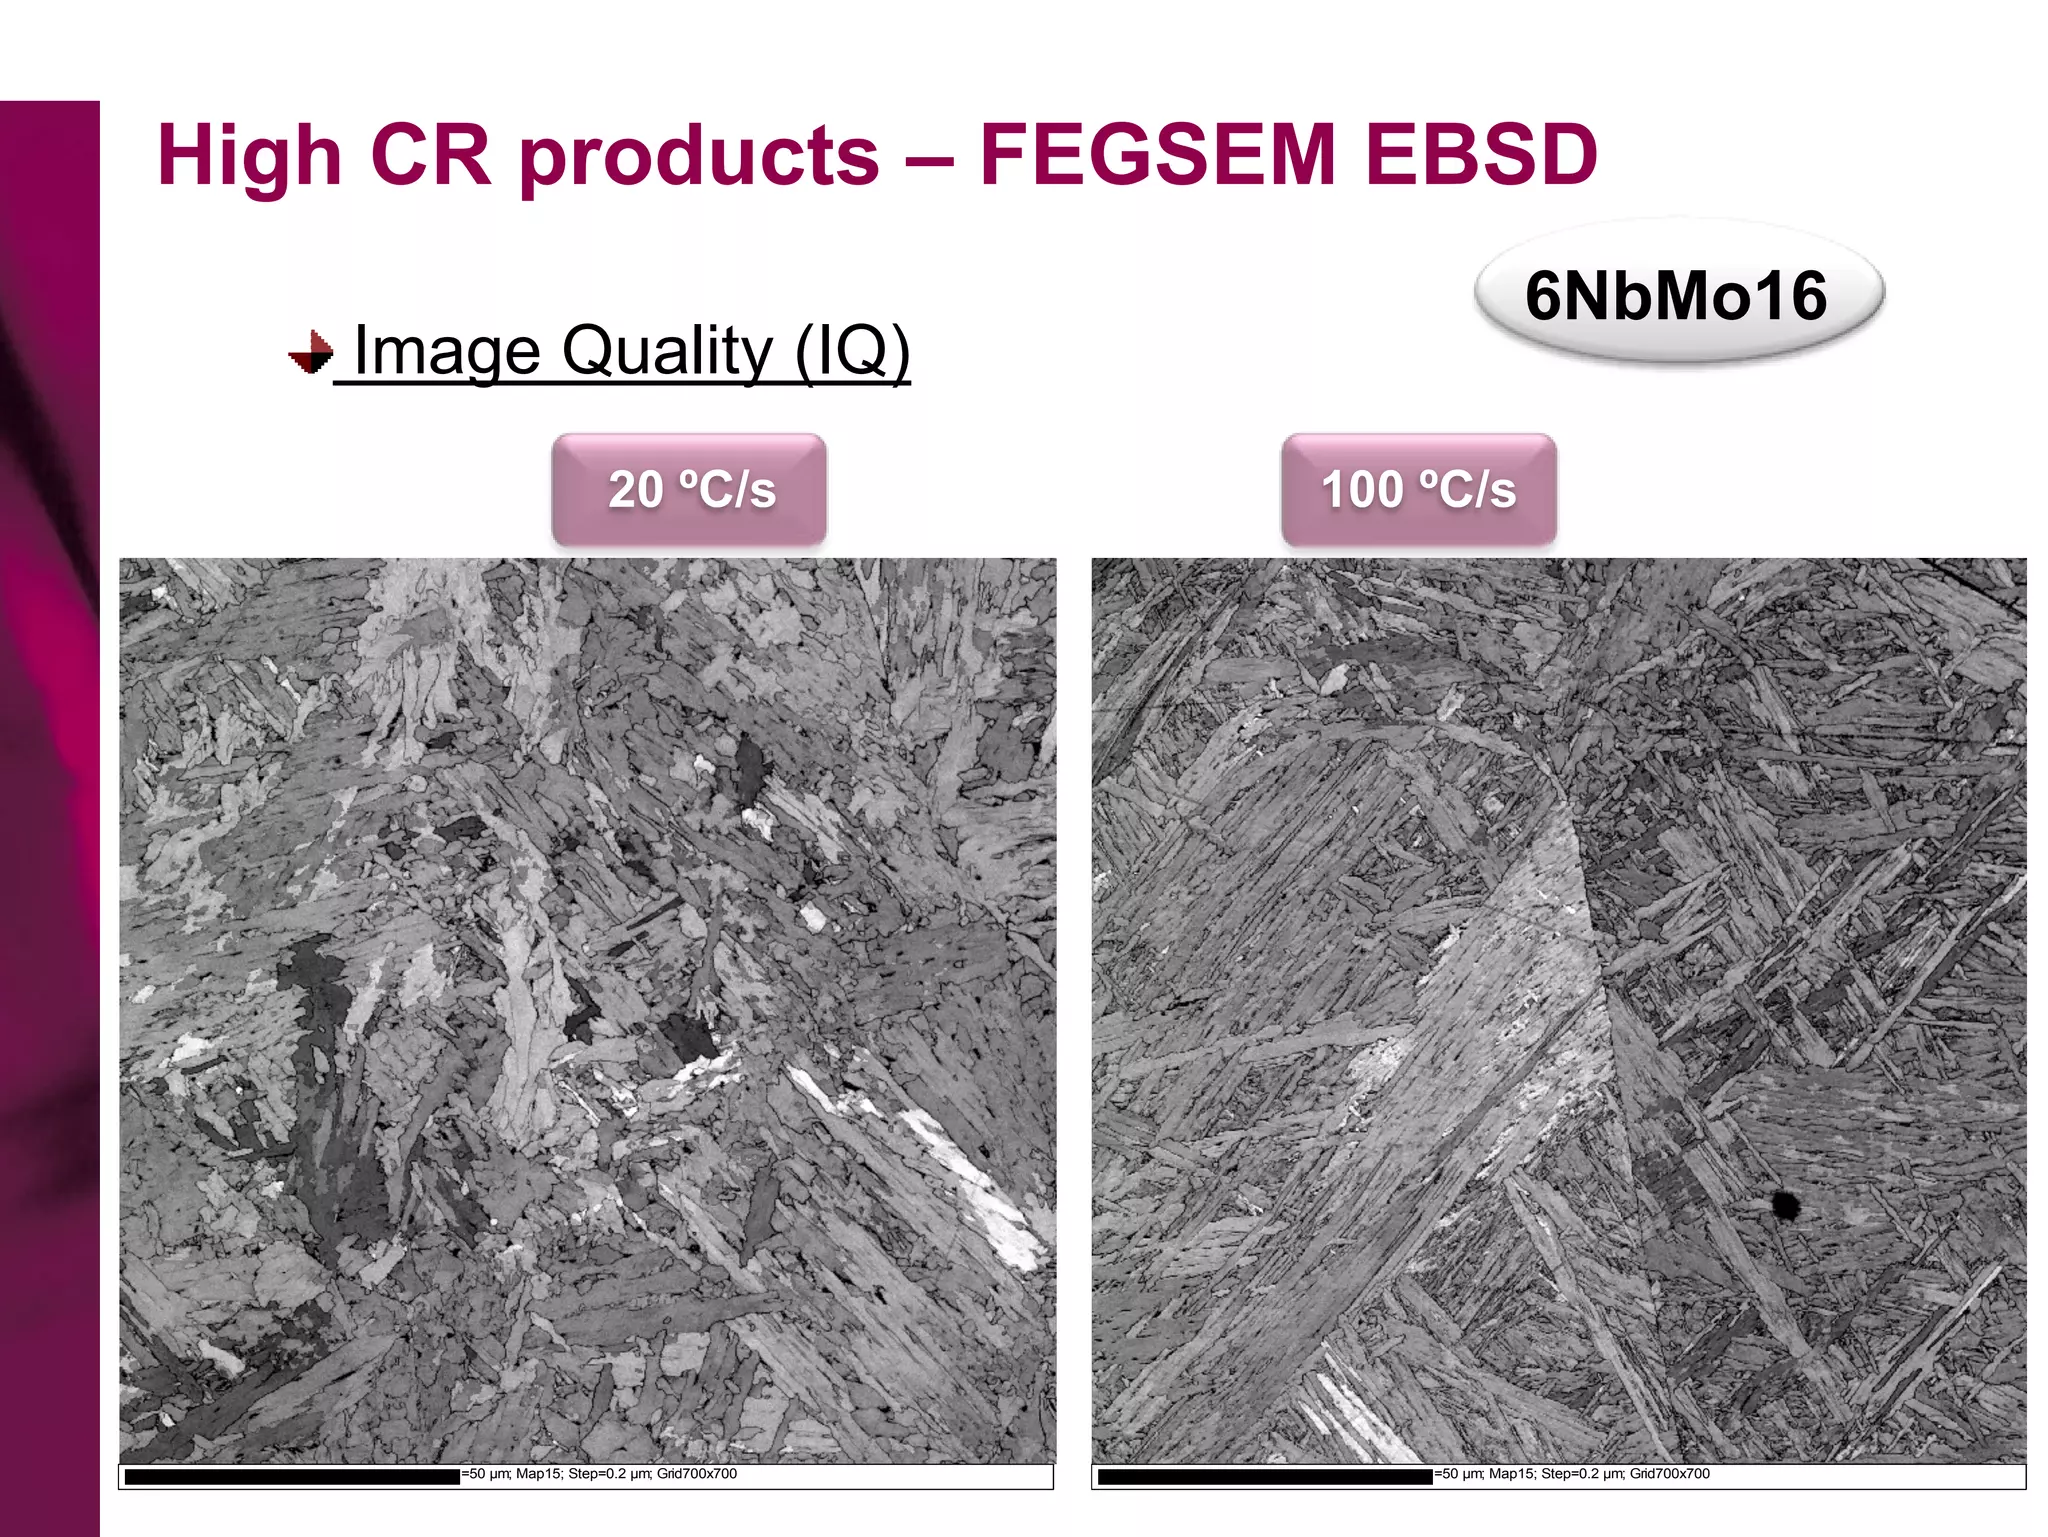
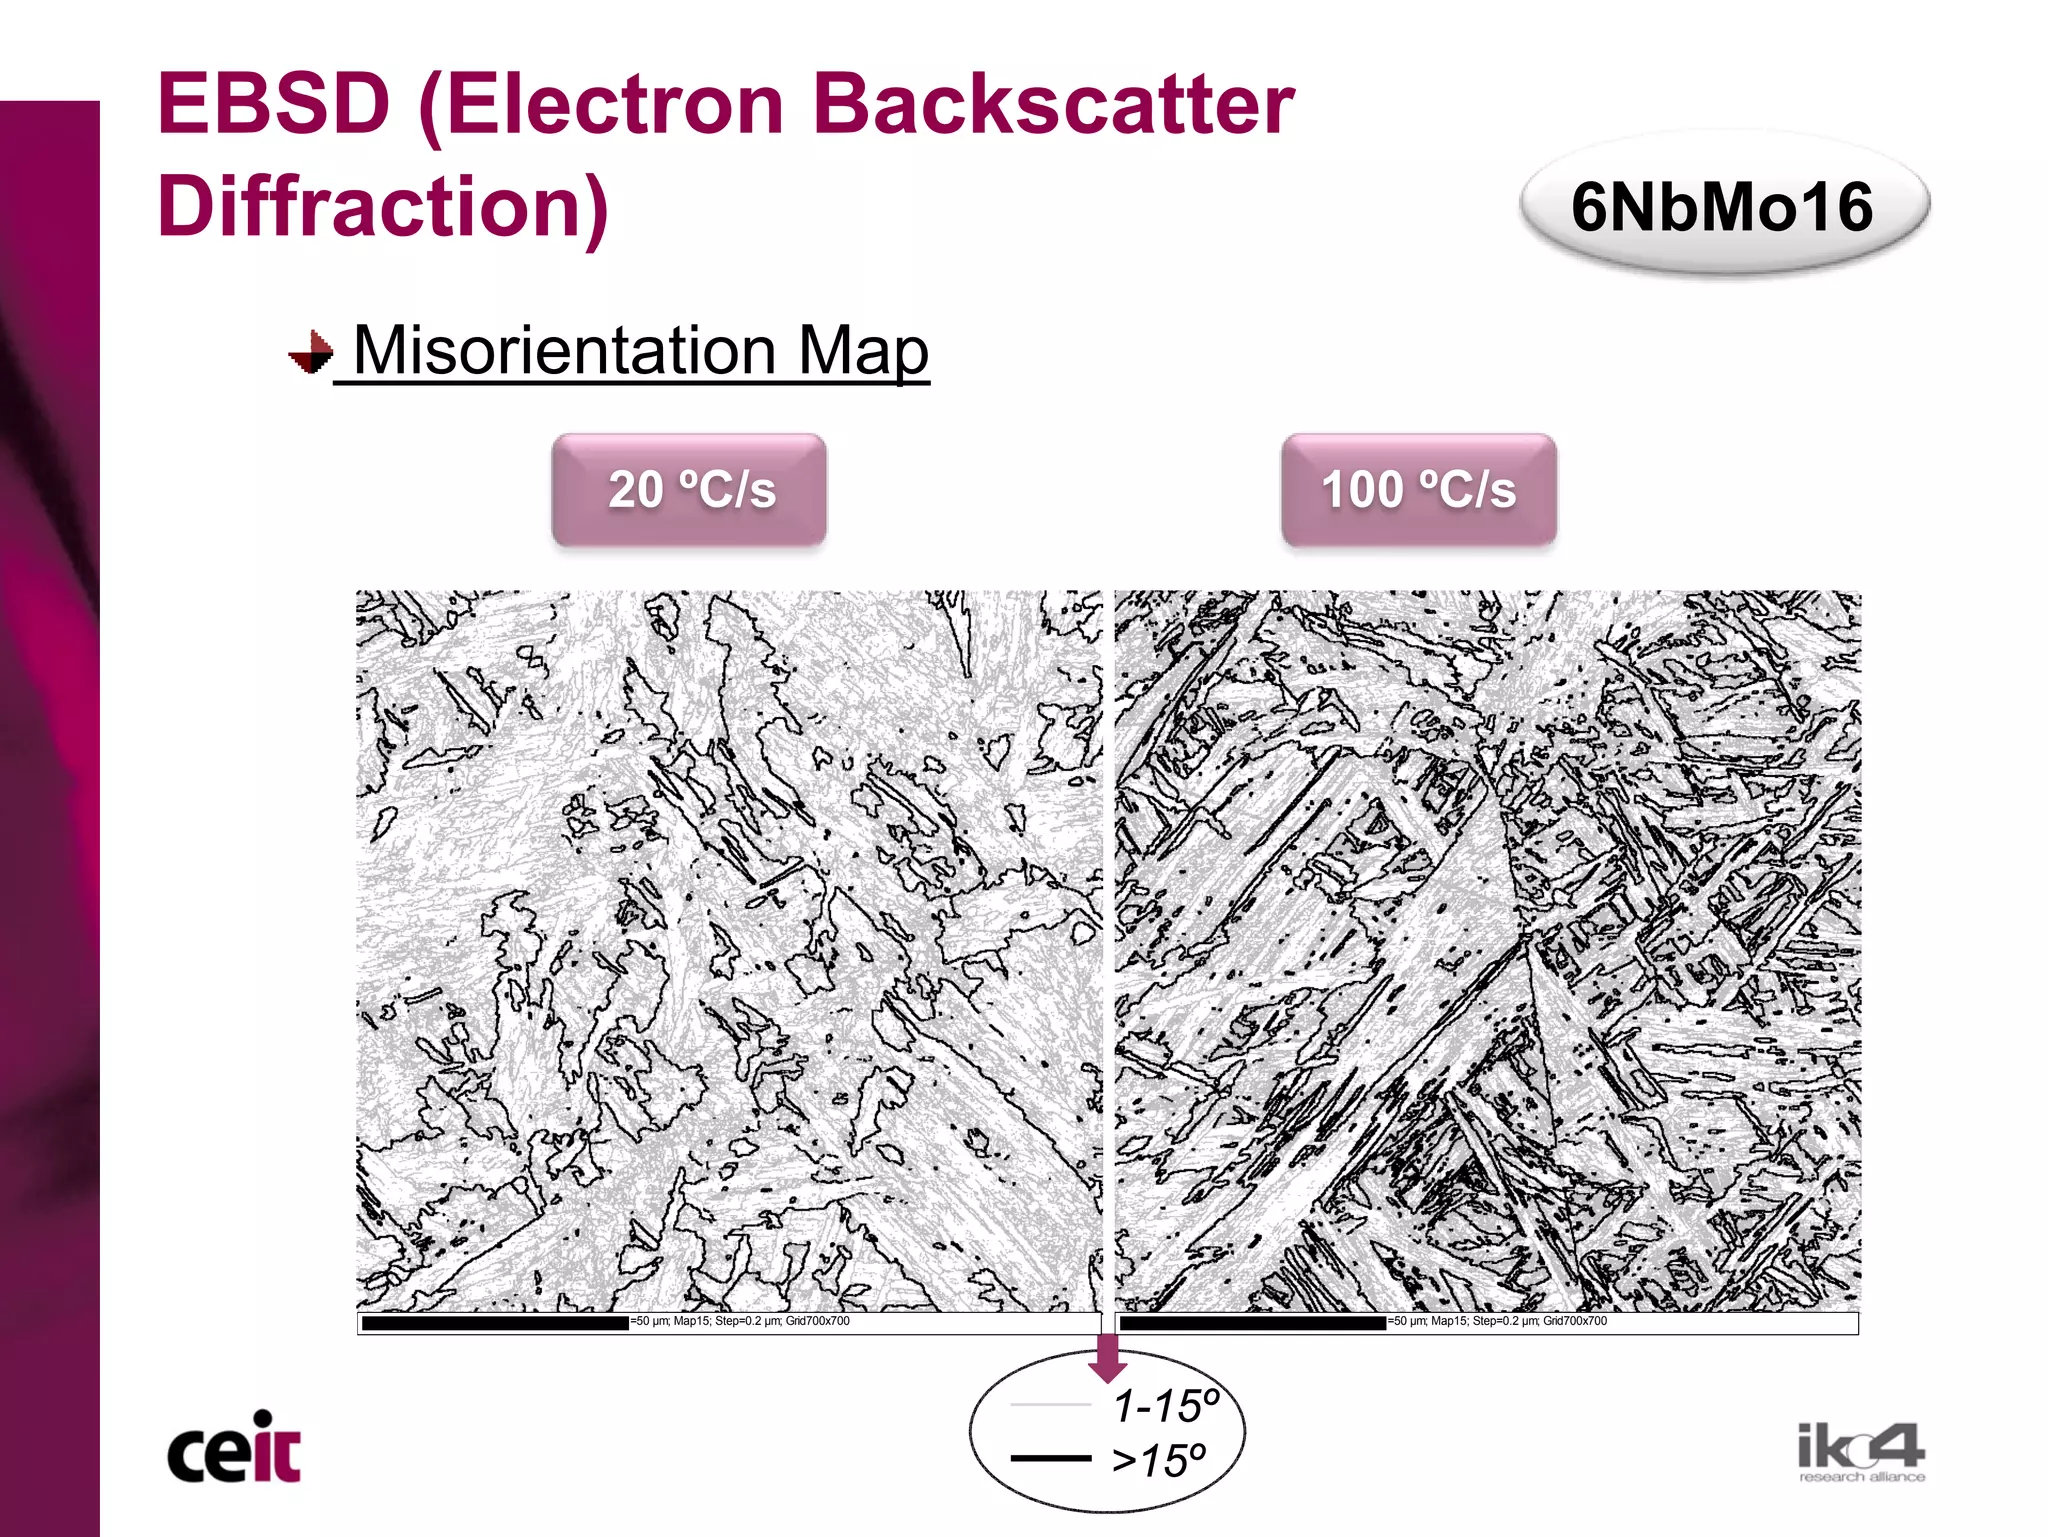
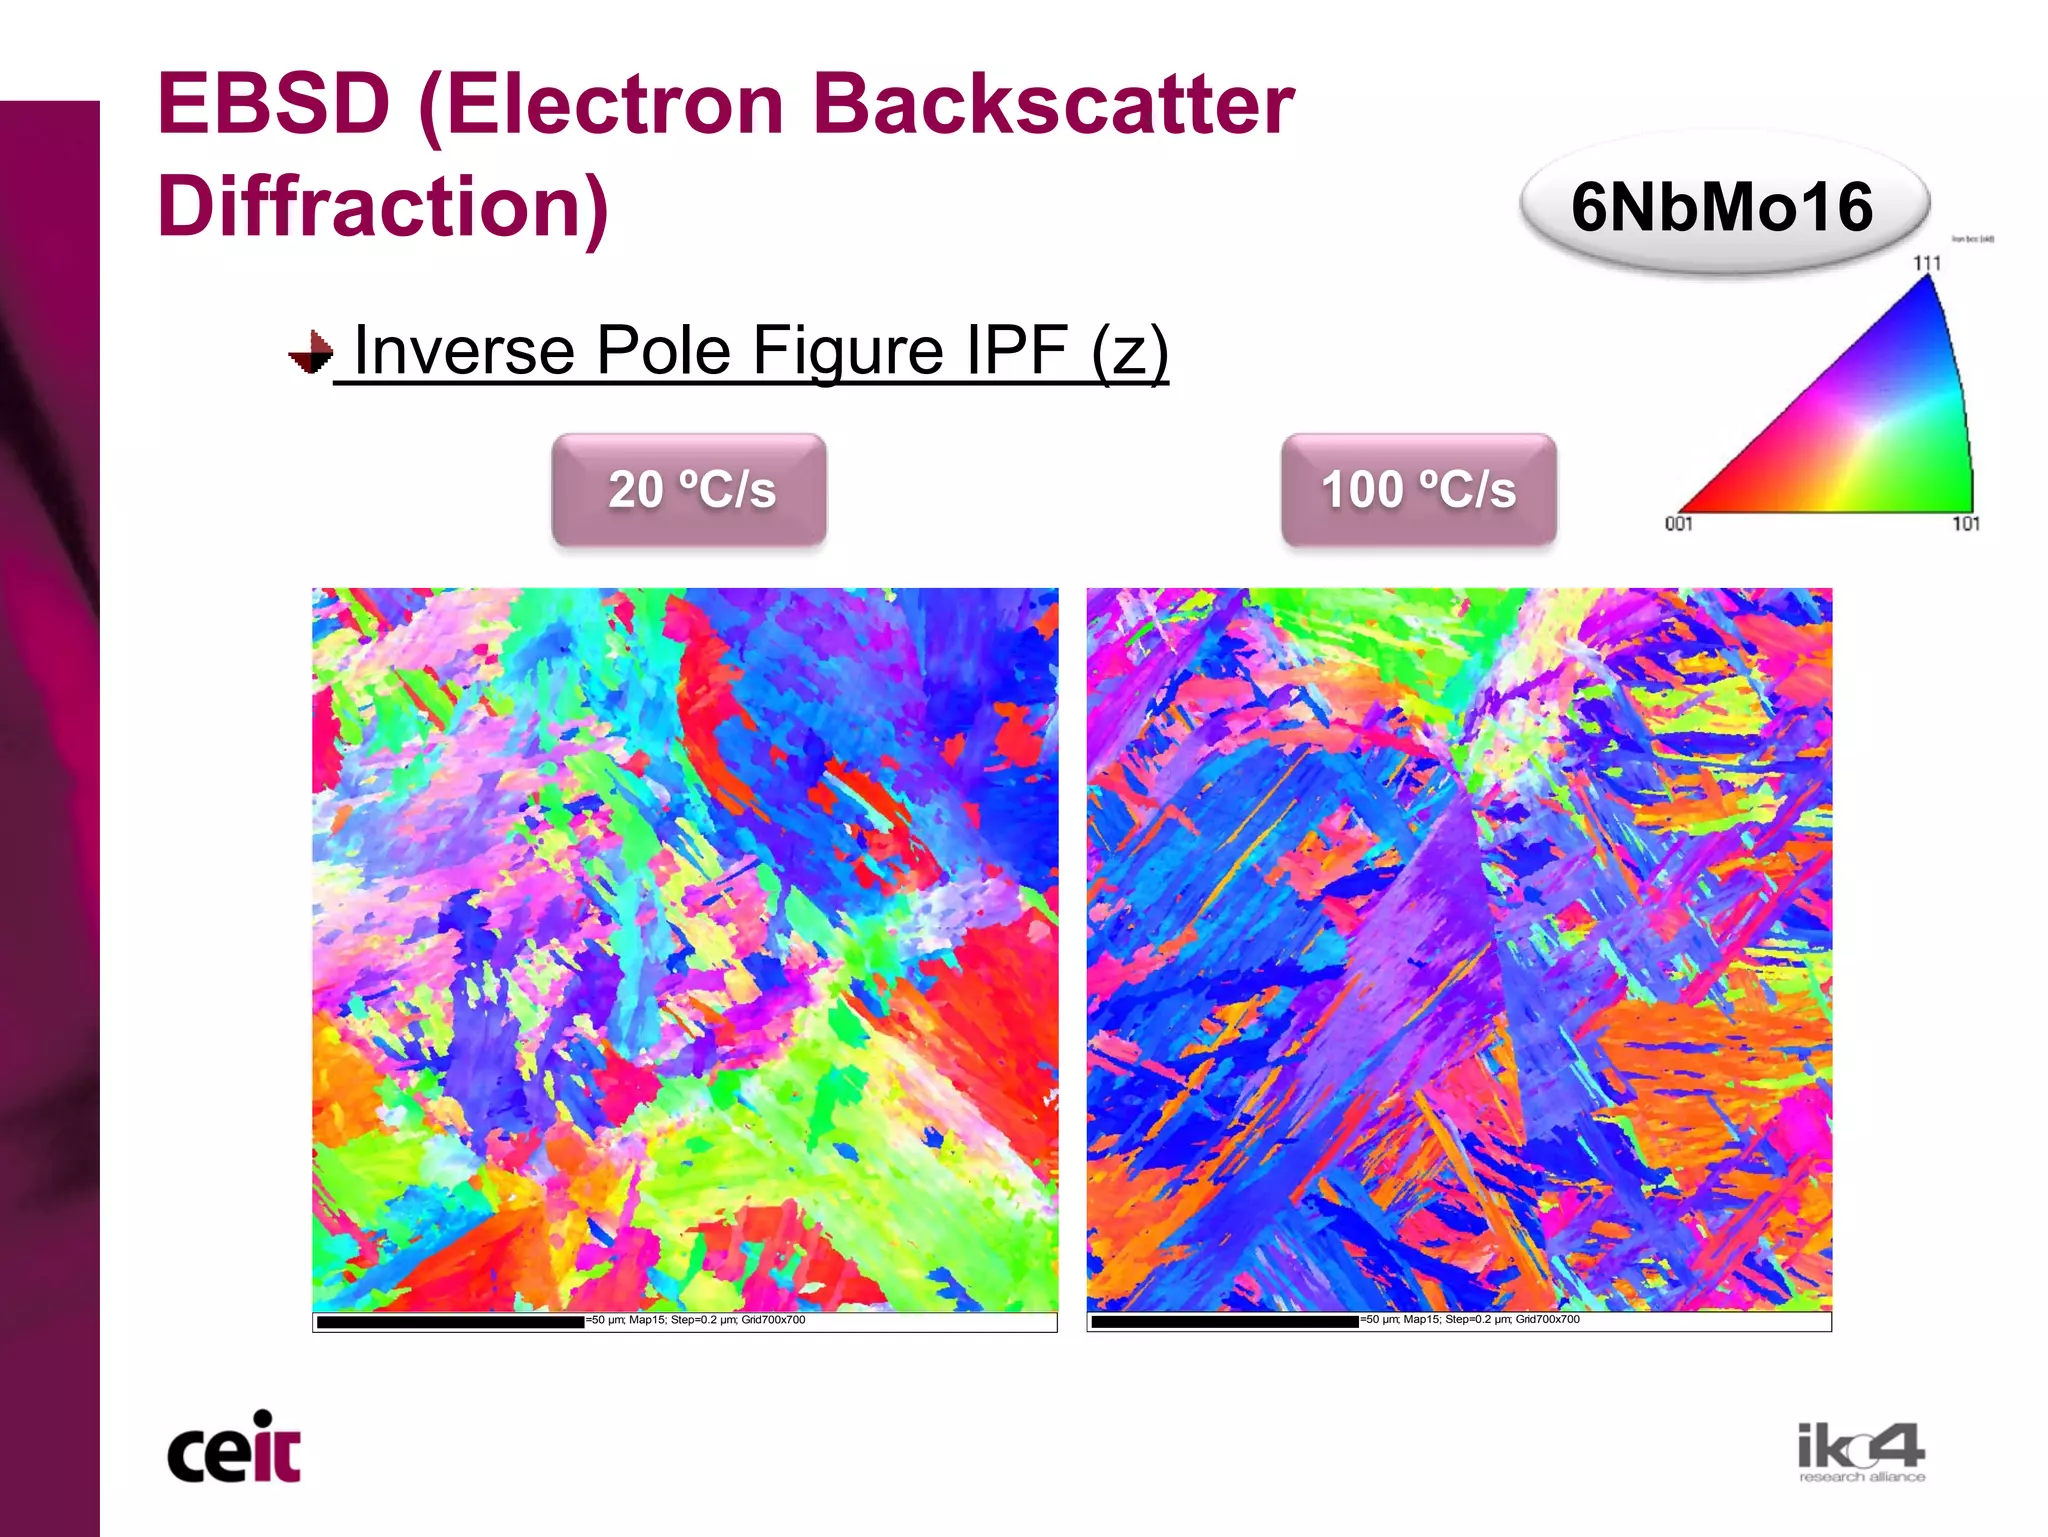


The document summarizes a study on the effect of composition and thermomechanical processing on the austenite transformation in Nb-Mo microalloyed steels. Seven steel compositions containing 0.05% C and varying amounts of Nb and Mo were subjected to two different thermomechanical cycles, involving deformation at different temperatures and cooling rates. Microstructural characterization showed the transformed phases depended on composition and processing. Dilatometry curves and continuous cooling transformation diagrams were produced to analyze the austenite transformation kinetics and phase stability regions.


![Vibe Coding vs. Spec-Driven Development [Free Meetup]](https://cdn.slidesharecdn.com/ss_thumbnails/vibecodingvsspecdrivendevelopment-251209105622-43f455e7-thumbnail.jpg?width=640&height=640&fit=bounds)


