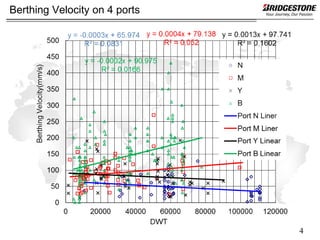
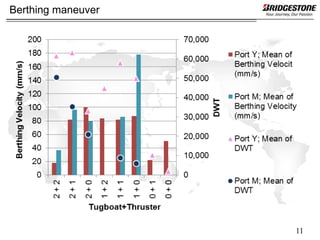
Measuring of berthing
 velocities in container berth
and applying to fender design
            Bridgestone
           Seigi Yamase
            7.Feb.2012
Berthing Velocity Standard data


                                  2
Container Vessel size distribution on 4 ports


                                                3
Berthing Velocity on 4 ports


                               4
Brolsma vs. 4 ports


                      5
Berthing Velocity on 4 ports


                               6
Frequency & Log-normal distribution


                                      7
Frequency & Log-normal distribution


                                      8
Wind effect


              9
Berthing maneuver


                    Port M


                     Port Y


                              10
Berthing maneuver


                    11
Berthing maneuver

     Port M


     Port Y


                    12
Conclusion in Berthing velocity measureing

   • Berthing velocity distribution is peculiar to each berth.
   • In these ports, there seems to be no correlation between
     vessel sizes and berthing velocities against Brolsma chart.
   • In these ports, wind effect doesn’t have significant influence.
     Wind doesn’t make the difference of berthing velocity
     distribution.
   • Tug boat and thruster seems to have equivalent ability to
     control berthing.
   • The main cause of difference of berthing velocity
     distributions shall depend on berthing principle of each port.


                                                                   13
Berthing velocity and fender performance

   1990’s Trellex element fender swept fender market. But their
   fenders broke very early.

   Reason 1
   The recess for fixing bolt had the strong stress concentration.
   Reason 2
   Trellex gave the big speed factor to element fender.
   Higher berthing velocity generated higher reaction force and
   bigger energy absorption.
   But speed factor and temperature factor are same characteristics
   in visco-elastic materials.
   Which has bigger reaction force, higher berthing velocity in
   tropical or lower berthing velocity in the winter in Norway ?
                                                                  14
Fender performance


                     15
Fender size


              16
Strain rate


              17
Temperature and speed


                        18
Experiment result and combined method result


                                               19
Temperature-frequency reducibility
William Landel and Ferry formula

                                                                       2
                         T     n                 aT       k   Ts
      G1 ( , T )                     Gk Ts                                 2
                        s Ts   k 1           1       aT       k   Ts
           T
               G1 ( aT , Ts )
          s Ts
                         T
      G2 ( , T )             G2 ( aT , Ts )
                        s Ts

     WLF formula
                                                 T    s                         c1 T Ts
         log10 aT              log
                                         s       T                             c2 T Ts
         Ts        Tg          50


                                                                                          20
3.5      -30 degrees

                                             3.0      -1 degrees
                                                        0


                       Reaction Force Rate
  Temperature vs.                                     23 degrees
                                             2.5
 deflection velocity
                                                      50 degrees
 on experiment and                           2.0
multiple combined at                                  70 degrees
 25% compression                             1.5
     deflection
                                             1.0

                                             0.5

                                             0.0
                                               1.E-08 1.E-06 1.E-04 1.E-02 1.E+00 1.E+02

                                                             aT*strain rate
                                                                                           21
Comparison with Japanese manufactures’ TF & VF
                           Company      Company    Company        Company             Company
                              A            B          C              D                   E
                                        Circular
Sample Shape               Circular                Rectangle       Circular
                                        Cylinder                                         -
                          Corn Type                  Type         Corn Type
                                         Type
Sample Height
(Nominal Height)            100mm       125mm       100mm             100mm              -
Preliminary Compression     10times      3times    10times            5times             -
Compression Interval
in measuring TF             6 hours     3.5hours       -              6 hours            -
                             -30℃        -20℃        50℃
                               ↓           ↓          ↓                50℃
Order of measurement          50℃         50℃       -30℃                ↓                -
                               ↓                      ↓               -30℃
                             -30℃                    50℃
Performance
                          Hard   Soft      -           -       Hard    Mid Soft          -
(Rubber) Grade
Max Difference between
                          0.03   0.06     0.09       0.02      0.04    0.03 0.06        0.02
TF and VF
Glass Transition
                          -41.9 -41.9     -45        -35       -32      -36     -38     -34
Temperature (℃)


                                                                                               22
TF & VF for each manufactures -1
(After convert to WLF formula)
                           2                                                                                   2
                                     Company A - Hard: aT converted to TF                                                Company A - Soft: aT converted to TF
                                     Company A - Hard: VF                                                                Company A - Soft: VF


                          1.5                                                                                 1.5
    Reaction Force Rate


                                                                                     Reaction Force Rate
                           1                                                                                   1


                          0.5                                                                                 0.5
                            1.E-03      1.E-01    1.E+01      1.E+03        1.E+05                              1.E-03      1.E-01    1.E+01     1.E+03         1.E+05
                                            aT×Strain Rate (%/sec)                                                              aT×Strain Rate(%/sec)

                           2                                                                                   2
                                     Company B: aT converted to TF
                                                                                                                         Company C: aT converted to TF
                                     Company B: VF
                                                                                                                         Company C: VF
    Reaction Force Rate


                          1.5                                                                                 1.5
                                                                                        Reaction Force Rate


                           1                                                                                   1


                          0.5                                                                                 0.5
                            1.E-03      1.E-01    1.E+01     1.E+03         1.E+05                              1.E-03 1.E-01 1.E+01 1.E+03 1.E+05 1.E+07
                                            aT×Strain Rate(%/sec)                                                             aT×Strain Rate(%/sec)                      23
TF & VF for each manufactures -2
(After convert to WLF formula)
                                2                                                                                     2
                                          Company D - Hard: aT converted                                                        Company D - Mid: aT converted
                                          to TF                                                                                 to TF
    Reaction Force Rate


                                                                                               Reaction Force Rate
                               1.5                                                                                   1.5


                                1                                                                                     1


                               0.5                                                                                   0.5
                                 1.E-03      1.E-01    1.E+01      1.E+03        1.E+05                                1.E-03      1.E-01    1.E+01      1.E+03   1.E+05
                                                 aT×Strain Rate (%/sec)                                                                aT×Strain Rate (%/sec)

                                2                                                                                      2
                                          Company D - Soft: aT converted to TF                                                   Company E: aT converted to TF
                                          Company D - Soft: VF                                                                   Company E: VF
         Reaction Force Rate


                               1.5                                                        Reaction Force Rate        1.5


                                1                                                                                      1


                               0.5                                                                                   0.5
                                 1.E-03      1.E-01    1.E+01      1.E+03        1.E+05                                1.E-03      1.E-01    1.E+01      1.E+03   1.E+05
                                                 aT×Strain Rate (%/sec)                                                                aT×Strain Rate (%/sec)              24
2.0


                      1.5
Reaction Force Rate


                      1.0
                                                               Bridgestone Hard rubber compound TCF

                                                               Bridgestone Soft rubber compound VCF

                                                               Company Z TCF

                                                               Company Z VCF

                      0.5
                        1.E-03   1.E-01   1.E+01   1.E+03   1.E+05     1.E+07    1.E+09      1.E+11   1.E+13
                                                        aT×v (%/sec)


                                                                                                         25
Temperature and Strain rate


                              26
Conclusion of the relation between velocity and temperature

    • The velocity factor and temperature factor of fender reaction
      force are expressed as unity by WLF formula. Temperature-
      frequency reducibility can be applied to fender reaction force.
    • Temperature and speed factors of some companies can not be
      applied to WLF formula. They might make some mistakes in
      experiment or data handling. PIANC WG145 will define test
      procedure for temperature and speed factor in detail to avoid
      making wrong data.


                                                                   27
Measured Berthing Angle in 4 ports


                                     28
Berthing angle vs. Berthing velocity


                                       29
Berthing angle vs. DWT


                         30
Container vessel shape and flare angle
   Upper Column:Dimension
                                  Maersk         Post
   Lower Column:Divided by                                Panamax
                                  E class      Panamax
      dimension of No.3
              No.                    1             2          3
            Length m              397.71        333.60     276.00
       Length i /Length 3           1.44          1.21       1.00
             Lpp m                376.00        316.30     260.80
           Lpp i /Lpp 3             1.44          1.21       1.00
            Width m                56.70         45.60      32.20
        Width i /Width 3            1.76          1.42       1.00
  Depth (from themain deck) m      30.00         27.20      21.00
         Depth i /depth 3           1.43          1.30       1.00
           Draught m               15.50         14.50      11.50
      Draughti /Draught 3           1.35          1.26       1.00
             DWT                156907.00     102351.00   63265.00                                        Figure 3 Fender elevation
         DWTi /DWT3                  2.48         1.62      1.00
            TEU                   15500.00      9200.00   4100.00
          TEUi /TEU3                 3.78         2.24      1.00
                  Table 1 Container vessel dimensions


                                No.1; Maersk E class                        No. 2; Post Panamax                         No.3; Panamax
                                                                                                                                        31
                                                      Figure 2: Cross sectional views of No.1, No. 2 and No.3 vessels
How to obtain flare angle


                            32
Flare angle vs. Berthing Angle


                                 33
Hull radius in horizontal plane


                                  34
Ratio of Parallel Hull at Fender elevation in Port Y


                                                       35
Conclusion in berthing angle

   • Actual berthing angles are rather small than design
     conditions.
   • In this study, flare angles are bigger three times than berthing
     angles in minimum.
   • In horizontal plane, the contact point of vessel hull to fender
     has big hull radius. Many fenders were installed on every 15
     to 20m in container berth. Multiple fenders could absorb
     berthing energy.
   • Container vessel upsize rapidly and container vessel shape
     change greatly. The shape of the latest container vessel
     cannot be obtained. There may be a big difference in the
     present status with this study.


                                                                   36
THANK YOU
 FOR YOUR ATTENTION!


TAKK FOR DIN STØTTE TIL
 JAPAN JORDSKJELV OG
     TSUNAMI 2011.
                          37

Measuring berthing data

  • 1.
    Measuring of berthing velocities in container berth and applying to fender design Bridgestone Seigi Yamase 7.Feb.2012
  • 2.
  • 3.
    Container Vessel sizedistribution on 4 ports 3
  • 4.
  • 5.
  • 6.
  • 7.
    Frequency & Log-normaldistribution 7
  • 8.
    Frequency & Log-normaldistribution 8
  • 9.
  • 10.
    Berthing maneuver Port M Port Y 10
  • 11.
  • 12.
    Berthing maneuver Port M Port Y 12
  • 13.
    Conclusion in Berthingvelocity measureing • Berthing velocity distribution is peculiar to each berth. • In these ports, there seems to be no correlation between vessel sizes and berthing velocities against Brolsma chart. • In these ports, wind effect doesn’t have significant influence. Wind doesn’t make the difference of berthing velocity distribution. • Tug boat and thruster seems to have equivalent ability to control berthing. • The main cause of difference of berthing velocity distributions shall depend on berthing principle of each port. 13
  • 14.
    Berthing velocity andfender performance 1990’s Trellex element fender swept fender market. But their fenders broke very early. Reason 1 The recess for fixing bolt had the strong stress concentration. Reason 2 Trellex gave the big speed factor to element fender. Higher berthing velocity generated higher reaction force and bigger energy absorption. But speed factor and temperature factor are same characteristics in visco-elastic materials. Which has bigger reaction force, higher berthing velocity in tropical or lower berthing velocity in the winter in Norway ? 14
  • 15.
  • 16.
  • 17.
  • 18.
  • 19.
    Experiment result andcombined method result 19
  • 20.
    Temperature-frequency reducibility William Landeland Ferry formula 2 T n aT k Ts G1 ( , T ) Gk Ts 2 s Ts k 1 1 aT k Ts T G1 ( aT , Ts ) s Ts T G2 ( , T ) G2 ( aT , Ts ) s Ts WLF formula T s c1 T Ts log10 aT log s T c2 T Ts Ts Tg 50 20
  • 21.
    3.5 -30 degrees 3.0 -1 degrees 0 Reaction Force Rate Temperature vs. 23 degrees 2.5 deflection velocity 50 degrees on experiment and 2.0 multiple combined at 70 degrees 25% compression 1.5 deflection 1.0 0.5 0.0 1.E-08 1.E-06 1.E-04 1.E-02 1.E+00 1.E+02 aT*strain rate 21
  • 22.
    Comparison with Japanesemanufactures’ TF & VF Company Company Company Company Company A B C D E Circular Sample Shape Circular Rectangle Circular Cylinder - Corn Type Type Corn Type Type Sample Height (Nominal Height) 100mm 125mm 100mm 100mm - Preliminary Compression 10times 3times 10times 5times - Compression Interval in measuring TF 6 hours 3.5hours - 6 hours - -30℃ -20℃ 50℃ ↓ ↓ ↓ 50℃ Order of measurement 50℃ 50℃ -30℃ ↓ - ↓ ↓ -30℃ -30℃ 50℃ Performance Hard Soft - - Hard Mid Soft - (Rubber) Grade Max Difference between 0.03 0.06 0.09 0.02 0.04 0.03 0.06 0.02 TF and VF Glass Transition -41.9 -41.9 -45 -35 -32 -36 -38 -34 Temperature (℃) 22
  • 23.
    TF & VFfor each manufactures -1 (After convert to WLF formula) 2 2 Company A - Hard: aT converted to TF Company A - Soft: aT converted to TF Company A - Hard: VF Company A - Soft: VF 1.5 1.5 Reaction Force Rate Reaction Force Rate 1 1 0.5 0.5 1.E-03 1.E-01 1.E+01 1.E+03 1.E+05 1.E-03 1.E-01 1.E+01 1.E+03 1.E+05 aT×Strain Rate (%/sec) aT×Strain Rate(%/sec) 2 2 Company B: aT converted to TF Company C: aT converted to TF Company B: VF Company C: VF Reaction Force Rate 1.5 1.5 Reaction Force Rate 1 1 0.5 0.5 1.E-03 1.E-01 1.E+01 1.E+03 1.E+05 1.E-03 1.E-01 1.E+01 1.E+03 1.E+05 1.E+07 aT×Strain Rate(%/sec) aT×Strain Rate(%/sec) 23
  • 24.
    TF & VFfor each manufactures -2 (After convert to WLF formula) 2 2 Company D - Hard: aT converted Company D - Mid: aT converted to TF to TF Reaction Force Rate Reaction Force Rate 1.5 1.5 1 1 0.5 0.5 1.E-03 1.E-01 1.E+01 1.E+03 1.E+05 1.E-03 1.E-01 1.E+01 1.E+03 1.E+05 aT×Strain Rate (%/sec) aT×Strain Rate (%/sec) 2 2 Company D - Soft: aT converted to TF Company E: aT converted to TF Company D - Soft: VF Company E: VF Reaction Force Rate 1.5 Reaction Force Rate 1.5 1 1 0.5 0.5 1.E-03 1.E-01 1.E+01 1.E+03 1.E+05 1.E-03 1.E-01 1.E+01 1.E+03 1.E+05 aT×Strain Rate (%/sec) aT×Strain Rate (%/sec) 24
  • 25.
    2.0 1.5 Reaction Force Rate 1.0 Bridgestone Hard rubber compound TCF Bridgestone Soft rubber compound VCF Company Z TCF Company Z VCF 0.5 1.E-03 1.E-01 1.E+01 1.E+03 1.E+05 1.E+07 1.E+09 1.E+11 1.E+13 aT×v (%/sec) 25
  • 26.
  • 27.
    Conclusion of therelation between velocity and temperature • The velocity factor and temperature factor of fender reaction force are expressed as unity by WLF formula. Temperature- frequency reducibility can be applied to fender reaction force. • Temperature and speed factors of some companies can not be applied to WLF formula. They might make some mistakes in experiment or data handling. PIANC WG145 will define test procedure for temperature and speed factor in detail to avoid making wrong data. 27
  • 28.
  • 29.
    Berthing angle vs.Berthing velocity 29
  • 30.
  • 31.
    Container vessel shapeand flare angle Upper Column:Dimension Maersk Post Lower Column:Divided by Panamax E class Panamax dimension of No.3 No. 1 2 3 Length m 397.71 333.60 276.00 Length i /Length 3 1.44 1.21 1.00 Lpp m 376.00 316.30 260.80 Lpp i /Lpp 3 1.44 1.21 1.00 Width m 56.70 45.60 32.20 Width i /Width 3 1.76 1.42 1.00 Depth (from themain deck) m 30.00 27.20 21.00 Depth i /depth 3 1.43 1.30 1.00 Draught m 15.50 14.50 11.50 Draughti /Draught 3 1.35 1.26 1.00 DWT 156907.00 102351.00 63265.00 Figure 3 Fender elevation DWTi /DWT3 2.48 1.62 1.00 TEU 15500.00 9200.00 4100.00 TEUi /TEU3 3.78 2.24 1.00 Table 1 Container vessel dimensions No.1; Maersk E class No. 2; Post Panamax No.3; Panamax 31 Figure 2: Cross sectional views of No.1, No. 2 and No.3 vessels
  • 32.
    How to obtainflare angle 32
  • 33.
    Flare angle vs.Berthing Angle 33
  • 34.
    Hull radius inhorizontal plane 34
  • 35.
    Ratio of ParallelHull at Fender elevation in Port Y 35
  • 36.
    Conclusion in berthingangle • Actual berthing angles are rather small than design conditions. • In this study, flare angles are bigger three times than berthing angles in minimum. • In horizontal plane, the contact point of vessel hull to fender has big hull radius. Many fenders were installed on every 15 to 20m in container berth. Multiple fenders could absorb berthing energy. • Container vessel upsize rapidly and container vessel shape change greatly. The shape of the latest container vessel cannot be obtained. There may be a big difference in the present status with this study. 36
  • 37.
    THANK YOU FORYOUR ATTENTION! TAKK FOR DIN STØTTE TIL JAPAN JORDSKJELV OG TSUNAMI 2011. 37