MItigation Strategy Sample- Spanish Basque Country

Environmental problems (GHG effects, climate change, depletion of the ozone layer, loss of genetic diversity, air pollution, water pollution and others) are the result of human behaviour. (Gardner and Stern 2002). The consequences on the economy, society and health of climate change are one of the greatest threats that the world faces today, affecting even the survival of the human race (Tonn 2009). For the Basque Country, the main impacts forecasted for the last third of the century are an increase of temperatures of up to 7º, heavy changes in rainfall patterns and an inland movement of up to 13m in the coastline. This GHG emission reduction strategy (or mitigation strategy) is addressed to the key decision making authority in the Basque Country It has been made following the five-step approach recommended by Cities for Climate Protection (ICLEI n.d.).

Recommended
Recommended
More Related Content
What's hot
Viewers also liked
Viewers also liked (8)
Similar to MItigation Strategy Sample- Spanish Basque Country
Similar to MItigation Strategy Sample- Spanish Basque Country (20)
More from Alejo Etchart Ortiz
More from Alejo Etchart Ortiz (11)
Recently uploaded
Recently uploaded (20)
MItigation Strategy Sample- Spanish Basque Country
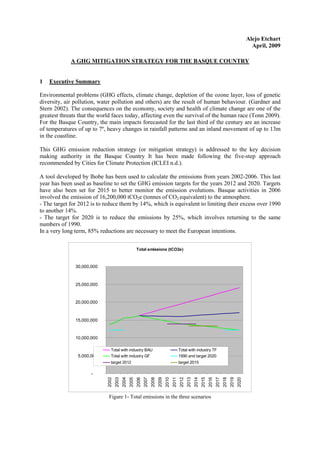
- 1. Alejo Etchart April, 2009 A GHG MITIGATION STRATEGY FOR THE BASQUE COUNTRY 1 Executive Summary Environmental problems (GHG effects, climate change, depletion of the ozone layer, loss of genetic diversity, air pollution, water pollution and others) are the result of human behaviour. (Gardner and Stern 2002). The consequences on the economy, society and health of climate change are one of the greatest threats that the world faces today, affecting even the survival of the human race (Tonn 2009). For the Basque Country, the main impacts forecasted for the last third of the century are an increase of temperatures of up to 7º, heavy changes in rainfall patterns and an inland movement of up to 13m in the coastline. This GHG emission reduction strategy (or mitigation strategy) is addressed to the key decision making authority in the Basque Country It has been made following the five-step approach recommended by Cities for Climate Protection (ICLEI n.d.). A tool developed by Ihobe has been used to calculate the emissions from years 2002-2006. This last year has been used as baseline to set the GHG emission targets for the years 2012 and 2020. Targets have also been set for 2015 to better monitor the emission evolutions. Basque activities in 2006 involved the emission of 16,200,000 tCO2e (tonnes of CO2 equivalent) to the atmosphere. - The target for 2012 is to reduce them by 14%, which is equivalent to limiting their excess over 1990 to another 14%. - The target for 2020 is to reduce the emissions by 25%, which involves returning to the same numbers of 1990. In a very long term, 85% reductions are necessary to meet the European intentions. Total emissions (tCO2e) 30,000,000 25,000,000 20,000,000 15,000,000 10,000,000 Total with industry BAU Total with industry TF 5,000,000 Total with industry GF 1990 and target 2020 target 2012 target 2015 - 2002 2003 2004 2005 2006 2007 2008 2009 2010 2011 2012 2013 2014 2015 2016 2017 2018 2019 2020 Figure 1- Total emissions in the three scenarios
- 2. 2 Three different scenarios have been assumed to define the patterns under which emissions take place during the period analyzed (up to 2020). Figure 1 shows the performance of the three scenarios overtime against the targets. - Business as usual (BAU): no new measures are adopted, and the emissions follow the increasing trend form the periods 2002-2006. As a result, emissions from 2006 grow by 21% and 49% in 2012 and 2020, respectively. - Technical fix (TF): mitigation solutions are implemented following existing best practices that have proved to be successful in other locations. Barriers arise that prevent the measures from achieving their maximum emissions reduction potential. As a result, emissions from 2006 decrease by 1.3% in 2012 and increase by 4.4% in 2020, due to the exhaustion of the measures’ influence power compared with the growing trend. - Green fix (GF): the solutions adopted for the TF scenario, as well as the ones, reach their reduction potential due to the non-existence of barriers. As a result, target reductions are met. The measures considered for the TF scenario affect the transport, residential, residues and industry sectors. They include a promotion of public transport and car sharing; infrastructure development for bicycles; improving the interchangeability between train, tram, underground and bus; dissuading the use of private motorized vehicles; reducing residential energy wastes; boosting buildings insulation; promoting the change to A-rated electric appliances; implementing the PAYT model for kerbside collection and developing the combined heat and power (CHP) technology potential. Also harnessing the potential of biomass as a fuel, land reforestation and implementation of renewable energies technologies (on-shore wind, PV’s, hydroelectric, geothermal, tidal), partly as foreseen within the industrial sector by the Basque Government, have been considered as net suppliers of emissions reductions in the TF scenario. Additional measures are included in the GF scenario: increasing energy efficiency in dwellings, favouring the installation of residential CHP plants; substituting primary for secondary prime materials in industries; implementing a packaging take-back model in industries; promoting the installation of solar technologies; and harnessing CO2 capture and storage technologies. In the GF the effects of all the measures, including the ones of the TF scenario, achieve their maximum reduction potential, due to the non-existence of barriers that prevented them from achieving it in the TF scenario. Nevertheless, this document does not intend to compile all the potential measures, and is open to the contributions that the region’s main stakeholders can make in order to get the emissions reductions allocated by sector in this strategy. A benchmark from other locations is given to serve as a reference for further mitigation measures. Partnerships with these stakeholders are fundamental to achieve the strategic objectives. A strong commitment from the parts is needed, as they will be responsible for succeeding in the goals they are assigned with. Three special partnerships, with industry representatives, with the group that can influence people’s consciousness raising, and with the one that can favour domestic implementations are identified. Work with partnerships should assess the feasibility of reaching the objectives through the measures proposed or the need to complement them in order to achieve the reduction targets. A public declaration about the threat from climate change is recommended as a first action to complement the public communication strategy. All marketing tools must work together to raise people’s awareness. The monitoring process starts once the measures are implemented. Some models to better estimate the measures impacts and set indicators to evaluate their evolution are proposed within this document. The evolution reporting, at least on a yearly basis, is fundamental to monitor the progress and eventually implement corrective or additional actions. Finally, although it is out of the specific scope of this strategy, brief comments are given to remark the importance of adopting an adaptation strategy in order to reduce the impacts of climate change.
- 3. 3 2 Introduction The Basque Country (BC) is an autonomous region in the north of Spain with an area of 7.234 km², and a density of 291 hab/km². It included three provinces whose capitals are Bilbao, San Sebastian and Vitoria. Per capital GNP was 30,600€ (Spanish second) in the first quarter of 2008 (Eustat 2009). Service (59%) and industrial (25%) sectors are their main activities. The BC has a heavy industrial background, but after the deep transformation underwent by 1980s, the service sector is now the largest contributor (59%) to the Basque GNP (ibid.). BC’s population in 1990 was 2,104,805 habitants; in 2006, it was 2,129,339 (+1%). Forecasts made in 2008 say that a gradual decrease will occur in next years, down to 2,110,205 in 2018 (El Correo 2009). Following a principle of prudence, no decrease will be considered in estimations. 3 Inventory 3.1. Emissions calculation tool. Data collection and omissions. Assumptions. A tool developed by the Basque environmental agency Ihobei has been used to calculate the emissions derived from the different sources and sectors. This tool is less powerful than others currently in use, as the one used to calculate emissions in the UK, developed by British Defrai. It lacks the possibility of creating yearly series or contemplating different scenarios in a single sheet, as well as of calculating individual emissions from different sub-regional origins or obtaining summarized graphs that would allow a quick and effective comprehension of the situation. Those possibilities are, nevertheless, covered by this document. Data have been gathered from a number of different sources that might have adopted different assumptions at the time they were processed. Data for the population and for the transport sector has been collected from the Basque institute of statistics (Eustat 2009), and the decomposition of the type of vehicles based on the fuels that they consume has been obtained by extrapolation from data supplied by the Spanish institute of statistics (INE 2009). The vehicles fuels’ share has been extrapolated to the BC from data in the Spanish tax agency (Agencia Tributaria 2009). The distribution of fuels in Spain in 2009 has been assumed to be valid for the BC in 2006. On the other side, as commented by Ihobe’s A.Goyarrola by email on 20th of April 2009, the emissions derived from the agricultural sector were not included in the inventory of the years 2002- 2006; but neither were they included in the estimation for 1990. Nevertheless, the specific weight of this sector in the Basque economy in 2006 was only 0.9% (Eustat 2009). Goyarrola also comments that the inventory of emissions saved by renewable energy (RE) is net from the pollution that their production eventually causes. The energy consumption by sector in the period 2002-2006 has been obtained from Eustat (2009); and the ranking of polluting companies in 2006, from the relevant Spanish registry (EPER 2009). The data of energy consumption by sectors comes from EVE (2009). The information that the Basque energetic mix results in emissions of 0.459 tonnes of carbon dioxide equivalent (tCo2e) per kWh is from Ihobe (2008). The data for residues have been obtained from the INE (2009), and their rate of conversion into tCO2e emissions, from Ihobe (2008). Apart from the specific assumptions that have previously been indicated and the ones that will be referred later on, two more have been made for the calculation of emissions in the inventory and scenarios. The Green Fix scenario has been assumed to provide 60% more reductions than the Technical Fix one, for each of the measures contemplated in this last. On the other side, 2015 has i No reference can be made to these tools. They will be made available upon request to alejoetc@gmail.com
- 4. 4 been considered to double the reductions of 2012 in general, and for 2020 a variable ratio over 2015 has been considered depending on the characteristics of each measure. 3.2. Emissions inventory calculation The baseline year considered in this strategy is 2006, for being the most recent year with enough data available. The application of the data gathered to the emissions calculation tool for the baseline year results in the emissions for the baseline year reflected in Table 1, classified by activity sector and emission source. Units in tCO2e Transport Residential Services Residues Industry TOTAL % Fuels cons. 2,819,891 989,724 418,610 4,228,226 25.70% Prime material cons. 2,457,316 2,457,316 15.00% Electricity cons. 2,583,674 3,053,433 - 3,818,571 9,455,678 57.60% Residues 279,640 279,640 1.70% SUBTOTAL 2,819,891 3,573,398 3,472,044 279,640 6,275,887 16,420,860 100.00% % 17.20% 21.80% 21.10% 1.70% 38.20% Net reductions from RE: 221,759 TOTAL NET EMISSIONS: 16,199,101 Table 1- Emissions summary 2006 Figure 2 and Figure 3 show the share of the emissions by source and use. The electricity consumption is by far the largest emitter, with almost 60% of the total. The source side shows a more balanced share, but pollution from industry is the highest (almost 40%). It is therefore clear that no significant reduction can be obtained without the participation of the industry, over which the Basque Government has, in principle, a lower influence power. Throughout this strategy, therefore, only the scenarios that consider the industrial sector will be presented. Emissions by source Emissions by use Fuels cons. Residues 1.7% Transport 17.2% 25.7% Industry 38.2% Electricity cons. Residential 21.8% Prime material 57.6% cons. 15.0% Residues 1.7% Agriculture and Services 21.1% Figure 2-Emissions by source 2006. Figure 3- Emissions by use 2006 4 Main impacts The last recognition of the impacts derived from the climate change (CC) that threaten BC are gathered in the Basque report of local sustainability (BG 2008). There are three major impacts foreseen for the last third of the century: - Increase of temperatures of 5-7º in winter and 3-4º in summer (2º less by the seaside). - A change in the rainfall pattern, with an increase of 5-20% in winter and a decrease of 15-20% in summer. - A rise in sea level by 0.4 cm/year, resulting in an inland movement of 11-13m in the coastline.
- 5. 5 Apart from the actions to be undertaken to mitigate the CC, measures are necessary to adapt to the consequences that it will cause. A brief comment of these actions is given in section 9. 5 Targets In 1990, the BC emitted 12,199,747 tCO2e to the atmosphere (Ihobe 2008). The Kyoto Protocol ascribed to the EU a reduction of 8% in emissions, as an average of the period 2008-2012, over the baseline year 1990. Due to its low rate of emissions per capita in comparison with the average of the Member States, Spain was allowed by the UE to exceed by 15% its numbers of 1990. The emissions in 2006 exceed the ones of 1990 by 32.8%. The effort to make is, therefore, huge; but we can and must succeed. In this strategy, targets are set over the emissions of 2006, with a double deadline: - 2012: In order to set an ambitious target improving the Spanish objective, this plan aims to limit the emission growth in 2012 to 14% over 1990 or to reduce them by 14.2% over 2006, which means that they must not exceed 13,900,000 tCO2e. - 2020: reduction of 25% over the emissions of 2006, which is equivalent to a return to the same level of emissions of 1990. It results in 12,145,000 tCO2e. Numbers for 2015 are given to monitor the progress towards the goal of 2020: a reduction of 18% over the emissions of 2006. It results in 13,280,000 tCO2e. In a very long term, the European Parliament (2008) called for a 80% emissions reduction in 2050 target over 1990. To be consistent with it, the Basque Country assumes the reduction of 85%, over 2006 that it involves (80% over 1990), as far as the time is sufficient to disregard the particularities for which a special treatment was given to Spain in the allocation of the target for 2012. 6 Scenarios and measures In order to calculate the current emission trends, the ones corresponding to the period 2002- 2006 have been calculated with a bottom-up approach, summing up the partial contribution of all relevant emission sources (DMU 2008b). The influence potential of the different measures contemplated in both the TF and the GF scenarios has been estimated starting from the following literature, referred to at the end of this strategy: BG (2002a) for measures in transport; BG (2005) for measures in energy; BG (2009) for measures in residues; EEPH (2009) for home insulation; IDEA (2009) for CHP and for correction of the estimations in BG (2005); Lükeville et al. (2000) for a general background; and the referred emissions calculation tool developed by Ihobe for adaptation of all the numbers of the given references to the Basque reality (energy mix, recycling rate, emissions from residues, transport average distances travelled, vehicles fuel consumption and detailed emissions). On the other side, numbers have been slightly adapted in order to achieve the target emission reductions. The feedback from the forthcoming years will determine the need of further actions to achieve the goals of this strategy. Assessment is needed from the partnerships on the feasibility of succeeding with the measures proposed or the need to complement them. 6.1. Business as usual (BAU) scenario In this scenario, the behaviour trend of the emissions followed in the period 2002-2006 remains. The measures that had already been implemented by 2006 are considered, but no further measures are performed. Details of the contributions of each sector and use by year 2002-2020, as well as the corresponding graphs, are provided in the appendix1. The total emissions for the
- 6. 6 target years are shown in Table 2, and the corresponding trend line can be seen in Figure 1 in the executive summary. Total GHG Over 1990 Over 2006 emissions 2006 16,199,101 2012 19,569,857 60% 21% 2015 21,255,236 74% 31% 2020 24,064,200 97% 49% Table 2- Total emissions 2002-2020 in tCO2e, BAU scenario. Estimations in red By 2012 emissions would grow to exceed the target by 40%, and by 2020, they would almost double the target. The need to take urgent action is evident. 6.2. Technical Fix (TF) scenario In this scenario, some solutions to improve energy efficiency and reduce consumption in the short term are implemented, following already existing best practices that have proved to be successful in other locations. Nevertheless, social and technological barriers prevent the measures implemented from reaching their full potential. The use of RE technologies that was contemplated in the ‘3E2010’ strategy (BG2005) is also considered, but the targets forecasted in that strategy are considered to be met only at 50%. Some of the solutions to implement in this scenario are already under development, like part of the ones commented by the Basque plan for residues in the primary sector (2009), the Basque energy strategy ‘3E2010’ (BG 2005), the Basque plan for sustainable transport (BG 2002a) and the Basque strategy for sustainable development (BG 2002b). The calculations for the emissions reductions are shown in the appendix2 for the years 2012 and 2020. The mitigation percentages that every measure is assumed to give is also shown. Measures TRANSPORT - Promoting public transport use and optimization of the service, extending the underground to new nearby villages Amorebieta and Galdácano, forecasted for 2012 (BG 2002a). Ref: 1 - Encouraging car sharing through traffic lanes for exclusive use by multi-occupied cars and other measures. Ref: 2 - Developing infrastructures in cities for bicycles lanes, hiring and parking spaces, following the good benchmark from San Sebastian in other Basque capitals and major towns. Ref: 3 - Improving the interchangeability between train, tram, underground and bus. Ref: 4 - Dissuading private motorized vehicles use inside the cities through taxes for driving within the city and parking areas in the surroundings, with adequate public transport to the town. Ref: 5 RESIDENTIAL - Reducing energy wastes (switching off the lights when they are not needed; unplugging or switching off the appliances, computers or mobile telephone chargers not in use; avoiding the standby in electrical appliances; heating only the water needed in a kettle; using the oven and the hook in a sound way; using the clothes or dish washing machines only when they are fully loaded; lowering the thermostats; and many other apparently minor behaviours). An awareness raising campaign is necessary to obtain people’s active participation in the challenge to mitigate CC. Ref: 6
- 7. 7 - Financing lofts and cavity walls insulation as cost effective way to reduce energy consumption and CO2 emissions. A good benchmark can be gained from the UK (UKHI 2009) and Ireland (SEI 2009), which have recently launched programs to promote home insulations. Ref: 7 - Promoting the change of inefficient electric appliances into A-rated electric ones, including low energy bulbs. Ref: 8 RESIDUES - Implementing an effective policy of separate kerbside collection system following the pay-as- you-throw (PAYT) model, to achieve lower rates of waste sent into landfill, higher quantities, high quality recycling input materials and an optimization of the products’ packaging. This model has been successfully implemented in many European countries and USA states, increasing up to four fold the amounts sent to recycling and half the wastes sent into landfill (Reichenbach 2008; Nakajima and Vanderburg 2006). The effects of this measure are not considered to be significant until the last years of the period analyzed. Ref: 9 INDUSTRY - Developing the Combined Heat and Power (CHP) potential, as favoured by the Spanish Government (BOE 2007). The ‘3E2010’ (BG 2005) foresaw that, with the necessary changes in regulation, 514 MW could be achieved, which meant doubling the existing capacity. This new capacity can be either built in the same industries where it will be consumed, or in industrial parks to be shared by several industries. The 3E2010 favoured gas turbine CHP plants. These, as well as the steam turbine, are more adequate for large capacities. For smaller plants, that will often occur in a decentralized scheme, the internal combustion engine plants, which have largely improved technologically in the last years, are a more feasible solution (Smith 2008). Ref: 10 NET REDUCTIONS OF GHG EMISSIONS AGRICULTURE In this strategy, agriculture is treated as a net GHG reduction provider, though two measures: - Harnessing of forestry biomass through wooden pellets production for fuels for CHP plants to be used by industries and buildings (BG 2009). Ref: 13 - Land reforestation in 2,000 ha by 2012 in order to achieve the absorption of total 1,700,000 tCO2e (BG 2002b). Ref: 14 RENEWABLE ENERGIES The ‘3E2010’ (BG 2005) anticipated the goals to achieve through RE technologies for 2012. In the TF scenario, only half of the objective numbers are considered to be met, due to potential technological and social barriers. These are the measures and the objectives in the 3E2010: - Deploying on-shore wind turbines with a capacity of 514MW installed power. Ref: 15 - Strengthening solar photovoltaic energy generation within industries, to 10.7MW installed power. Ref: 16 - Supporting hydroelectric energy generation to reach 175MW installed power. Ref: 17 - Investing in the newest RE technologies (off-shore wind and geothermal), to reach 5MW installed power. Ref: 18 - Harnessing tidal flows as with the site being constructed in Mutriku (EVE 2009), under the Biscay Marine Energy Platform. This platform has 480 kW installed power and will be fully operative in 2012. This scenario contemplates two more for 2015 and other two for 2020. Ref.23
- 8. 8 The result of the measures implemented for the target years is shown in Table 3. Details of the contributions of each sector and use by year 2002-2020 are provided in appendix3. Total GHG emissions Over 1990 Over 2006 2006 16,199,101 2012 15,985,522 31% -1.3% 2015 16,534,853 35.6% +2.1% 2020 16,908,402 38.6% 4.4% Table 3- Total emissions in the TF scenario, in tCO2e. Estimations in red. It can be seen that, even though some mitigation is achieved, it is still far from the objectives. The objective for 2012 is exceeded by 15%, and the one for 2020 by 40%. 6.3. Green Fix (GF) scenario In this scenario, stronger reductions are achieved, particularly through a deeper penetration of RE technologies, which meet the objectives set by the ‘3E2010’ strategy (BG2005). The rest of the measures contemplated in the TF also have a higher influence, due to the non-existence of technical o social barriers. On the other side, new measures, not included in the TF scenario, contribute to mitigate CC in the GF scenario. The calculations and the assumed reductions are shown in the appendix4 for 2012 and 2020. The appendix5 shows the contribution by use of each sector to the total emissions. Additional measures RESIDENTIAL - Boosting an energy efficiency improvement in dwellings, by implementing a housing energy efficiency rating and setting targets. With this rating, London’s energy plan (ML 2004) could set ambitious objectives for energy efficiency in domestic buildings. Ref: 19 - Promoting the installation of panels for harnessing the sunlight through thermal and photovoltaic technologies. Ref: 20 - Favouring the implementation of CHP plants for obtaining energy for single buildings or larger communities. Heat distribution nets have been built in Scandinavia of tens of kilometres (RCEP 2000). Ref: 21 INDUSTRIAL - Substitution of primary for secondary raw materials (recycled) with low carbon content, particularly white slag, from 77,000 Tm in 2005 to 105,000 in 2012, described as ideal in the ‘3E2010’ (BG 2005). Ref: 11 - Implementing a packaging take-back model, to force manufacturers and distributors to take used packaging back with no charge to consumers, and to forward it for reusing or recycling, following the model of the German Packaging Ordinance (GPO). The GPO aims to make the Extended Producer Responsibility (OECD 2001) more complete, shifting away from the traditional mentality whereby industry simply produces waste and expects local authorities to get rid of it (Baker and McKenzie 2008; DSD 2009). It acts as an incentive for manufacturers to reduce the amount and improve the design of product packaging. This measure is a good complement of the PAYT scheme described for residues. It does not achieve its potential until the last years of the period. Ref: 12 ENERGY
- 9. 9 - Implementing carbon available carbon capture technologies in large energy production facilities, and injecting it afterwards in the deposits from where natural gas has been being extracted historically (e.g. Gaviota and Albatros oil sea platforms). Both the capturing and the injecting technologies are well known (RCEP 2000). Ref: 22 As a result, emissions get reduced to the following values along the period (Table 4) Total GHG emissions Over 1990 Over 2006 2006 16,199,101 2012 13,875,522 13.7% -14.3% 2015 13,529,748 9.2% -17.7% 2020 12,145,551 -0.4% -25% Table 4- Total emissions in the GF scenario, in tCO2e. Estimations in red. In this scenario, the targets settled are finally met. 6.4. Other benchmarks The challenge to mitigate CC is huge, but it must be tackled. No effort must be saved to achieve the objectives of this strategy and surpass them possible. For the case that the measures proposed were insufficient to achieve the goals, some cases are briefly introduced of communities that have made great progress or developed ambitious strategies: - Denmark and Cuba suffered with a special intensity the scarcity of energy (Bermejo 2008). They reacted with urgent shock plans to reduce energy consumption in transport and buildings, boosting the energy efficiency and installing renewable energy technologies. Denmark maintains the same level of energy consumption of 30 years ago, while its GNP has doubled (ibid.). Cuba is the only country in the world that meets the minimum requirements for sustainable development (WWF 2006). - San Francisco (SFCC 2006) acknowledged that public administration was necessary at all levels to tackle a potential social and economic chaos. An energy supplying company was created to generate the energy consumed by its citizenry. The city has one of the best public transport systems in the USA (Forbes 2008), that can be seen in SFMTA (2009) website. - Queensland (QOVT 2007), Portland (PCC 2007), Oakland (OCC 2008) and California (2003) can provide valuable benchmarks about the processes they have followed to set targets from 40 to 100% CO2e emissions reduction for 2020-2030 over 200-2007, by reducing oil consumption, increasing energy efficiency, reducing energy wastes, boosting public transport, developing RE, pressing car manufacturers to move green and producing food locally. - Leicester (LCC 2002) provides relevant benchmark for energy efficiency measures within built environment for the promotion of high efficiency condensing boilers, building energy management systems, district heating CHP installations and city owned facilities energy management. 7 Implementation 7.1. Partnerships The Basque Government cannot guarantee alone the success of this strategy, without the help of other key players that have a major role in the emissions or in the formation of the public opinion. The participation of the country’s stakeholders, including key officers from the local authority, local businesses and industries, media, churches, education, youth, interested citizens and environmental NGOs, among others, is fundamental to meet the mitigation target. The
- 10. 10 involvement of all the political parties would be particularly important in order to take the strategy out off the political arena. The stakeholders must be involved in the definition of the specific strategies to achieve the objectives of the strategy, as well as its implementation and monitoring, through different partnerships created for the various potential purposes. Partnerships gain special relevance within the fields where the Basque Government does not have enough decision making power. Responsibilities for each partnership must be defined. The leaders of every partnership and of the whole strategy must be determined, keeping in mind that a strong leadership is key to success (ML 2004). It must be ensured that all members of the partnership maintain a strong commitment towards mitigation and regularly report progress to achieve the agreed targets. Three partnerships are considered of especial relevance: - With the industrial sector. Industries emitted 38% of the total CO2e in 2006. Mitigation targets cannot be met without their complete participation to assess the measures and targets contemplated in this strategy, propose additional or alternative policies to reach the objectives, implement effectively these actions and monitor their evolution. A higher sense of corporate responsibility must be promoted for them to assume the need to change (Ihobe 2008). Economic incentives to favour sustainable materials consumption and energetic processes are complementary to that sense of responsibility. EPER (2009) identifies the activities and companies that produce the largest emissions. Cement manufacturing alone stands for a 39% of the pollution from industries, and steel castings with a 24% (Codes 3.1 and 2.2 in the table in appendix6. Cementos Rezola and Lemona Industrial in code 3.1; and Arcelor Mittal, Sidenor, CAF and GSB in code 2.2 are the largest polluters. They must get involved in the strategy by taking part in the partnership. - With the media and the schools association, among others that can influence people’s opinion, to raise Basque people’s awareness about the certainty and the consequences of the CC. Only through this can the reductions take place. Individuals take all the decisions that cause human’s polluting emissions; therefore, not only they are directly involved with the emissions classified as ‘residential’, but also in all the other sectors. The concern about CC in the BC is far from being the necessary to change the path towards disastrous consequences (Ihobe 2008). - With the Basque city councils association Eudel and representatives of neighbourhood associations to boost the implementation of measures within the residential sector. 7.2. Communication Apart from the partnership commented above, authorities must take active part in communicating the problem. A public declaration about its seriousness will significantly contribute to raise people’s aweareness. The Transition Towns (2009) and Post Carbon Cities (2009) movements give good benchmarks of actions to promote sustainable communities by raising consciousness, creating local farming markets, promoting the permaculture, installing small scale RE, creating pedestrian ways in the cities, promoting the use of public transportation and educating on sustainability. Other initiatives, like an eco-house (GLL 2009), workshops, demonstrations, conferences and all kinds of events, as well as selling environmental friendly products, must be considered. All the above are ways, not only to reduce emissions, but, more important, to raise people’s consciousness. All the marketing tools must work together to make an effective communication of the importance of tackling the CC with the efforts of all the individuals in the community.
- 11. 11 Even though it is recognized the CC problems are caused by human behaviour, the use of the science of human behaviour to tackle them is not habitually used. Psychology and sociology are necessary to understand and influence the population’s behaviours (Gardner and Stern 2002). 7.3. Financing Several options exist for financing this mitigation strategy. A previous cost evaluation from the measures to implement is needed in order to select financing sources. Some of them are: - Using existing budgets, reviewing the way in which public resources are currently being spent for including sustainability criteria as a requisite to finance aids or allocate dealerships. - Levying polluting practices, specially increasing the taxes on the consumption of fossil fuels for motorized transport, on highway tolls and on the excessive electricity consumption in buildings. These levies constitute self-financing further measures to mitigate CC themselves. This is also the case of other measures proposed in this strategy, as the implementation of a PAYT scheme for residues and the taxes for the use of private cars in cities. - Involving financial institutions for development projects that may open new business lines to them, as in the cases of financing insulation activities, implementing CHP schemes or installing RE technologies. - Applying for funding from national governments, the EU or other institutions specialized in the case. This specially regards pilot projects or innovative developments. In any case, the most effective way of financing mitigation strategies is to raise people’s consciousness to assume the need to change (DMU 2008c). 8 Monitoring Feedback on the results of the measures implementation is a crucial part of the strategy. Monitoring GHG emissions at lower-than-national levels is not straightforward (DMU 2008c), but sustainable development may be sidelined if there is no responsibility allocated for this task and for calling the relevant bodies and partnerships to account. This role must be assumed by the Basque Government. A number of models are used in the UK to estimate the impact for some individual measures that can serve as a benchmark for the BC. The most appropriate ones for the UK are MDM3, SAFIRE and CCP (Entec 2003). The Basque authority (CES 2007) emphasizes the need to develop a set of indicators that allow the monitoring of progress to sustainable development. The Spanish sustainability watcher office (OSE) elaborates a series of indicators that serve to monitor the performance in sustainability, reported on a yearly basis since 2005. The total number of indicators used for 2007 report was 155 (OSE 2008). The UK uses a number of indicators grouped under six categories (Defra 2003). Sweden (Statistics Sweden 2001) classifies their indicators under four utility criteria, the most remarkable being the ones to measure efficiency, either economic, social or environmental. Germany (SBD 2008) developed their indicators recently, using a single one for each of the twenty-one objectives in their strategy. All these references can be used as benchmarks, but, in any case, it must be considered that consistency with data collection is critical to the use of any assessment methodology (Entec 2003). Monitoring must begin as soon as measures are implemented, and continue for the rest of their lives, providing a fundamental feedback that can be used to improve the measures overtime (DMU 2008b). One yearly report should be given by the authorities and partnerships responsible for each action or group of actions, in order to monitor the emissions evolution and the need to implement complementary or corrective actions.
- 12. 12 9 Adaptation The main impacts referred in point 4 may cause a number of fatal consequences that will affect seriously all the spheres of life, covering the primary, secondary and tertiary economic sectors; human and non-human life, as well as resources availability; the interior lands and the coastline; health, infrastructures, hydrological resources and most other fields of life. This document is focused in the CC mitigation, rather than in the adaptation to its consequences. Following a further research about the consequences in the BC, a full strategy must be created and implemented to reduce the foreseen impacts before it is too late. Nevertheless, some lines of action are: - Increasing the learning of the effects of CC on ecosystems, and implementing measures to protect the most essential ones for human life; and developing programs of monitoring and early alerting of the changes in ecosystems. - Creating systems for an early alert of extreme weather events, as well as evacuation plans and reaction strategies. - Promoting the use of alternative systems to collect and treat rainfall water. - Removing strategic installations from the coastline and from areas sensible to floods and strong winds. - Reinforcing walls and dikes to prevent floods. - Improving the drainage and maintenance systems in urban areas. - Hindering new domestic developments in areas that are susceptible to the effects of CC. - Planning the construction of emergency installations to temporarily accommodate large numbers of people, including emergency health systems. - Improving the current water distribution net to prevent it from the current massive losses (El País 2007) 10 Conclusions Only through a full achievement of the mitigation potential of the measures given in this strategy and others that could complement them, can the future emissions reach the targets desired. This means that the potential barriers that might arise in future must be anticipated and overcome, for which the full cooperation of the partnerships with regional opinion influencing stakeholders is vital. Also, the partnership with industries has fundamental importance to get the maximum potential mitigation from the measures proposed and to suggest others that could complement them. An effective communication strategy not only includes press reports and advertisements, but also a public declaration about the seriousness of the CC problem and a number of initiatives to promote energy efficiency and savings. Several financing options are available, but the most effective of all is to favour pro-environmental behaviours in institutions and citizenry. Monitoring standards must be set to follow up the evolution of the measures implemented in order to control the progress and eventually implement corrective or additional actions. An adaptation strategy is needed to complement this mitigation one, in order to anticipate Basque responses to the changes that, independently of the mitigation results achieved, will certainly occur.
- 13. 13 REFERENCES Citations and references are given following the Harvard system of referencing (DMU 2008b) AGENCIA TRIBUTARIA (2009) Matriculación de vehísulos por tipo de combustible 2009 [WWW] Available from http://www.agenciatributaria.es [Accessed 10/03/09] BAKER and McKENZIE (2008) The New German Packaging Ordinance. [WWW] Available from http://www.bakernet.com/NR/rdonlyres/49616136-80D5-4315-A118- 89A759A5BDBB/0/germany_germanpackaging_news_summer08.PDF [Accessed 17/04/09] BG- BASQUE GOVERNMENT (2002a) Plan director de transporte sostenible 2002-2012. Vitoria: Servicio Central de Publicaciones del Gobierno Vasco. Available from : http://www.ets-rfv.es/web_ets/docs/Plan_Director_Transp_1.pdf [Accessed 16/04/09] BG- BASQUE GOVERNMENT (2002b) Estrategia ambiental vasca de desarrollo sostenible. Bilbao: Ihobe. Available from: http://www.ingurumena.ejgv.euskadi.net/r49- 5832/es/contenidos/plan_programa_proyecto/eavds_pma/es_9688/adjuntos/pma0206.pdf [Accessed 17/04/09] BG- BASQUE GOVERNMENT (2005) Estrategia energética de Euskadi 2010. Hacia un desarrollo sostenible. Vitoria: Servicio Central de Publicaciones del Gobierno Vasco. Available from http://www.eve.es/jornadas/estrategia_3e2010.asp [Accessed 16/04/09] BG- BASQUE GOVERNMENT (2009) Plan de prevención y gestión de residuos peligrosos 2008-2011 [WWW] Available from http://www.ingurumena.ejgv.euskadi.net/r49- 4892/es/contenidos/plan_programa_proyecto/plan_residuos_peligrosos/es_10758/indice.html BERMEJO, R. (2008) Un futuro sin petróleo. Colapsos y transformaciones socioeconómicas. Madrid: Los libros de la Catarata. BOE (Spanish official state gazette) (2007),“RD616/2007 s/ fomento de la cogeneración”, p.5 CALIFORNIA (2003) Energy Action Plan. San Francisco: SOC. Available from: http://www.energy.ca.gov/energy_action_plan/2003-05-08_ACTION_PLAN.PDF [Accessed 16/04/09] CES- COMITÉ ECONÓMICO Y SOCIAL VASCO (2007) El desarrollo sostenible, reto de las políticas públicas. Bilbao: CES. Available from: http://www.cesvasco.es/LinkClick.aspx?link=Estudios_Informes_ES%2fDesarrollo+sostenibl e.pdf&tabid=92&mid=564 [Accessed 22/04/09] DEFRA (2003) Indicators of the climate change in the UK. [WWW] Available from http://www.ecn.ac.uk/iccuk/ [Accessed 22/04/09] DMU- De Montfort University (2008a), The Harvard system of referencing. Department of library services, DMU. Leicester: DMU. DMU (2008b) MSc climate change and sustainable development. Integrated environmental strategies module., Lesson 3.2- Tools for Guiding a Carbon Strategy. Leicester: DMU. DMU (2008c) MSc climate change and sustainable development. Integrated environmental strategies module., Lesson 3.1- Developing a GHG emissions strategy. Leicester: DMU. DSD- Dual System Deutschland (2009), The Amendment to the Packaging Ordinance. [WWW] Dual System Deutschland. Available from: http://www.gruener-punkt.de/en/customer- infoservice/dual-system-for-sales-packaging/information-for-new-customers/the-amendment- to-the-packaging-ordinance.html [Accessed 21/02/09] EL CORREO (2009) Euskadi perderá el 1,3% de su población hasta 2018. [WWW] Available from: http://www.elcorreodigital.com/vizcaya/20090121/mas- actualidad/sociedad/euskadi-perdera-poblacion-hasta-200901211238.html EL PAÍS (2007), Bilbao pierde el 23% de su agua por fugas en la red de abastecimiento. [WWW] Available from http://www.elpais.com/articulo/pais/vasco/Bilbao/pierde/23/agua/fugas/red/abastecimiento/elp epuesppvs/20070221elpvas_13/Tes [Accessed 03/02/09] ENTEC (2003) dCARB-uk: Evaluation Procedures for Area-Based Carbon Emissions Reduction. Warwichshire: Entec UK Limited.
- 14. 14 EUROPEAN PARLIAMENT (2008) 2050: The future begins today – Recommendations for the EU's future integrated policy on climate change (2008/2105(INI)). Brussels: EP. EPER (2009) Registro Estatal de Empresas Contaminantes [WWW] Available from http://www.eper- es.es/Consultas/FacilityLevel.asp?Order=&Begin=0&CCAA=16&act=&cat=&search=&susta ncia=0&ReportedYear=2006&TipoVertido=A&index= [Accessed 15/05/09] EUSTAT (2009), Instituto Vasco de Estadística [WWW] Available from http://www.eustat.es/idioma_c/ci_ci/indice.html [Accessed 15/05/09] EVE (2009) Ente vasco de la energía [WWW] Available from http://eve.es/index_hc.asp [Accessed 15/05/09] FORBES (2008) Best and worst cities for commuters. [WWW] Available from: http://www.forbes.com/2008/04/24/cities-commute-fuel-forbeslife- cx_mw_0424realestate.html [Accessed 09/04/09] GARDNER, G. AND STERN, P. (2002) Environmental Problems and Human Behaviour. New York: Allyn and Bacon. GLL- GROUNDWORK LEICESTER & LEICESTERSHIRE (2009) Incorporating environ. [WWW] Available from: http://www.gwll.org.uk/ [Accessed 21/04/09] ICLEI (n.d.) ICLEI global programs. [WWW] Available from: http://www.iclei.org/index.php?id=810 [Acccessed 12/03/09] IHOBE (2008) Informe de sostenibilidad de la CAPV 2008. Bilbao: Ihobe. Available from http://www.udalsarea21.net/ [Accessed 16/03/09] INE (2009) Instituto Nacional de Estadística [WWW] Available from http://www.ine.es/ [Accessed 15/05/09] LCC- LEICESTER CITY COUNCIL (2002) Energy efficiency & renewable energy in new developments. [WWW] Available from: http://www.leicester.gov.uk/endev/spg/EnergyEfficiency.pdf [Accessed 22/04/09] ML- MAYOR OF LONDON (2004), “Green light to clean power”. London: Greater London Authority NAKAJIMA, N and VANDERBURG, W.H. (2006), A Description and Analysis of the German Packaging Take-Back System, Bulletin of Science, Technology & Society 26, pp.510-518 OCC- OAKLAND CITY COUNCIL (2008) Oil independent Oakland action plan. Oakland: OCC OECD (2001). Extended Producer Responsibility: A Guidance Manual for Governments. Paris: OECD. OSE- OBSERVATORIO ESPAÑOL PARA LA SUSTANIBILIDAD (2008), “Sustainability in Spain 2007 Integrated Assessment” [WWW] Available from: http://www.sostenibilidad- es.org/NR/rdonlyres/F75A1E1F-661E-4F0B-B161-6AB010854EA1/2952/EIinglesenlinea.pdf [Accessed 03/11/08] PCC- PORTLAND CITY COUNCIL (2007) Report of the city of Portland. Portland : PCC. POST CARBON CITIES (2009) Planning for energy and carbon uncertainty. [WWW] Post Carbon Institute. Available from http://postcarboncities.net/ [Accessed 09/04/09] QOVT- Queensland’s Oil Vulnerability Taskforce (2007), Queensland’s vulnerability to rising oil prices report. Brisbane: McNamara. RCEP (ROYAL COMMISSION ON ENVIRONMENTAL POLLUTION) (2000), Energy: The Changing Climate, HMSO. [WWW] Available from: http://www.rcep.org.uk/newenergy.htm [Accessed 18/05/09] REICHENBACH, J (2008), Status and prospects of pay-as-you-throw in Europe, Waste Management 28, pp.2809-2814 SBD- STATISCHES BUNDESAMT (2008) Nachhaltige entwicklungin Deutschland. Wiesbaden : Statistisches Bundesamt. Available from: http://www.destatis.de/jetspeed/portal/cms/Sites/destatis/Internet/DE/Content/Publikationen/F achveroeffentlichungen/UmweltoekonomischeGesamtrechnungen/Indikatorenbericht2008,pro perty=file.pdf [Accessed 23/04/09]
- 15. 15 SEI- SUSTAINABLE ENERGY IRELAND (2009) Home energy saving scheme. [WWW] National Development Plan. Available from http://www.sei.ie/Grants/Home_Energy_Saving_Scheme/ [Accessed 09/04/09] SFCC- SAN FRANCISCO CITY COUNCIL (2006) Resolution acknowledging the challenge of peak oil. San Francisco : SFCC. SFMTA (2009) San Francisco municipal transport agency. [WWW] Available from: http://www.sfmta.com/cms/home/sfmta.php [Accessed 09/04/09] SMITH, M. (2008), DMU MSc CC&SD, Energy Analysis Techniques module, CHP and the Climate Change Levy. Leicester: DMU. STATISTICS SWEEDEN- MINISTERY OF THE ENVIRONMENT (2001) Sustainable development indicators for Sweden. Stockholm: Ministry of the Environment. Available from: http://www.scb.se/statistik/MI/MI1103/2003M00/Preface1to52.pdf [Accessed 22/04/09] TRANSITION TOWNS (2009) What is a transition town [WWW] Available from: http://www.transitiontowns.org/ [Accessed 16/04/09] TONN, B.E. (2009) Obligations to future generations and acceptable risks of human extinction. Futures. Article in Press, LFTR-1361, 9 pages. Available from: http://www.sciencedirect.com/science?_ob=ArticleURL&_udi=B6V65-4VJ4WVJ- 1&_user=7624736&_rdoc=1&_fmt=&_orig=search&_sort=d&view=c&_acct=C000039118& _version=1&_urlVersion=0&_userid=7624736&md5=0eca5af26a40c1683a367b1f91721d15 [Accessed 22/04/09] UKHI- UK INSULATION PROGRAM (2009) UK home insulation. [WWW] Available from: http://www.ukhomeinsulation.co.uk/ [Accessed 16/04/09] WWF (2006) Living planet report 2006. WWF: Gland (Switzerland). Available from: http://assets.panda.org/downloads/living_planet_report.pdf [Accessed 16/04/09]
- 16. APPENDIX- Calculation tables and graphes 1 Set of tables and figures for the BAU scenario Estimations in red. Transport Resident. Services 2,306,717 799,884 406,584 2,438,906 947,633 400,571 2,722,553 1,042,983 446,958 Fuel consumption (tCO2e) 2,953,533 1,092,805 461,561 Fuels consumption BAU (t CO2e) Transport Residential 2,819,891 989,724 418,610 Agriculture and Services Lineal (Transport) 2,979,185 1,049,387 427,281 Lineal (Residential) 6,000,000 Lineal (Agriculture and Services) 3,138,478 1,109,049 435,952 5,000,000 3,297,772 1,168,712 444,622 3,457,065 1,228,374 453,293 4,000,000 3,616,359 1,288,037 461,964 3,775,652 1,347,699 470,635 3,000,000 3,934,946 1,407,362 479,305 2,000,000 4,094,239 1,467,025 487,976 4,253,533 1,526,687 496,647 1,000,000 4,412,826 1,586,350 505,317 - 4,572,120 1,646,012 513,988 02 04 06 08 10 12 14 16 18 20 4,731,413 1,705,675 522,659 20 20 20 20 20 20 20 20 20 20 4,890,707 1,765,337 531,329 5,050,000 1,825,000 540,000 Industry 2002 2,154,865 Prim e m aterial consum ption (tCO2e) 2003 2,214,073 Prime material consumption BAU (t CO2e) 2004 2,215,964 Prime material consumption BAU (t CO2e) 2005 1,989,760 Lineal (Prime material consumption BAU (t CO2e) ) 2006 2,457,316 2007 2,479,650 3,000,000 2008 2,501,985 2009 2,524,319 2,500,000 2010 2,546,654 2,000,000 2011 2,568,989 2012 2,591,323 1,500,000 2013 2,613,658 2014 2,635,992 1,000,000 2015 2,658,327 2016 2,680,662 500,000 2017 2,702,996 2018 2,725,331 - 2019 2,747,665 02 04 06 08 10 12 14 16 18 20 20 20 20 20 20 20 20 20 20 20 2020 2,770,000
- 17. 17 Residential Services Industry 2,321,036 2,470,505 3,215,144 2,312,495 2,625,312 3,494,722 2,487,587 2,829,230 3,745,260 Electricity consumption BAU (t CO2e) 2,551,645 2,935,994 3,615,720 2,583,674 3,053,433 3,818,571 2,662,698 3,203,188 3,901,530 Electricity consum ption (tCO2e) 2,741,721 3,352,943 3,984,489 2,820,744 3,502,698 4,067,449 6,000,000 2,899,767 3,652,452 4,150,408 5,000,000 2,978,791 3,802,207 4,233,367 3,057,814 3,951,962 4,316,326 4,000,000 3,136,837 4,101,717 4,399,285 3,000,000 m 3,215,860 4,251,471 4,482,245 Residential Services 3,294,884 4,401,226 4,565,204 2,000,000 Industry 3,373,907 4,550,981 4,648,163 1,000,000 3,452,930 4,700,736 4,731,122 3,531,953 4,850,490 4,814,082 - 3,610,977 5,000,245 4,897,041 02 04 06 08 10 12 14 16 18 20 20 20 20 20 20 20 20 20 20 20 3,690,000 5,150,000 4,980,000 2002 218,444 Reduction from renewable energy, sinks & fuels TF (t R e d u c t i o n s ( t C O2 e ) 2003 218,444 2004 220,650 2005 221,759 Reduction from renew able energy, sinks & fuels BAU (t CO2e) 2006 221,759 2007 711,525 Lineal (Reduction from renew able energy, sinks & fuels BAU (t 2008 1,201,290 CO2e)) 2009 1,691,056 240,000 2010 2,180,821 235,000 2011 2,670,587 CO2e) 2012 3,160,352 230,000 2013 3,304,609 225,000 2014 3,448,866 220,000 2015 3,593,122 2016 3,783,501 215,000 2017 3,973,879 210,000 2018 4,164,258 2019 4,354,636 205,000 2020 4,545,014
- 18. 18 2002 279,640 2003 274,646 2004 277,143 2005 284,633 Residues production BAU (t CO2e) tCO2e from residues 2006 279,640 2007 280,751 300,000 2008 281,863 295,000 2009 282,974 290,000 2010 284,086 2011 285,197 285,000 2012 286,309 280,000 2013 287,420 275,000 2014 288,531 2015 289,643 270,000 2016 290,754 265,000 2017 291,866 260,000 2018 292,977 02 04 06 08 10 12 14 16 18 20 2019 294,089 20 20 20 20 20 20 20 20 20 20 2020 295,200
- 19. 19 2 Calculation of emissions in the TF scenario for the years 2012 and 2020, including the numbers from 2006. Orange and blue backgrounds serve to identify the base for the application of the assumed emission reduction percentages. Net emission reductions are in red characters. 2006 2012 2020 Measure Ref. Base Base & % Base & % TRANSPORT Fuels cons. 2,819,891 3,775,652 5,050,000 1 2.00% 4.40% 2 0.50% 2.00% 3 0.40% 5.20% 3,579,318 1.60% 13.60% 4,363,200 4 0.30% 1.20% 5 2.00% 4.40% RESIDENTIAL Fuels cons. 989,724 1,347,699 1,347,699 1,825,000 1,825,000 Electricity cons. 2,583,674 3,057,814 3,690,000 6 2.00% 8.00% 7 2.00% 6.50% 2,859,056 8.00% 22.00% 2,878,200 8 2.50% 6.00% 19 20 21 1% 1% 44,055 12% 12% 661,800 SERVICES Fuels cons. 418,610 470,635 470,635 540,000 540,000 Electricity cons. 3,053,433 3,951,962 3,951,962 5,150,000 5,150,000 RESIDUES 279,640 286,309 295,200 9 0.75% 0.75% 284,161 7.04% 7.04% 274,411 INDUSTRY Electricity cons. 3,818,571 4,316,326 4,980,000 Prime mat. cons. 2,457,316 2,591,323 2,770,000 10 3.00% 3.00% 4,186,836 12.00% 12.00% 4,382,400 11 2,591,323 2,770,000 12 TOTAL GROSS EMISS. 16,420,860 19,270,991 22,183,211 AGRICULTURE (reductions) 8,721,840 10,495,000 224,811 232,948 13 0.40% 0.40% -34,887 1.60% 1.60% -167,920 14 -1,700,000 -2,210,000 RENEWABLE ENERGIES (net reductions) 221,759 8,721,840 10,495,000 Planned 3E2010 -221,759 Half the planned -1,416,743 Half the planned -2,466,789 15 16 17 18 Others 22 - 97,986.00 - 257,355.00 23 - 965.00 - 4,825.00 TOTAL REDUCTIONS - 221,759 - 3,250,581 - 5,106,889 TOTAL 16,199,101 15,985,522 16,908,402
- 20. 20 3 Set of tables for the TF scenario for the target years. Estimations in red. Units: tCO2e Transport Residential Services Industry 2006 2,819,891 989,724 418,610 2,457,316 Prime mat. Fuels cons. 2012 3,579,318 1,347,699 470,635 2,591,323 cons. 2015 3,811,165 1,526,687 496,647 2,658,327 2020 4,363,200 1,825,000 540,000 2,770,000 Residential Services Industry Residues 2006 2,583,674 3,053,433 3,818,571 279,640 221,759 energy, sinks Reduct. RE, Elec. cons. Residues & fuels 2012 2,859,056 3,951,962 4,186,836 284,161 3,250,581 2015 2,866,549 4,401,226 4,291,292 285,298 3,727,244 2020 2,878,200 5,150,000 4,382,400 274,411 5,106,889
- 21. 21 4 Calculation of emissions in the GF scenario for the years 2012 and 2020. Orange and blue backgrounds serve to identify the base for the application of the assumed emission reduction percentages. Net emission reductions are in red characters. 2012 2020 Measure Ref. Base & % Base & % TRANSPORT Fuels cons. 3,775,652 5,050,000 1 3.13% 6.89% 2 0.78% 3.13% 3 0.63% 8.14% 3,468,389 2.50% 21.28% 3,975,158 4 0.47% 1.88% 5 3.13% 6.89% RESIDENTIAL Fuels cons. 1,347,699 1,825,000 Electricity cons. 3,057,814 3,690,000 6 3.13% 12.52% 7 3.13% 12.52% 8 3.91% 15.17% 2,593,867 9.39% 49.43% 1,866,033 19 4.5% 13.5% 20 0.5% 1.5% 21 1.6% 1.57% 47,855 18.8% 18.78% 692,982 SERVICES Fuels cons. 470,635 540,000 Electricity cons. 3,951,962 5,150,000 RESIDUES 286,309 295,200 9 1.17% 1.17% 282,948 11.02% 11.02% 262,664 INDUSTRY Electricity cons. 4,316,326 4,980,000 Prime mat. cons. 2,591,323 2,770,000 10 4.70% 4.70% 4,113,675 18.78% 18.78% 4,044,756 11 1.50% 6.90% 4.00% 2,487,670 20.90% 2,191,070 12 2.50% 14.00% TOTAL GROSS EMISS. 18,716,845 19,854,681 AGRICULTURE (reductions) 8,721,840 10,495,000 13 0.63% 0.63% -54,599 2.50% 2.50% -262,795 14 -1,700,000 -2,210,000 RENEWABLE ENERGIES (net reductions) 8,721,840 10,495,000 Planned 3E2010 Planned -2,833,486 2012 x 1.60 -4,533,578 15 2,066,712 3,306,739 16 43,023 68,837 17 703,647 1,125,835 18 20,104 32,167 Others 22 - 195,604.09 - 432,412.58 23 - 1,510.23 - 7,551.13 TOTAL REDUCTIONS - 4,785,199 - 7,446,336 TOTAL 13,877,048 12,145,551
- 22. 22 5 Set of tables and graphs for the GF scenario for the target years. Estimations in red. Transport Residential Services Industry 2006 2,819,891 989,724 418,610 2,457,316 Prime mat. Fuels cons. 2012 3,468,389 1,347,699 470,635 2,487,670 cons. 2015 3,561,228 1,526,687 496,647 2,432,369 2020 3,975,158 1,825,000 540,000 2,191,070 Residential Services Industry Residues energy, sinks & 2006 2,583,674 3,053,433 3,818,571 279,640 221,759 Reduct. RE, Elec. cons. Residues 2012 3,057,814 3,951,962 4,113,675 282,948 4,785,199 fuels 2015 3,294,884 4,401,226 4,136,531 282,843 5,485,312 2020 3,690,000 5,150,000 4,044,756 262,664 7,446,336 6 Emissions from Basque industry in 2006, following the codification from EPER (2009) and the data from EPER (ibid.) and EVE (2009). Own elaboration. Industry code tCO2e % Code 1- CO2 252,331.27 4% Code 2.2- CO2 1,503,431.27 24% Code 3.1- CO2 2,447,595.79 39% Code 3.3- CO2 424,758.17 7% Code 5- CO2 405,228.36 6% Code 6- CO2 435,875.88 7% Codes 1, 5, 9- CH4, in CO2e 417,933.94 7% Codes 1,4- N2O, in CO2e 388,731.96 6% TOTAL 6,275,887 100%