The International Energy Agency’s Efficient World Scenario
•
0 likes•87 views

The International Energy Agency (IEA) has developed an Efficient World Scenario (EWS) to highlight the benefits to the global energy system from the adoption of cost-effective energy efficiency measures. This presentation will provide an overview of the EWS, which was published in the IEA’s Energy Efficiency 2018 report, and include an examination the potential efficiency gains in the transport, buildings and industry sectors and the policy measures needed to realise this potential.

Recommended
Recommended
More Related Content
What's hot
What's hot (20)
Similar to The International Energy Agency’s Efficient World Scenario
Similar to The International Energy Agency’s Efficient World Scenario (20)
More from Leonardo ENERGY
More from Leonardo ENERGY (20)
Recently uploaded
Recently uploaded (20)
The International Energy Agency’s Efficient World Scenario
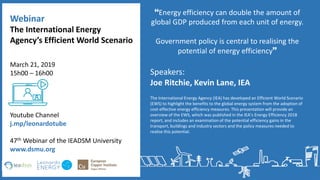
- 1. Speakers: Joe Ritchie, Kevin Lane, IEA The International Energy Agency (IEA) has developed an Efficient World Scenario (EWS) to highlight the benefits to the global energy system from the adoption of cost-effective energy efficiency measures. This presentation will provide an overview of the EWS, which was published in the IEA’s Energy Efficiency 2018 report, and includes an examination of the potential efficiency gains in the transport, buildings and industry sectors and the policy measures needed to realise this potential. Energy efficiency can double the amount of global GDP produced from each unit of energy. Government policy is central to realising the potential of energy efficiency The International Energy Agency’s Efficient World Scenario Youtube Channel j.mp/leonardotube 47th Webinar of the IEADSM University www.dsmu.org March 21, 2019 15h00 – 16h00 Webinar
- 2. © OECD/IEA 2018 The IEA’s Efficient World Scenario Joe Ritchie and Kevin Lane 21 March 2019 IEA
- 3. © OECD/IEA 2018 Energy Efficiency 2018 • Global trends and outlooks - Energy intensity and efficiency trends - Policy progress and trends - Introduction to efficient world scenario - IEA Efficient World Strategy • Sector chapters - Transport, Buildings and Industry • Investment finance and business models • Energy Efficiency in Emerging Economies - Brazil, China, India, Indonesia, Mexico and South Africa • Available for free from www.iea.org/efficiency2018
- 4. © OECD/IEA 2018 Energy efficiency trends and the Efficient World Scenario
- 5. © OECD/IEA 2018 Why is energy use on the rise? Global energy efficiency is improving, but its impact is being overwhelmed by factors that create more demand for energy. Decomposition of final energy use in the world’s major economies Note: Countries covered are IEA countries plus China, India, Brazil, Indonesia, Russia, South Africa and Argentina. 0 50 100 150 200 250 300 350 2000 energy use More buildings and appliances Less efficient transport patterns Increased activity Shifts in economic activity Improvements in energy efficiency 2017 energy use EJ
- 6. © OECD/IEA 2018 The impacts of energy efficiency are already significant Energy efficiency improvements since 2000 prevented 12% more energy use and emissions in 2017. Global final energy use and emissions with and without energy efficiency improvements, 2000-17 100 120 140 160 180 200 2000 2003 2006 2009 2012 2015 2017 Index(2000=100) Energy use 100 120 140 160 180 200 2000 2003 2006 2009 2012 2015 2017 Emissions GDP Without energy efficiency Actual
- 7. © OECD/IEA 2018 Efficiency gains have been largest in industry, underpinned by savings in China and North America. Transport has made the smallest contribution, due to variable policy and activity growth. Sectoral contributions to energy savings from improvements in energy efficiency in IEA and other major economies What sectors are contributing to efficiency gains? Notes: IEA includes Mexico, other major economies are China, India, Brazil, Indonesia, Russia, South Africa and Argentina. 51% 38% 11% Industry Buildings Transport
- 8. © OECD/IEA 2018 What does a more efficient world look like? • The world is missing opportunities to improve energy efficiency, policy is not delivering the full potential gains that are available with current technology. • What is possible with greater efforts on energy efficiency? The IEA’s new Efficient World Scenario answers the question: What would happen by 2040 if countries realised all the economically viable energy efficiency potential that is available today? The Economy The Energy System The Environment
- 9. © OECD/IEA 2018 In the Efficient World Scenario, energy intensity will improve by around 3% per year, a step-up from current levels, resulting in minimal increases in energy demand, despite the global economy doubling. Global primary energy demand, GDP and intensity, historically and in the EWS, 2000-40 Energy intensity improvements will accelerate 0 100 200 300 400 500 2000 2010 2020 2030 2040 Index (2000=100) Primary energy demand GDP Energy intensity Primary energy demand (EWS) GDP (EWS) Energy intensity (EWS)
- 10. © OECD/IEA 2018 The IEA’s new Efficient World Scenario shows that global energy intensity improvements could average 2.9% per year to 2040, a 75% increase on levels observed in 2017. Global energy intensity improvement in the in the Efficient World Scenario, 2017-40 A lot of energy efficiency potential remains untapped -3.5% -3.0% -2.5% -2.0% -1.5% -1.0% -0.5% 0.0% 2014 2015 2016 2017 EWS 2017-40
- 11. © OECD/IEA 2018 Energy savings from efficiency are scaled up Between now and 2040, energy efficiency improvements could prevent nearly 30% more energy use. 0 100 200 300 400 500 600 2000 2017 2040 Trends Outlook EJ Energy savings compared with Current Policies Scenario Energy savings since 2000 due to efficiency Energy demand (Historical and under Efficient World Scenario) Global energy use and savings from efficiency gains, historic and outlook
- 12. © OECD/IEA 2018 There is significant cost-effective savings potential in every sector Only one third of the potential cumulative energy savings from efficiency gains by 2040 are realised in the NPS. The majority of potential across all sectors is realised in the EWS. Cumulative energy savings in NPS and additional potential in the EWS to 2040 0 100 200 300 400 500 600 Industry Transport Buildings EJ Efficient World Scenario New Policies Scenario
- 13. © OECD/IEA 2018 Efficiency can deliver immediate environmental benefits The EWS results in an early emissions peak and around 40% of the abatement required by 2040 to be in line with Paris targets. Energy efficiency is indispensable to achieving global climate targets. Greenhouse emissions in the NPS and EWS, 2000-40 (left) and air pollutant emissions in the EWS, 2015-40 (right) 20 25 30 35 40 2000 2005 2010 2015 2020 2025 2030 2035 2040 Gt CO2-eq Greenhouse gas emissions Historic Baseline Efficient World Scenario 0 40 80 120 160 200 240 2015 2040 Mt Air pollutant emissions PM2.5 NOx SO2
- 14. © OECD/IEA 2018 The EWS is the efficiency of component of the IEA SDS Energy efficiency and renewables account for 80% of the cumulative CO2 emissions reductions in the SDS. Global CO2 emissions reductions in the New Policies and Sustainable Development Scenarios 16 20 24 28 32 36 2010 2020 2030 2040 Gt New Policies Scenario Sustainable Development Scenario Efficiency Renewables Fuel-switching CCS Other Nuclear 44% 36% 2% 6% 9% 2%
- 15. © OECD/IEA 2018 Efficiency bring benefits to all levels of the economy The Efficient World Scenario also fully delivers the energy efficiency target (Target 7.3) of the UN Sustainable Development Goals USD 700 billion Avoided energy imports in the EU, China and India USD 600 billion Avoided energy expenditure in industry USD 550 billion Avoided household energy spending
- 16. © OECD/IEA 2018 Transport energy efficiency
- 17. © OECD/IEA 2018 Historic rates of efficiency improvement within transport are highly variable. Car and truck energy efficiency could improve at a much faster rate. Historical efficiency improvements and future projections for transport (left), Energy savings potential for road transport (right) Transport can accelerate towards a more efficient world 0% 1% 2% 3% 4% 2000-16 2017-40 2000-16 2017-40 2000-16 2017-40 2000-16 2017-40 Passenger light- duty vehicles Road freight Aviation International Shipping Averageannualefficiencyimprovement Efficient World Scenario Historical Cars and vans 52% Trucks 42% Buses 4% 2 and 3 wheelers 2%
- 18. © OECD/IEA 2018 Transport policy coverage is highest in countries where fuel economy standards have been in place for an extended period (US, China, Japan). There is room for growth in emerging markets. Mandatory policy coverage of transport energy use for select countries, 2017 Transport policy reflects the varying presence of standards 0% 20% 40% 60% 80% % of transport energy use 2000 2005 2010 2015 2017
- 19. © OECD/IEA 2018 Implementing the best in class fuel economy standards would have avoided 2.2 mb/day of oil use. Without any change in policy settings, passenger car energy use could increase by over 4 mb/day. Historical and future change in global passenger car energy use without standards and if best-in-class fuel economy standards had been implemented, 2000-17 and 2017-40 What is the benefit of fuel economy standards -5 -4 -3 -2 -1 0 1 2 3 4 5 Without standards Implementing best-in-class standards Mboe/d Implementing no new policies (CPS) EWS 2000-17 2017-40
- 20. © OECD/IEA 2018 New ambition levels required for transport What is possible by 2040 Key policy actions • Improve coverage and strength of transport policies for cars and trucks and non-road modes. • Provide incentives to support uptake and sustainable use of efficient vehicles. • Information to support efficient vehicle uptake and mode shift. • Energy demand could stay flat, despite doubling activity levels. • Passenger cars and trucks offer two-thirds of potential savings.
- 21. © OECD/IEA 2018 Buildings and appliances energy efficiency
- 22. © OECD/IEA 2018 Buildings energy use has been rising, but could stay flat to 2040, despite 60% more floor space. Buildings energy intensity has been improving at 1.6% per year, but this could be 2.2% per year. Buildings energy use and energy intensity, 2000-40 Buildings energy intensity has been improving 0.0 0.2 0.4 0.6 0.8 1.0 0 25 50 75 100 125 2000 2005 2010 2017 2020 2025 2030 2035 2040 Historical Efficient World Scenario GJ/m2 floor areaEJ Total demand Intensity (floor area)
- 23. © OECD/IEA 2018 Energy efficiency improvement has been variable, due mainly to increased appliance ownership. Gains could be made across all end-uses, with space and water heating and cooling covering 60% Change in energy intensity, 2000-40 (left) and contribution to total energy savings in the EWS to 2040 (right) Efficiency can improve across all building end-uses -40% -20% 0% 20% 40% 60% 2000-17 2018-40 2000-17 2018-40 2000-17 2018-40 2000-17 2018-40 2000-17 2018-40 2000-17 2018-40 Space heating Space cooling Water heating Lighting Cooking Appliances Energy intensity improvement (%) Historic Efficient World Scenario 26% 22% 26% 5% 9% 12% 24 EJ Space heating Water heating Cooking Lighting Appliances Space cooling
- 24. © OECD/IEA 2018 Less than 40% of building energy use is covered by mandatory energy efficiency policy. Although coverage is high for lighting and space cooling Energy efficiency policy coverage of buildings end-uses, 2000-17 Policy coverage is spread across building end-uses 0% 20% 40% 60% 80% 100% 2000 2003 2006 2009 2012 2015 2017 Policy coverage Lighting Space cooling Appliances Space heating Water heating ALL BUILDINGS Cooking
- 25. © OECD/IEA 2018 Space cooling energy use has grown rapidly, as a result of warming climates and growing populations. Forces pushing space cooling energy demand will continue to grow, but efficiency can limit the impact. Buildings cooling energy use decomposition, global, 2000-40 Space cooling energy use will grow rapidly 0 4 8 12 16 20 2000 Activity Structure Efficiency 2017 Activity Structure Efficiency 2040 Historical Efficient World Scenario Cooling final energy (EJ)
- 26. © OECD/IEA 2018 Buildings could be 40% more efficient than today What is possible by 2040 Key policy actions • Comprehensive efficiency policies, targeting both new and existing building stock and appliances. • Incentives to encourage consumers to adopt high efficiency appliances and undertake deep energy retrofits. • Improved quality and availability of energy performance information and tools. • Building space could increase by 60% for no additional energy use. • Space heating, cooling and water heating offer 60% of savings.
- 27. © OECD/IEA 2018 Industrial energy efficiency
- 28. © OECD/IEA 2018 Manufacturing energy intensity in major economies has improved by 25% since 2000. Cost-effective energy efficiency measures could see an improvement of nearly 45% by 2040. Energy intensity trends for the manufacturing industries (left) and NPS and EWS energy intensity outlooks, 2018-40 (right) Manufacturing energy intensity can improve even faster 70 100 130 160 190 220 2000 2003 2006 2009 2012 2015 2017 Index(2000=100) Gross value added Energy use Energy intensity 50 60 70 80 90 100 2018 2025 2030 2035 2040 Index(2018=100) New Policies Scenario Efficient World Scenario
- 29. © OECD/IEA 2018 Energy efficiency improvements are possible across all sub-sectors. Light industry (e.g. food, beverage and textile manufacturing) represent the bulk (70%) of savings. Percentage improvement in energy intensity by industry sub-sector (left) contribution to total energy savings in 2040 (right) Efficiency can improve across all industry sub-sectors 0% 10% 20% 30% 40% 50% 2000-17 2018-40 2000-17 2018-40 2000-17 2018-40 2000-17 2018-40 2000-17 2018-40 2000-17 2018-40 Iron and steel Chemical and petrochemical Cement Paper, pulp and print Aluminium Other industries %improvementinenergyintensity Historic Efficient World Scenario 14% 9% 2%5% 1% 70% Iron and steel Chemicals Cement Pulp and paper Aluminium Other industries
- 30. © OECD/IEA 2018 MEPS are a common policy tool, but slow stock turnover has not seen policy reach its potential. Coverage is highest in North America due to early implementation of policy (i.e. before 2000). Policy coverage and potential for electric motors (left) and coverage and increase in policy strength since 2000 (right) MEPS for electric motors is a common policy tool 0% 20% 40% 60% 80% 2010 2011 2012 2013 2014 2015 2016 2017 Electricmotorsenergyusecovered Global Actual coverage Coverage potential 0% 2% 4% 6% 8% 0% 20% 40% 60% 80% Electricmotorsenergyusecovered Country/region Increase in policy strength since 2000 (right axis)
- 31. © OECD/IEA 2018 There were over 23 000 ISO 50001 certifications in 2017, a slow down in the rate of growth. Matching certifications for other management standards will depend on take-up by China. ISO 50001 certifications 2011-17 (left) and certification progress compared with other management standards (right) ISO 50001 certifications are slowing 0 5 000 10 000 15 000 20 000 25 000 2011 2012 2013 2014 2015 2016 2017 Number of certifications Germany Other Europe Asia and Pacific North America Other 0 30 000 60 000 90 000 120 000 150 000 1 2 3 4 5 6 7 8 9 10 Numberofcertifications Years after introduction of standard ISO 14001 ISO 9001 ISO 50001
- 32. © OECD/IEA 2018 Targeting efficiency beyond the largest industry sectors What is possible by 2040 Key policy actions • Expanded and strengthened standards for key industrial equipment, including electric heat pumps and motors. • Incentives to encourage the adoption of energy management systems. • Mechanisms such as industry networks, training and case studies to enhance awareness and capacity. • Value-added per unit of energy could double. • Less energy-intensive industry offers 70% of potential savings.
- 33. © OECD/IEA 2018 Energy efficiency investment
- 34. © OECD/IEA 2018 Global energy efficiency investment grew marginally in 2017, up by 3% to USD 236 billion. The buildings sector continues to dominate, reaching USD 140 billion (59%) of the global total in 2017. Energy efficiency investment by sector and region Energy efficiency investment growth slowed in 2017 0 50 100 150 200 250 2014 2015 2016 2017 USDbillions By region Other North America Europe China 29% 11% 6% 14% 7% 8% 14% 11% 59% 15% 26% By sector Envelope HVAC and controls Appliances Lighting Energy intensive industry Other industry Premium paid for energy efficient vehicle Freight vehicles USD 236 billion Buildings Transport Industry
- 35. © OECD/IEA 2018 But investment levels need to rise Annual energy efficiency investment must double to 2025 and then double again to 2040. Policy will need to facilitate finance and business model innovation to stimulate this investment. Annual energy efficiency investment in 2017 and in the Efficient World Scenario 0 300 600 900 1 200 1 500 Current Average annual 2017-25 Average annual 2026-40 USD (2017) billions 2017 Efficient World Scenario (EWS)
- 36. © OECD/IEA 2018 Concluding remarks • The IEA EWS shows a 2040 world with double GDP, 20% more people and 60% more building space, with lower emissions than today • Efficiency can reduce air pollution, imports and consumer bills, and EWS maps out the path to delivering the UN SDG on energy efficiency • The efficiency opportunities are cost-effective and use only technology available today, but require a significant step up in policy action • Investments need to double now and double again after 2025, but these investments will payback threefold on energy savings alone • There are good examples today of all the policies required for tomorrow. These form the basis for increased ambition and impact
- 37. © OECD/IEA 2018 Download for free at: www.iea.org/efficiency2018