Downloaded 12 times


![9WHO REPORT ON THE GLOBAL TOBACCO EPIDEMIC, 2008
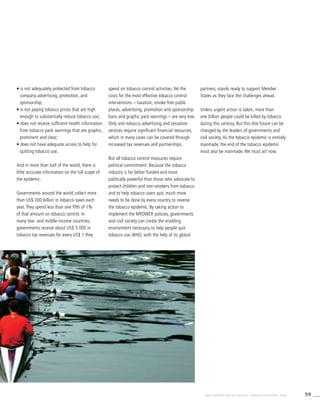
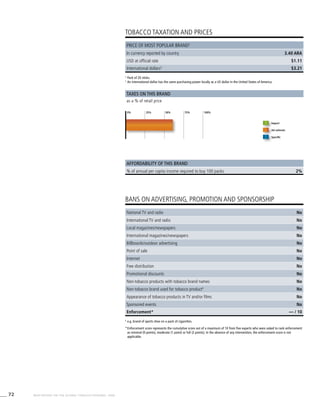
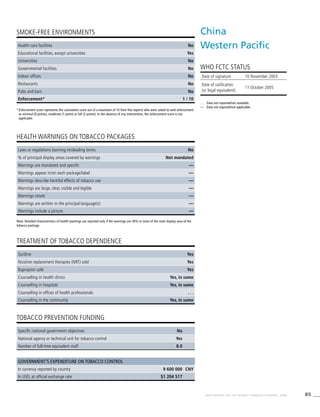
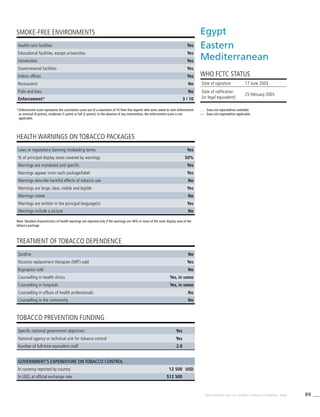
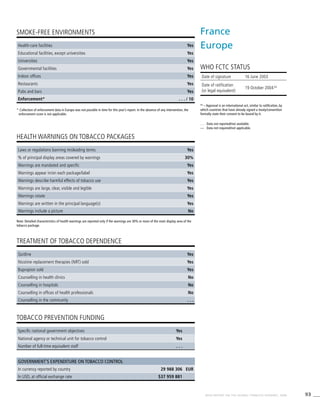
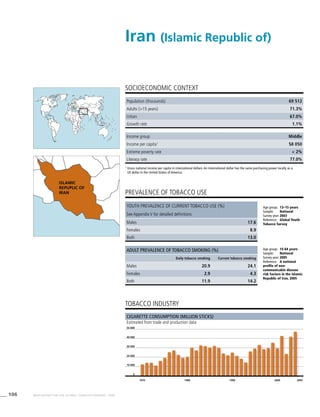
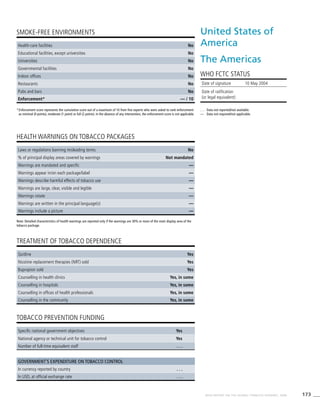
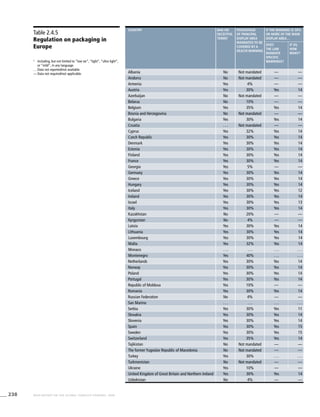
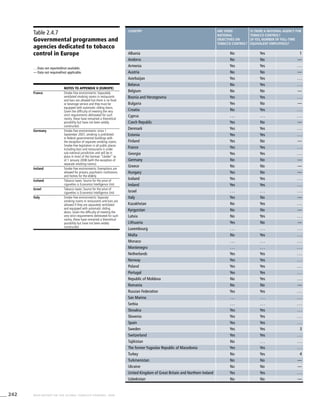
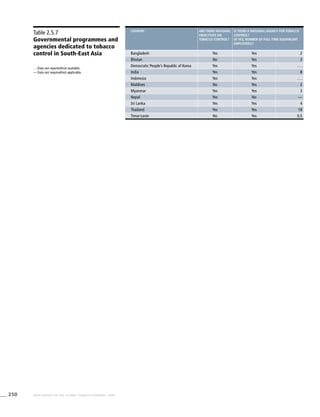
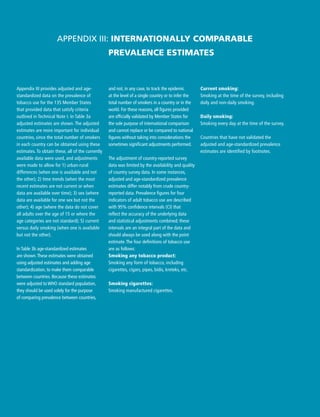
Millionsofdeaths(2005)
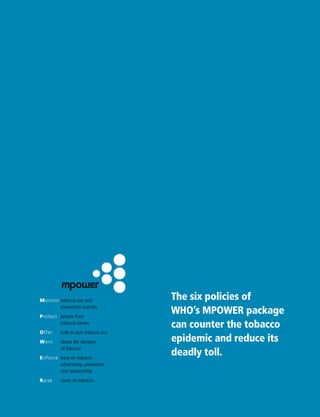
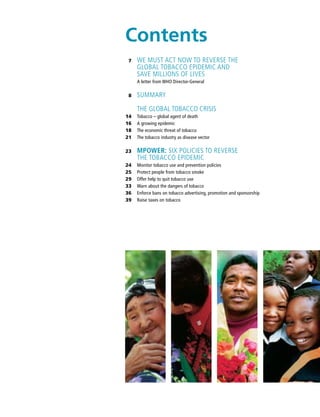
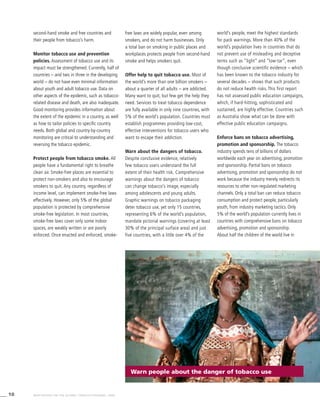
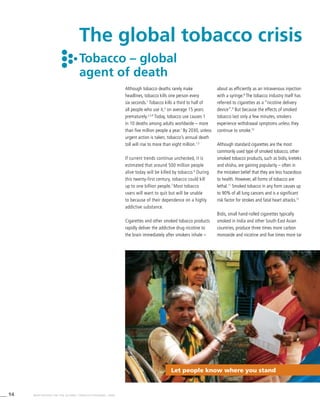
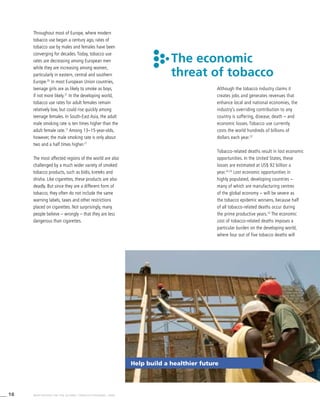
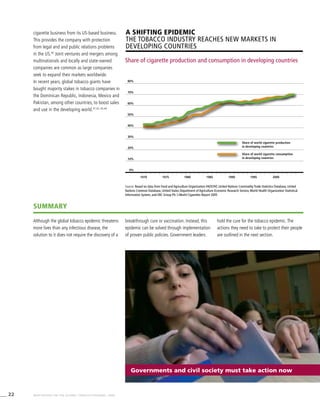
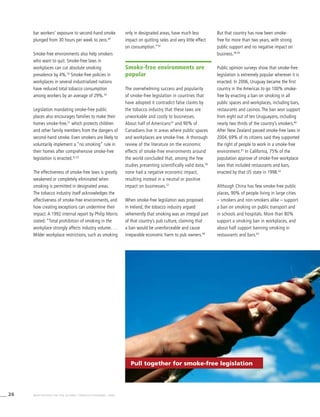
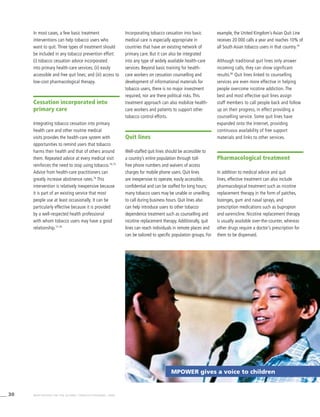
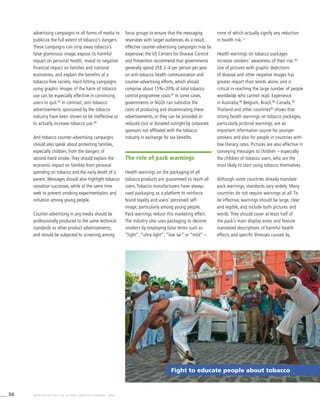
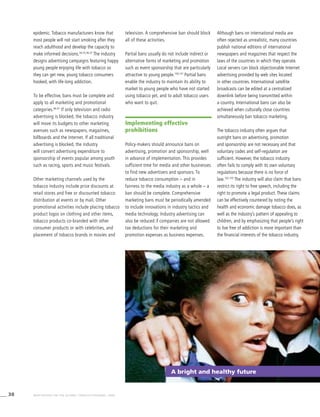
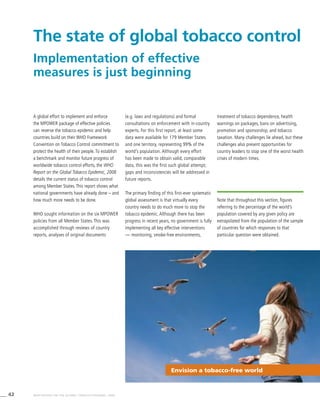
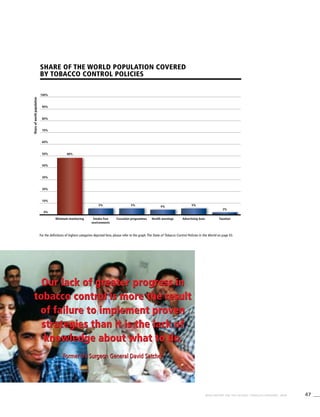
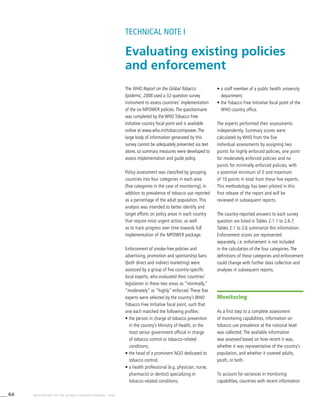
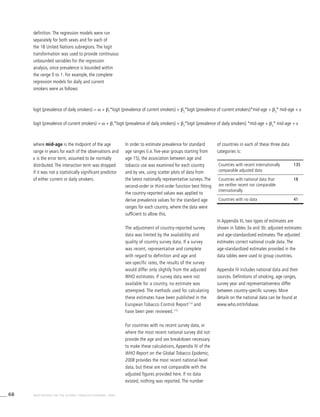
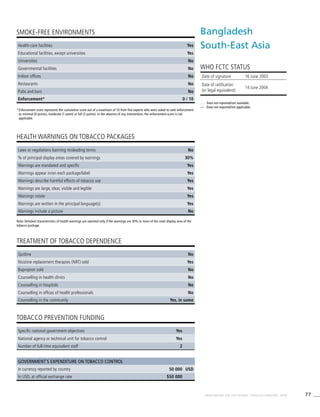
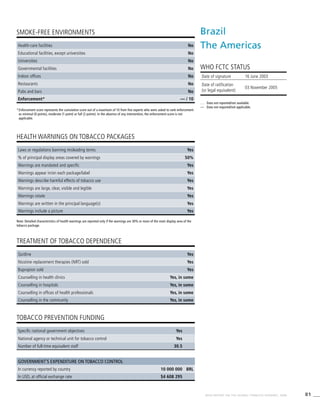
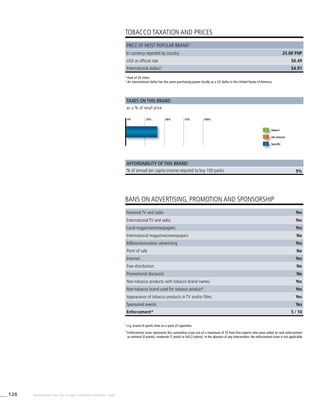
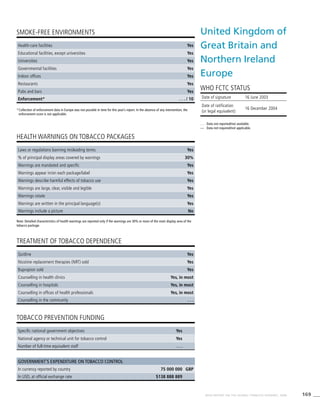
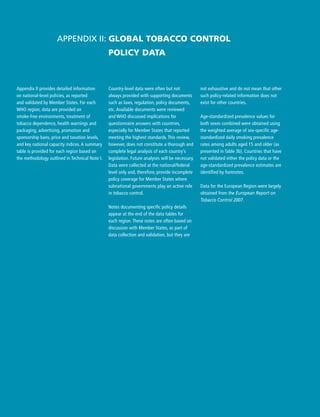
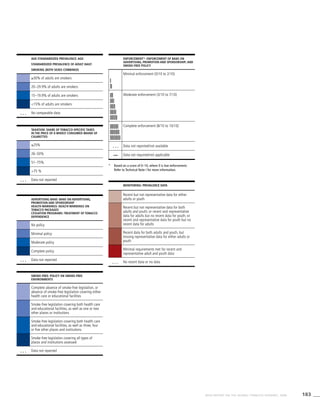
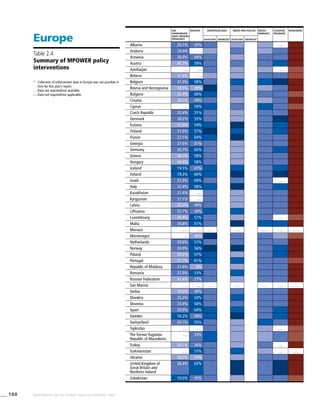
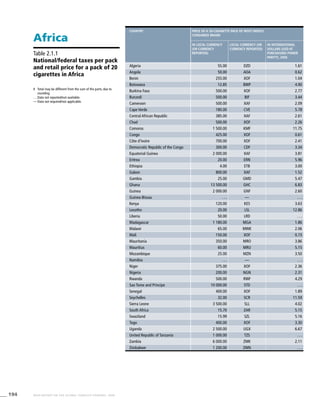
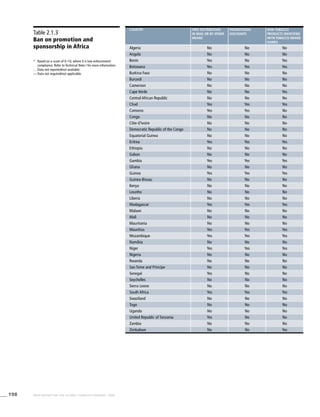
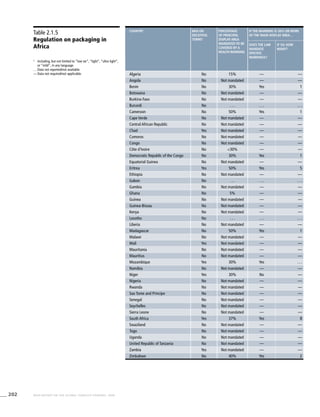
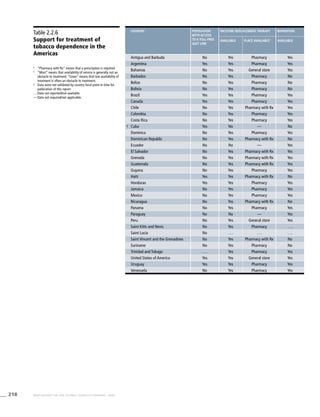
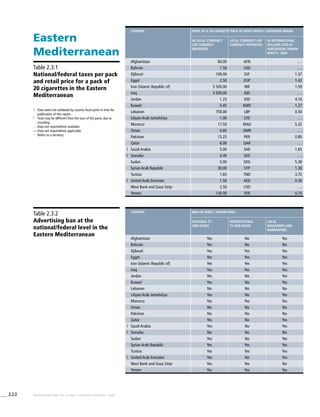
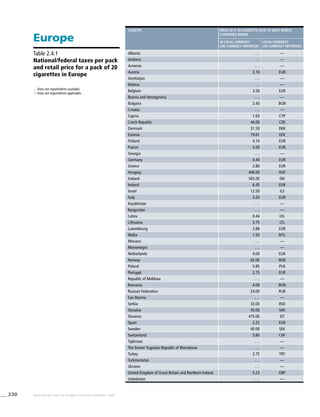
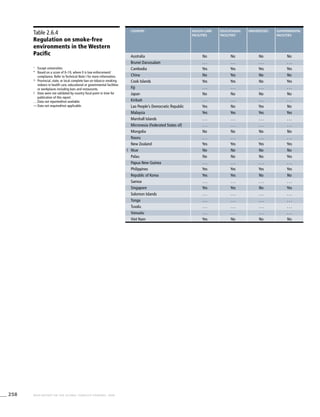
[Tobacco use] is the
leading preventable cause
of death in the world.
World Health Organization:The World Health Report 2003
Tobacco use is a risk factor for six of the eight
leading causes of death in the world
Ischaemic
heart
disease
Cerebro-
vascular
disease
Lower
respiratory
infections
Chronic
obstructive
pulmonary
disease
HIV/AIDS Diarrhoeal
diseases
Tuberculosis Trachea,
bronchus,
lung cancers
Tobacco use
Hatched areas indicate proportions of deaths
that are related to tobacco use and are
coloured according to the column of the
respective cause of death.
*Includes mouth and oropharyngeal cancers,
oesophageal cancer, stomach cancer, liver
cancer, other cancers, as well as cardiovascular
diseases other than ischaemic heart disease
and cerebrovascular disease.
Source: Mathers CD, Loncar D. Projections of
global mortality and burden of disease from
2002 to 2030. PLoS Medicine, 2006, 3(11):
e442.Additional information obtained from
personal communication with C.D. Mathers.
Source of revised HIV/AIDS figure:AIDS
epidemic update. Geneva, Joint United Nations
Programme on HIV/AIDS (UNAIDS) and World
Health Organization (WHO), 2007.
7
8
6
5
4
3
2
1
0
Other
tobacco-
caused
diseases*](https://image.slidesharecdn.com/ol25kkvlqguoxfywagtq-signature-60b0131a05a17be1631d7bde4d7608a3b2ae419a0a24dd90535582b58a53e895-poli-151021161413-lva1-app6891/85/MPOWER-Package-15-320.jpg)

![60 WHO REPORT ON THE GLOBAL TOBACCO EPIDEMIC, 2008
9. Battling big tobacco: Mike Wallace talks to the highest-
ranking tobacco whistleblower. CBS News, 16 January
2005 (http://www.cbsnews.com/stories/2005/01/13/60II/
main666867.shtml, accessed 5 December 2007).
10. Hendricks PS et al. The early time course of smoking
withdrawal effects. Psychopharmacology, 2006,
187(3):385–396.
11. World Health Organization. Tobacco: deadly in any form
or disguise. Geneva, World Health Organization, 2006
(http://www.who.int/tobacco/communications/events/
wntd/2006/Tfi_Rapport.pdf, accessed 5 December 2007).
12. World Health Organization. World health report 2002.
Geneva, World Health Organization, 2002
(http://www.who.int/whr/2002/Overview_E.pdf,
accessed 5 December 2007).
13. Gottlieb N. Indian cigarettes gain popularity, but don’t
let the flavor fool you. Journal of the National Cancer
Institute, 1999, 91(21):1806–1807.
14. California Environmental Protection Agency. Proposed
identification of environmental tobacco smoke as a
toxic air contaminant: executive summary. Sacramento,
California Environmental Protection Agency, June 2005
(ftp://ftp.arb.ca.gov/carbis/regact/ets2006/app3exe.pdf,
accessed 5 December 2007).
15. Boffetta P et al. Smokeless tobacco use and risk of cancer
of the pancreas and other organs. International Journal of
Cancer, 2005, 114(6):992–995.
16. Gupta PC, Sreevidya S. Smokeless tobacco use, birth
weight, and gestational age: population based, prospective
cohort study of 1217 women in Mumbai, India. British
Medical Journal, 2004, 328(7455):1538.
17. Guindon GE, Boisclair D. Past, current and future trends
in tobacco use. Washington, DC, World Bank, 2003 (http://
www1.worldbank.org/tobacco/pdf/Guindon-Past,%20
current-%20whole.pdf, accessed 5 December 2007).
18. Liu BQ et al. Emerging tobacco hazard in China: 1.
Retrospective proportional mortality study of one
million deaths. British Medical Journal, 1998,
317(7170):1411–1422.
19. Gajalakshmi V et al. Smoking and mortality from
tuberculosis and other diseases in India: retrospective study
of 43000 adult male deaths and 35000 controls. Lancet,
2003, 362(9383):507–515.
20. Gilmore A et al. Prevalence of smoking in 8 countries of
the former Soviet Union: results from the living conditions,
lifestyles and health study. American Journal of Public
Health, 2004, 94(12):2177–2187.
21. U.S. Centers for Disease Control and Prevention.
Global youth tobacco survey. Atlanta, U.S. Centers for
Disease Control and Prevention (http://www.cdc.gov/
tobacco/global/gyts/datasets/policy.htm, accessed
5 December 2007).
22. Guindon GE et al. The cost attributable to tobacco use:
a critical review of the literature. Geneva, World Health
Organization, 2006.
23. U.S. Centers for Disease Control and Prevention. Annual
smoking-attributable mortality, years of potential life lost,
and productivity losses – United States, 1997–2001.
Morbidity and Mortality Weekly Report, 2005,
54(25):625–628.
24. World health statistics. Geneva, World Health
Organization, 2007.
25. Efroymson D et al. Hungry for tobacco: an analysis of the
economic impact of tobacco consumption on the poor in
Bangladesh. Tobacco Control, 2001, 10(3):212–217.
26. de Beyer J, Lovelace C, Yürekli A. Poverty and tobacco.
Tobacco Control, 2001, 10(3):210–211.
27. Nassar H. The economics of tobacco in Egypt, a new
analysis of demand. Washington, DC, World Bank, 2003
(http://repositories.cdlib.org/context/tc/article/1120/type/
pdf/viewcontent/, accessed 5 December 2007).
28. Sesma-Vázquez S et al. El comportamiento de la demanda
de tabaco en México: 1992–1998. [Trends of tobacco
demand in México: 1992–1998]. Salud Publica de Mexico,
2002, 44(Suppl. 1):S82–S92.
29. Liu Y et al. Cigarette smoking and poverty in China. Social
Science & Medicine, 2006, 63(11):2784–2790.
30. World Health Organization. World no tobacco day 2004
materials. Geneva, World Health Organization, 2004
(http://www.who.int/tobacco/resources/publications/
wntd/2004/en/index.html, accessed 5 December 2007).
31. Behan DF, Eriksen MP, Lin Y. Economic effects of
environmental tobacco smoke. 2005 (http://www.soa.org/
files/pdf/ETSReportFinalDraft(Final%203).pdf, accessed
5 December 2007).
32. McGhee SM et al. Cost of tobacco-related diseases,
including passive smoking, in Hong Kong. Tobacco Control,
2006, 15(2):125–130.
33. Yach D, Wipfli H. A century of smoke. Annals of Tropical
Medicine and Parasitology, 2006, 100(5–6):465–479.
34. Khuder SA, Dayal HH, Mutgi AB. Age at smoking onset and
its effect on smoking cessation. Addictive Behaviors, 1999,
24(5):673–677.
35. D’Avanzo B, La Vecchia C, Negri E. Age at starting
smoking and number of cigarettes smoked. Annals of
Epidemiology, 1994, 4(6):455–459.
36. Chen J, Millar WJ. Age of smoking initiation: implications
for quitting. Health Reports, 1998, 9(4):39–46.
37. Everett SA et al. Initiation of cigarette smoking and
subsequent smoking behavior among U.S. high school
students. Preventive Medicine, 1999, 29(5):327–333.
38. Breslau N, Peterson EL. Smoking cessation in young adults:
age at initiation of cigarette smoking and other suspected
influences. American Journal of Public Health, 1996,
February, 86(2):214–220.
39. Federal Trade Commission. Cigarette report for 2003.
Washington, DC, Federal Trade Commission, 2005
(http://www.ftc.gov/reports/cigarette05/050809cigrpt.pdf,
accessed 6 December 2007).
References
1. Mathers CD, Loncar D. Projections of global mortality and
burden of disease from 2002 to 2030. PLoS Medicine,
2006, 3(11):e442.
2. Peto R et al. Mortality from smoking worldwide. British
Medical Bulletin, 1996, 52(1):12–21.
3. U.S. Department of Health and Human Services. The health
consequences of smoking: a report of the Surgeon
General. Atlanta, U.S. Department of Health and Human
Services, Centers for Disease Control and Prevention,
National Center for Chronic Disease Prevention and Health
Promotion, Office on Smoking and Health, 2004
(http://www.cdc.gov/tobacco/data_statistics/sgr/sgr_2004/
chapters.htm, accessed 5 December 2007).
4. Peto R et al. Mortality from tobacco in developed countries:
indirect estimation from national vital statistics. Lancet,
1992, 339(8804):1268–1278.
5. Murray CJL, Lopez AD. Alternative projections of mortality
and disability by cause 1990-2020: Global burden of
disease study. Lancet, 1997, 349(9064):1498-1504.
6. Levine R, Kinder M. Millions saved: proven success
in global health. Washington, DC, Center for Global
Development, 2004.
7. Peto R, Lopez AD. Future worldwide health effects of
current smoking patterns. In: Koop CE, Pearson CE, Schwarz
MR, eds. Critical issues in global health. San Francisco,
Wiley (Jossey-Bass), 2001:154–161.
8. Benowitz NL. Pharmacology of nicotine: addiction and
therapeutics. Annual Review of Pharmacology and
Toxicology, 1996, 36:597–613.](https://image.slidesharecdn.com/ol25kkvlqguoxfywagtq-signature-60b0131a05a17be1631d7bde4d7608a3b2ae419a0a24dd90535582b58a53e895-poli-151021161413-lva1-app6891/85/MPOWER-Package-66-320.jpg)
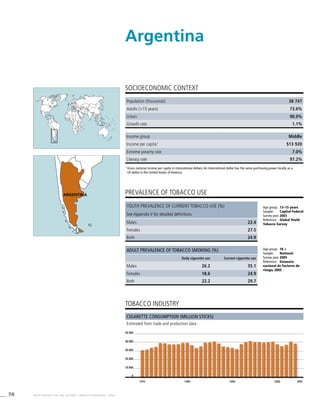
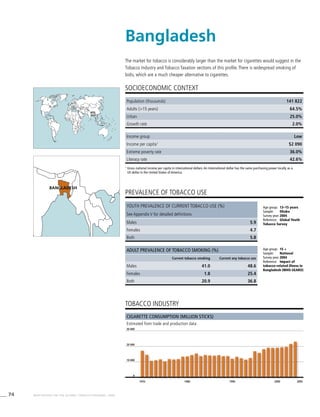

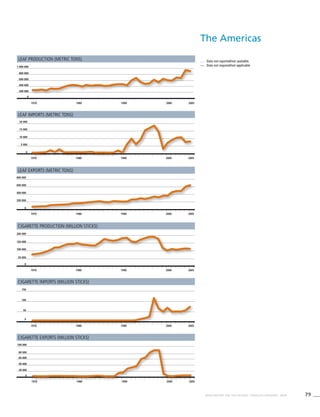
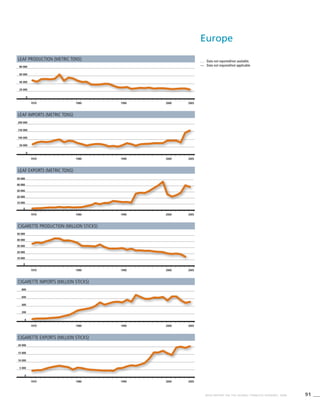


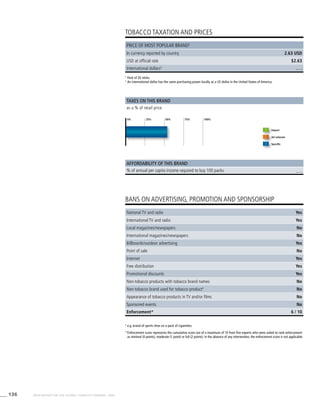


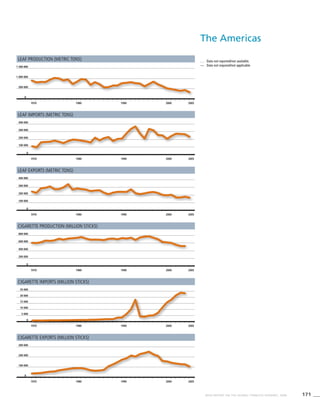


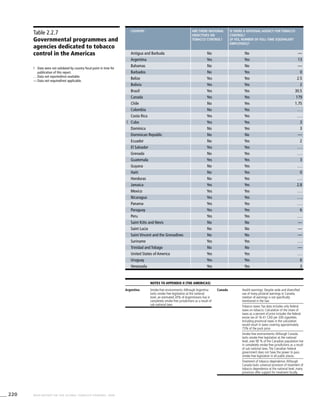
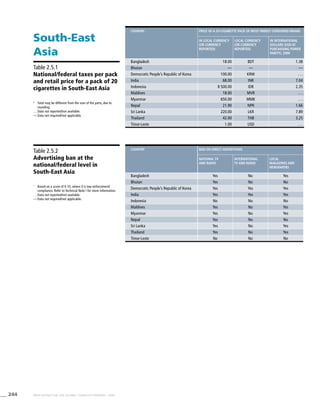
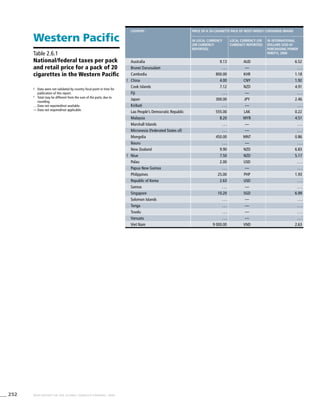
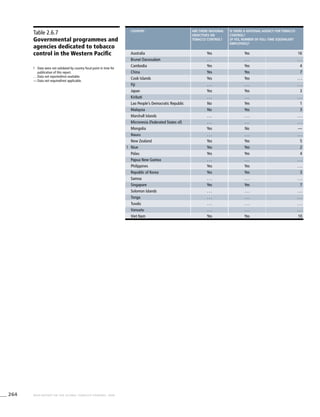
![268 WHO REPORT ON THE GLOBAL TOBACCO EPIDEMIC, 2008
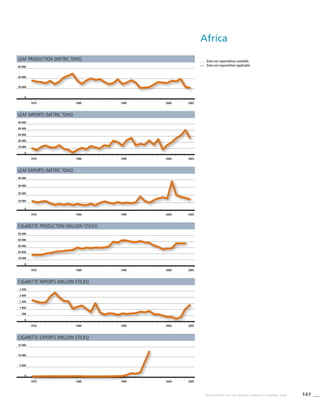
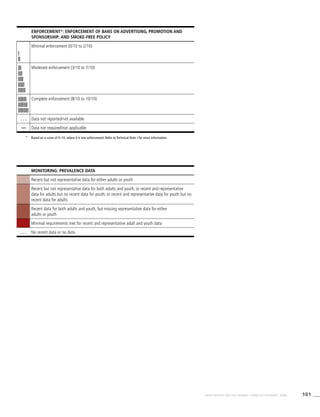
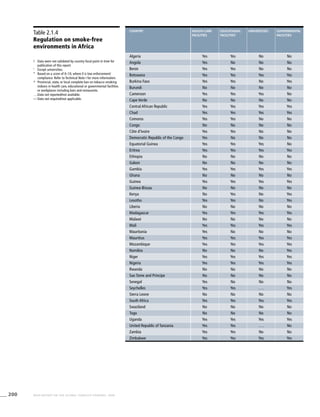
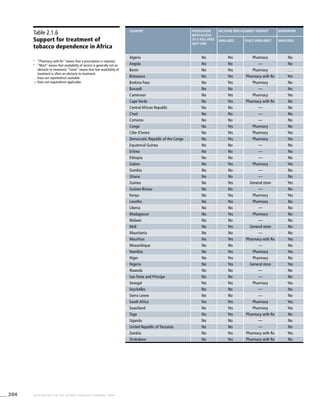
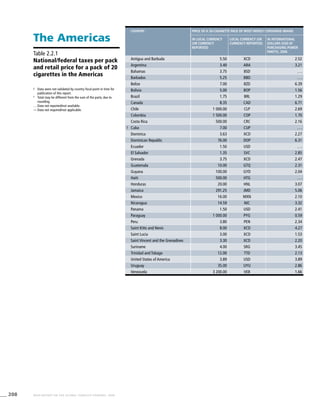
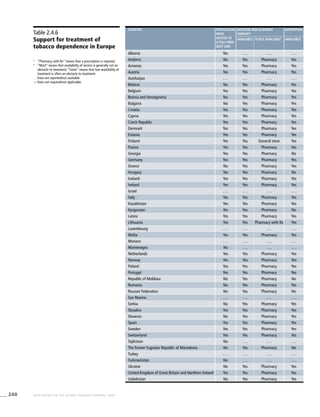
Africa
! Data were not validated by country focal point in time for
publication of this report.
. . . Data not available/not reported
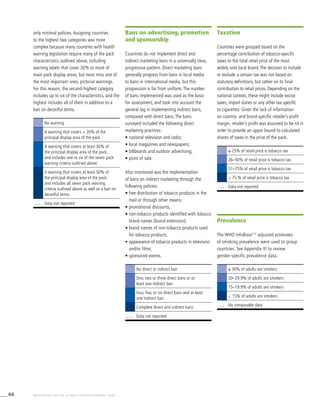
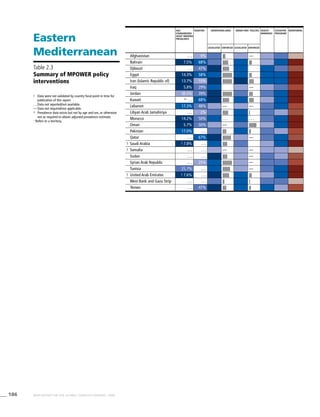
a Definition: Smoking any form of tobacco, including cigarettes,
cigars, pipes, bidis, etc.
b Definition: Smoking manufactured cigarettes.
c Definition: Smoking at the time of the survey, including daily
and non-daily smoking.
d Definition: Smoking everyday at the time of the survey.
e CI: Confidence Interval
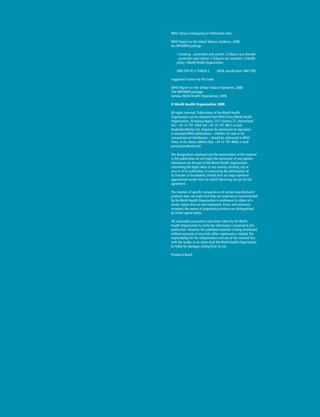
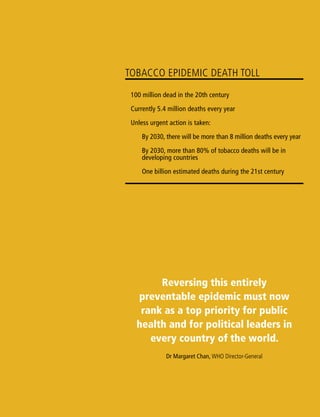
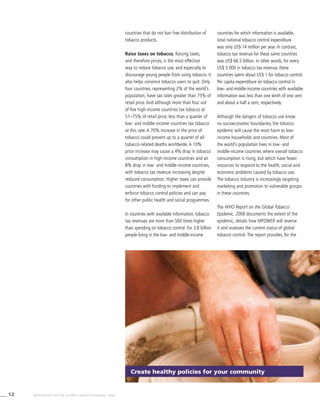
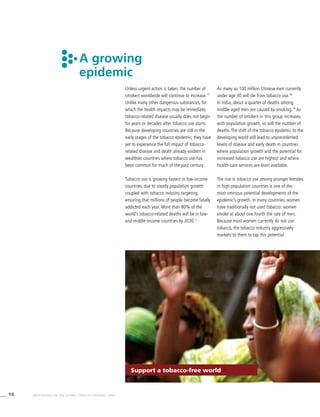
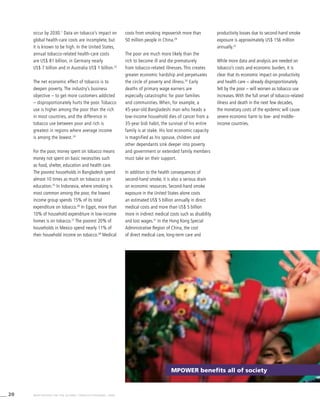
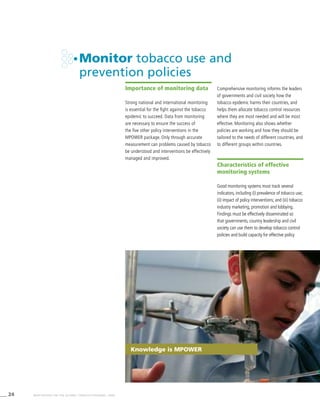
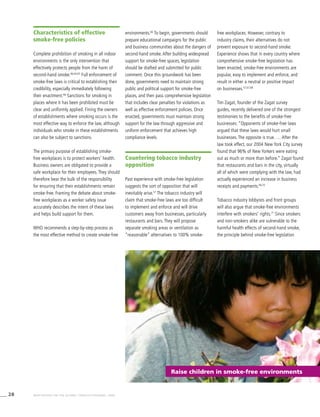
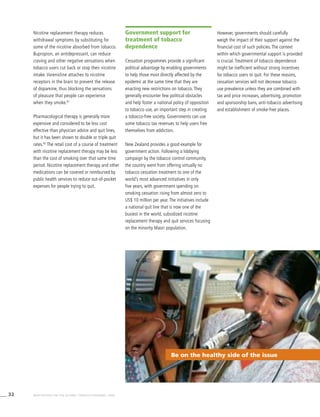
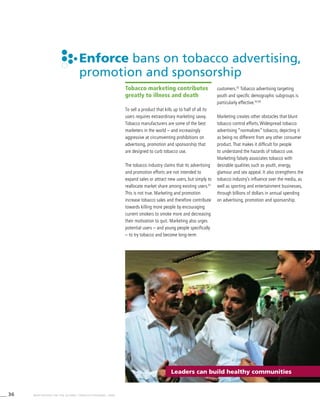
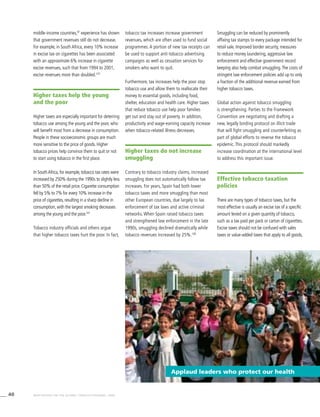
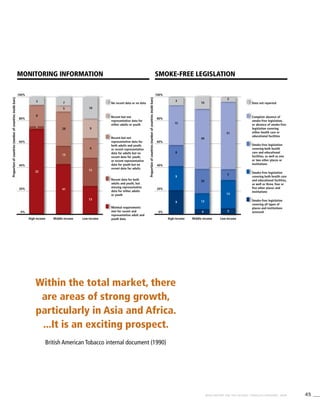
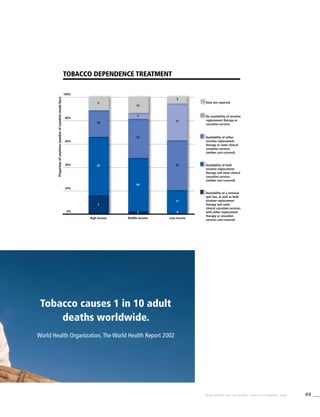
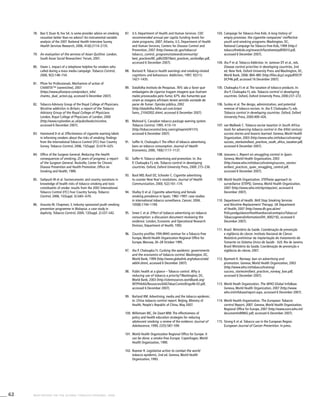
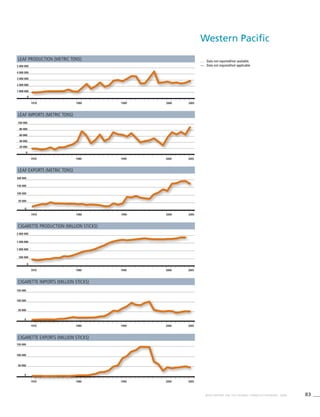
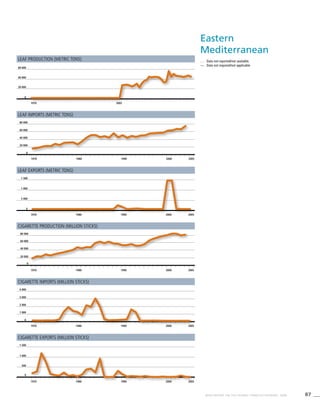
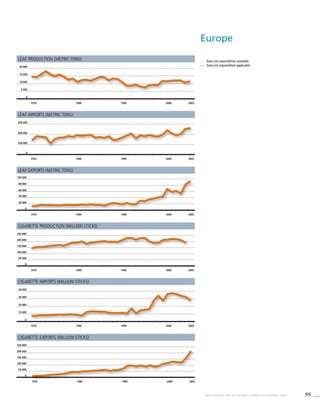
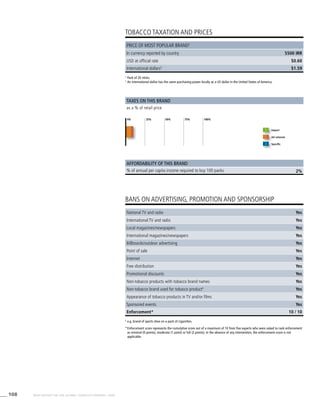
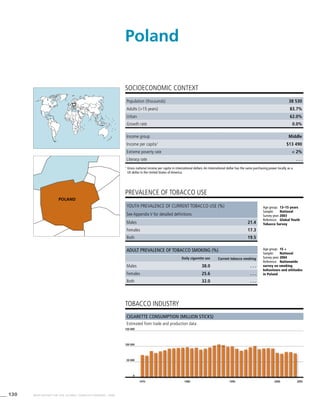
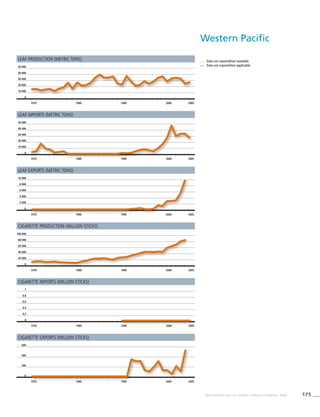
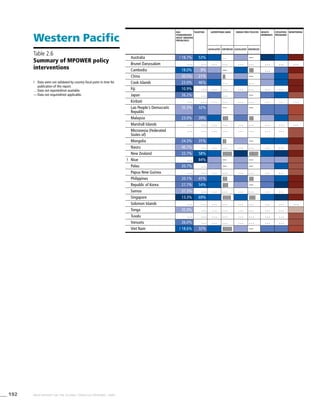
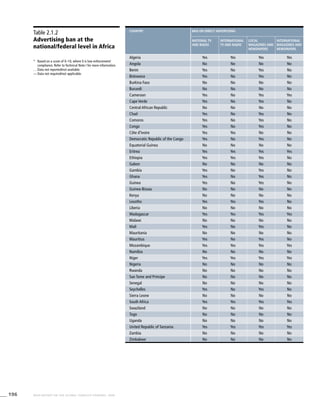
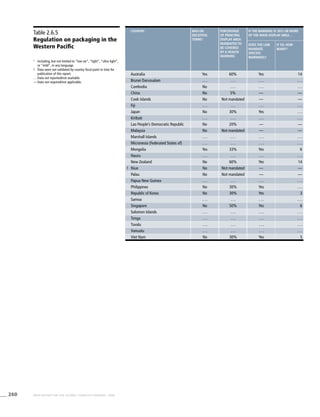
Table 3.1a
Adjusted prevalence estimates for
WHO Member States (Africa)
Country Smoking any tobacco product [%]a
Males Females
Currentc
95%CIe
Dailyd
95%CIe
Currentc
95%CIe
Algeria 31.3 (28.8-33.8) 29.5 (27.1-32.0) 0.3 (0.1-0.5)
Angola . . . . . . . . . . . . . . . . . .
Benin . . . . . . . . . . . . . . . . . .
Botswana . . . . . . . . . . . . . . . . . .
Burkina Faso 20.3 (18.4-22.2) 16.3 (14.6-18.0) 8.2 (7.0-9.4)
Burundi . . . . . . . . . . . . . . . . . .
Cameroon 12.9 (8.7-17.1) 10.6 (7.1-14.1) 2.7 (0.5-5.0)
Cape Verde . . . . . . . . . . . . . . . . . .
Central African Republic . . . . . . . . . . . . . . . . . .
Chad 14.0 (9.6-18.5) 10.9 (7.4-14.5) 2.2 (0.4-3.9)
Comoros 23.1 (19.5-26.7) 17.8 (14.7-20.9) 10.4 (7.3-13.6)
Congo 12.3 (8.0-16.6) 8.9 (5.7-12.2) 0.8 (0.0-1.6)
Côte d’Ivoire 15.4 (13.7-17.1) 11.4 (9.9-12.9) 1.7 (1.2-2.2)
Democratic Republic of the Congo 13.8 (9.0-18.6) 10.4 (6.6-14.1) 1.6 (0.2-3.0)
Equatorial Guinea . . . . . . . . . . . . . . . . . .
Eritrea 16.1 (13.6-18.7) 11.6 (9.5-13.7) 1.1 (0.5-1.8)
Ethiopia 5.8 (4.7-6.9) 3.8 (3.0-4.7) 0.6 (0.3-1.0)
Gabon . . . . . . . . . . . . . . . . . .
Gambia 27.8 (25.6-29.9) 25.5 (23.4-27.6) 2.3 (1.8-2.8)
Ghana 8.2 (6.9-9.6) 5.9 (4.7-7.0) 0.7 (0.3-1.0)
Guinea . . . . . . . . . . . . . . . . . .
Guinea-Bissau . . . . . . . . . . . . . . . . . .
Kenya 24.1 (21.2-27.0) 18.6 (16.1-21.0) 1.6 (1.0-2.3)
Lesotho . . . . . . . . . . . . . . . . . .
Liberia . . . . . . . . . . . . . . . . . .
Madagascar . . . . . . . . . . . . . . . . . .
Malawi 19.3 (16.9-21.7) 14.8 (12.9-16.8) 4.0 (2.8-5.2)
Mali 19.2 (17.3-21.1) 15.1 (13.4-16.8) 2.5 (1.7-3.3)
Mauritania 23.1 (20.6-25.5) 19.2 (16.9-21.4) 3.7 (2.8-4.5)
Mauritius 36.2 (32.3-40.0) 29.1 (25.9-32.4) 1.1 (0.6-1.7)
Mozambique 21.4 (19.2-23.6) 15.8 (14.1-17.5) 3.2 (2.4-4.1)
Namibia 31.0 (27.6-34.3) 24.8 (21.9-27.6) 9.3 (7.9-10.7)
Niger . . . . . . . . . . . . . . . . . .
Nigeria 11.7 (10.0-13.3) 8.6 (7.1-10.0) 0.9 (0.5-1.2)
Rwanda . . . . . . . . . . . . . . . . . .
Sao Tome and Principe 22.0 (9.5-34.5) 21.3 (9.0-33.5) 10.6 (0.0-23.7)
Senegal 19.9 (17.5-22.3) 15.8 (13.6-17.9) 1.3 (0.6-1.9)
! Seychelles 35.5 (30.5-40.5) 28.4 (23.9-32.9) 7.0 (4.4-9.7)
Sierra Leone . . . . . . . . . . . . . . . . . .
South Africa 27.1 (23.6-30.5) 20.9 (18.0-23.9) 8.9 (7.1-10.6)
Swaziland 11.9 (9.5-14.3) 7.8 (5.9-9.7) 2.1 (1.3-3.0)
Togo . . . . . . . . . . . . . . . . . .
Uganda 17.3 (15.0-19.5) 13.2 (11.3-15.1) 2.5 (1.8-3.2)
United Republic of Tanzania 21.2 (18.9-23.5) 16.1 (14.3-18) 3.3 (2.4-4.2)
! Zambia 17.0 (14.7-19.4) 12.8 (10.8-14.7) 3.5 (2.3-4.6)
Zimbabwe 20.8 (18.0-23.6) 15.8 (13.4-18.1) 2.9 (1.9-3.8)](https://image.slidesharecdn.com/ol25kkvlqguoxfywagtq-signature-60b0131a05a17be1631d7bde4d7608a3b2ae419a0a24dd90535582b58a53e895-poli-151021161413-lva1-app6891/85/MPOWER-Package-274-320.jpg)
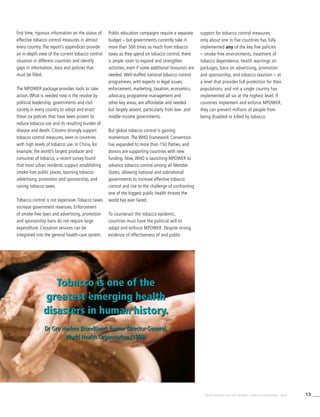
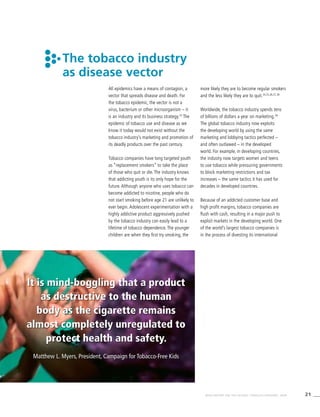
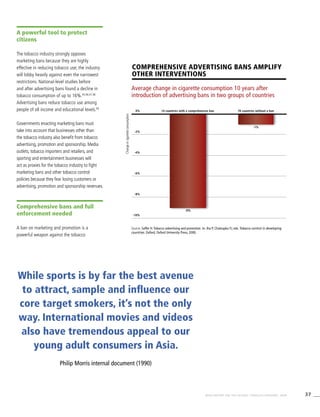
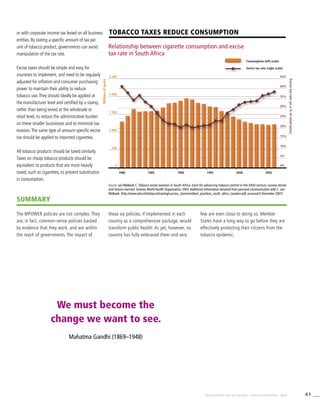
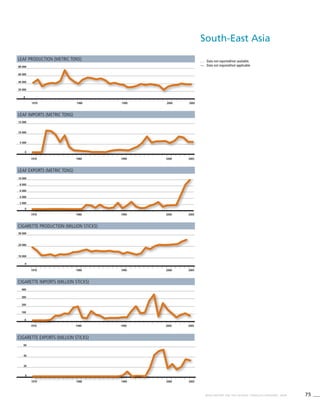
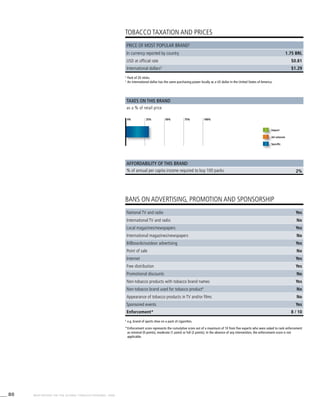
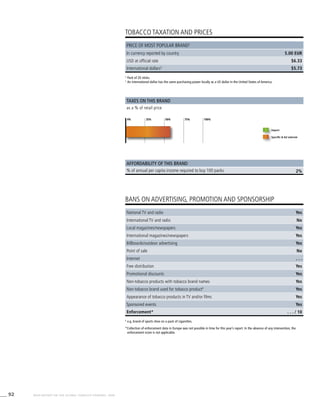
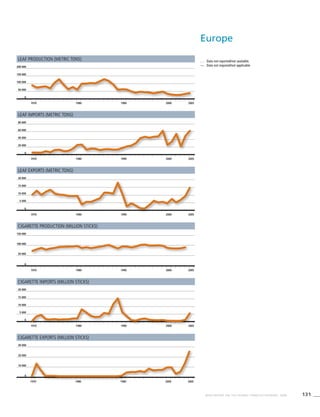
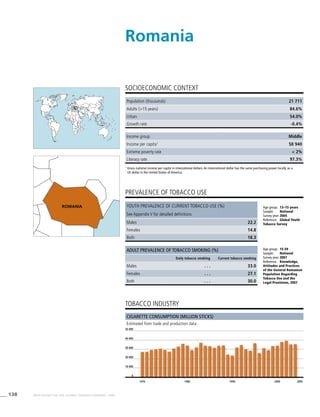
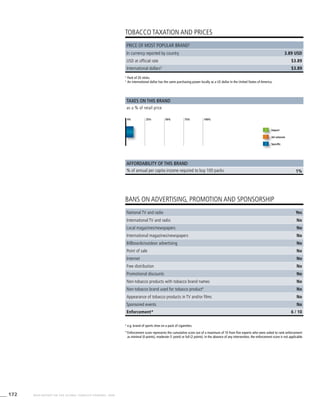
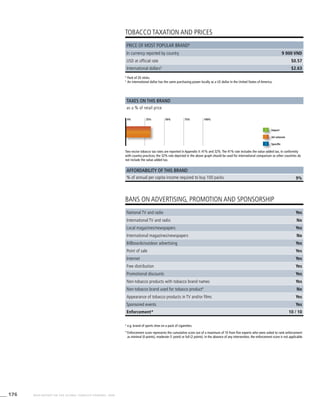
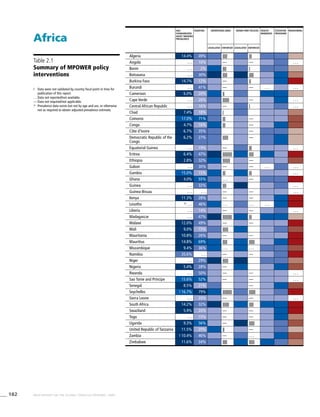
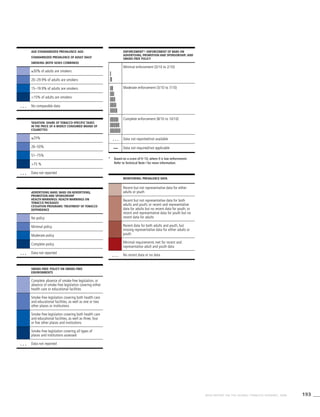
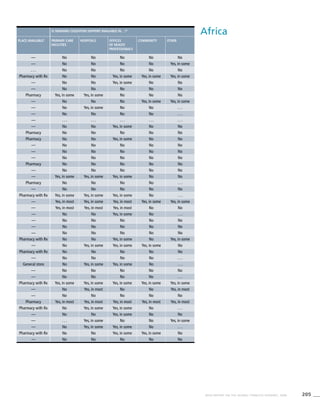
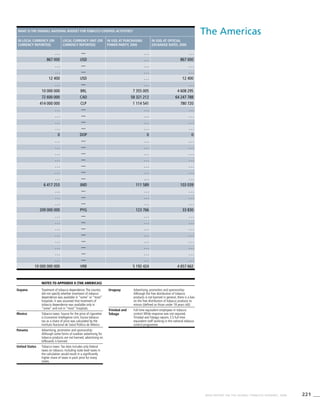
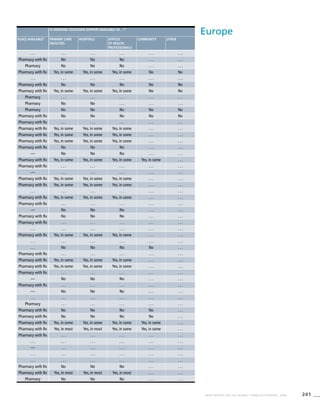
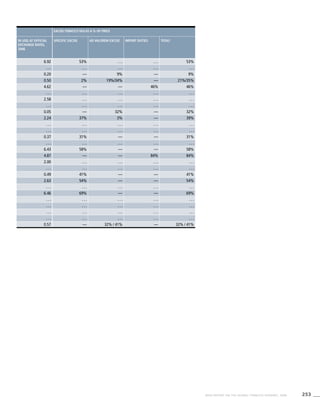
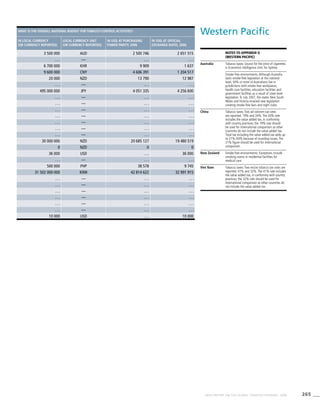
![269WHO REPORT ON THE GLOBAL TOBACCO EPIDEMIC, 2008
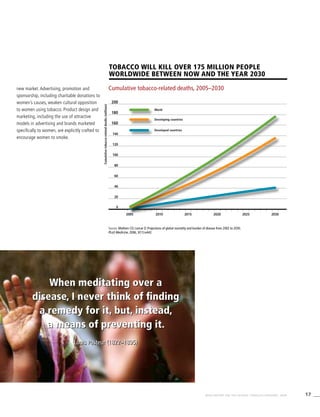
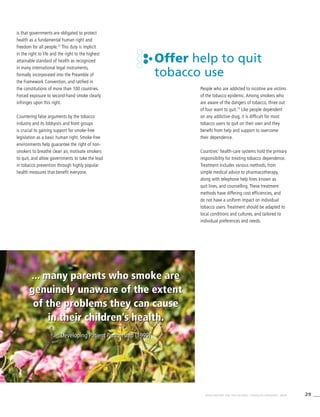
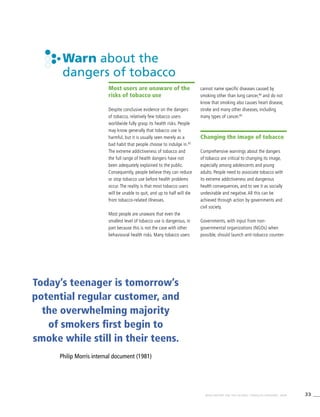
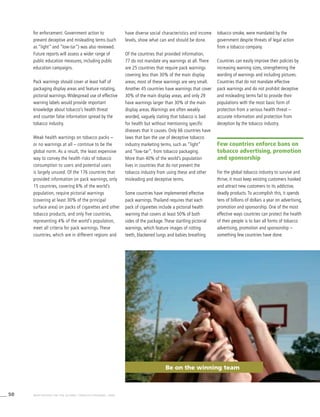
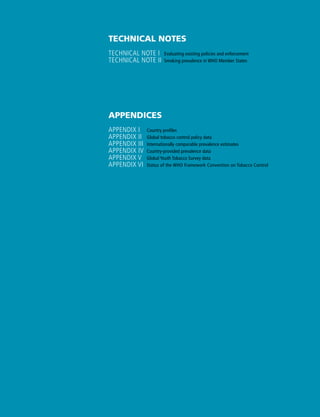
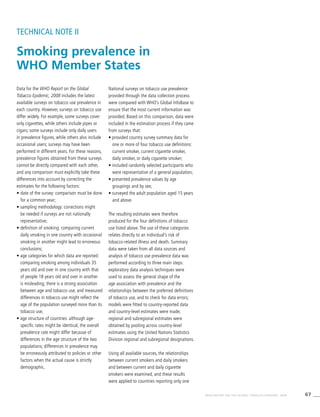
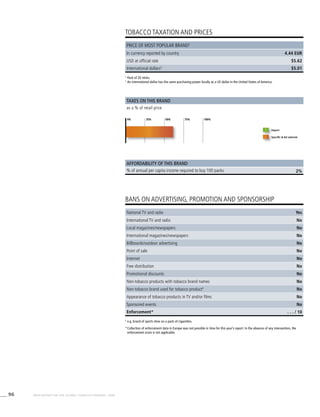
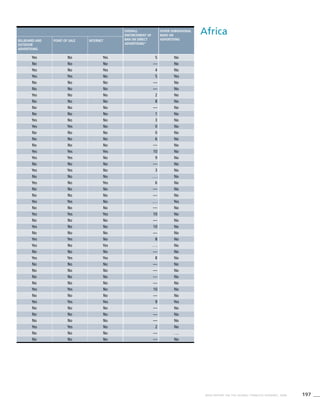
Smoking cigarettes [%]b
Males Females
Dailyd
95%CIe
Currentc
95%CIe
Dailyd
95%CIe
Currentc
95%CIe
Dailyd
95%CIe
0.2 (0.0-0.4) 28.7 (26.3-31.2) 27.0 (24.7-29.4) 0.2 (0.0-0.4) 0.2 (0.0-0.3)
. . . . . . . . . . . . . . . . . . . . . . . . . . . . . .
. . . . . . . . . . . . . . . . . . . . . . . . . . . . . .
. . . . . . . . . . . . . . . . . . . . . . . . . . . . . .
7.6 (6.5-8.8) 15.5 (13.8-17.1) 11.2 (9.8-12.6) 0.9 (0.5-1.2) 0.3 (0.1-0.6)
. . . . . . . . . . . . . . . . . . . . . . . . . . . . . .
2.0 (0.3-3.7) 10.1 (6.8-13.5) 7.6 (5.0-10.2) 1.8 (0.3-3.3) 1.3 (0.2-2.5)
. . . . . . . . . . . . . . . . . . . . . . . . . . . . . .
. . . . . . . . . . . . . . . . . . . . . . . . . . . . . .
1.5 (0.2-2.8) 11.2 (7.6-14.8) 8.0 (5.3-10.6) 1.1 (0.1-2.0) 0.7 (0.1-1.4)
8.6 (5.9-11.3) 20.3 (17.0-23.7) 15.1 (12.2-17.9) 4.0 (2.4-5.6) 2.7 (1.5-3.9)
0.5 (0.1-1.1) 9.9 (6.4-13.4) 6.6 (4.1-9.2) 0.4 (0.1-0.9) 0.2 (0.1-0.6)
1.1 (0.7-1.6) 12.5 (10.9-14.1) 8.7 (7.4-10.0) 0.6 (0.3-0.8) 0.2 (0.0-0.4)
1.2 (0.1-2.3) 11.2 (7.1-15.2) 7.7 (4.7-10.6) 0.4 (0.1-1.0) 0.3 (0.1-0.7)
. . . . . . . . . . . . . . . . . . . . . . . . . . . . . .
0.6 (0.1-1.0) 15.2 (12.7-17.6) 10.8 (8.8-12.9) 0.7 (0.2-1.2) 0.3 (0.0-0.6)
0.3 (0.1-0.5) 5.3 (4.3-6.3) 3.5 (2.7-4.2) 0.4 (0.1-0.7) 0.2 (0.0-0.3)
. . . . . . . . . . . . . . . . . . . . . . . . . . . . . .
1.8 (1.3-2.2) 18.0 (16.2-19.7) 14.4 (12.8-16) 0.5 (0.3-0.8) 0.2 (0.0-0.4)
0.3 (0.1-0.5) 6.0 (4.9-7.1) 3.8 (2.9-4.7) 0.5 (0.2-0.8) 0.2 (0.0-0.4)
. . . . . . . . . . . . . . . . . . . . . . . . . . . . . .
. . . . . . . . . . . . . . . . . . . . . . . . . . . . . .
0.9 (0.5-1.4) 22.2 (19.4-24.9) 16.7 (14.5-19.0) 0.9 (0.5-1.3) 0.4 (0.2-0.7)
. . . . . . . . . . . . . . . . . . . . . . . . . . . . . .
. . . . . . . . . . . . . . . . . . . . . . . . . . . . . .
. . . . . . . . . . . . . . . . . . . . . . . . . . . . . .
3.3 (2.3-4.3) 16.6 (14.5-18.8) 12.3 (10.5-14.0) 1.6 (1-2.1.0) 1.0 (0.6-1.5)
1.7 (1.1-2.4) 15.3 (13.6-17.0) 11.1 (9.6-12.6) 0.8 (0.3-1.2) 0.3 (0.0-0.6)
2.8 (2.1-3.5) 17.9 (15.7-20.1) 13.7 (11.8-15.6) 0.8 (0.4-1.2) 0.3 (0.1-0.6)
0.6 (0.2-1.0) 36.2 (32.3-40.0) 29.1 (25.9-32.4) 1.1 (0.6-1.7) 0.6 (0.2-1.0)
2.0 (1.5-2.6) 20.0 (17.9-22.1) 14.6 (13.0-16.2) 1.5 (1.1-2.0) 0.8 (0.5-1.1)
7.5 (6.3-8.7) 28.9 (25.7-32.1) 22.6 (19.9-25.3) 7.9 (6.7-9.2) 5.9 (4.9-7.0)
. . . . . . . . . . . . . . . . . . . . . . . . . . . . . .
0.6 (0.3-0.9) 9.0 (7.5-10.4) 6.0 (4.8-7.2) 0.2 (0.0-0.4) 0.1 (0.0-0.2)
. . . . . . . . . . . . . . . . . . . . . . . . . . . . . .
8.6 (0.0-20.6) 22.0 (9.5-34.5) 21.3 (9.0-33.5) 10.6 (0.0-23.7) 8.6 (0.0-20.6)
0.8 (0.3-1.3) 15.7 (13.6-17.9) 11.5 (9.7-13.4) 0.6 (0.1-1.0) 0.2 (0.0-0.5)
5.1 (2.9-7.2) 31.5 (26.7-36.2) 24.4 (20.3-28.6) 3.0 (1.4-4.5) 1.8 (0.6-2.9)
. . . . . . . . . . . . . . . . . . . . . . . . . . . . . .
6.7 (5.1-8.2) 24.9 (21.6-28.1) 18.8 (16.0-21.6) 7.6 (6.0-9.2) 5.3 (4.0-6.6)
1.3 (0.6-1.9) 11.0 (8.7-13.3) 7.1 (5.2-8.9) 1.9 (1.1-2.7) 1.0 (0.5-1.6)
. . . . . . . . . . . . . . . . . . . . . . . . . . . . . .
1.6 (1.1-2.1) 15.7 (13.6-17.8) 11.7 (9.9-13.5) 1.2 (0.8-1.5) 0.6 (0.4-0.9)
2.4 (1.7-3.2) 18.8 (16.7-20.9) 13.8 (12.1-15.5) 1.4 (0.9-1.8) 0.8 (0.5-1.1)
2.5 (1.6-3.4) 15.0 (12.8-17.1) 10.8 (9.0-12.6) 1.5 (0.9-2.2) 0.9 (0.4-1.4)
2.0 (1.3-2.7) 18.4 (15.8-20.9) 13.4 (11.3-15.6) 1.3 (0.8-1.9) 0.8 (0.4-1.1)](https://image.slidesharecdn.com/ol25kkvlqguoxfywagtq-signature-60b0131a05a17be1631d7bde4d7608a3b2ae419a0a24dd90535582b58a53e895-poli-151021161413-lva1-app6891/85/MPOWER-Package-275-320.jpg)
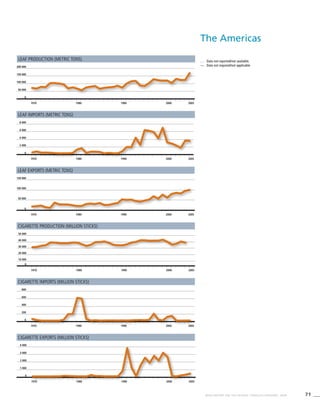
![270 WHO REPORT ON THE GLOBAL TOBACCO EPIDEMIC, 2008
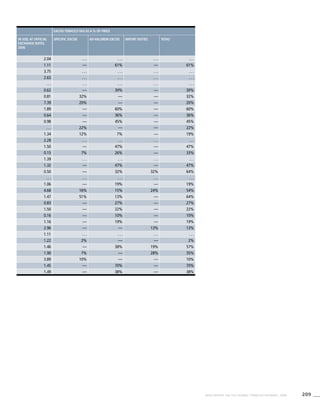
The Americas
! Data were not validated by country focal point in time for
publication of this report.
. . . Data not available/not reported
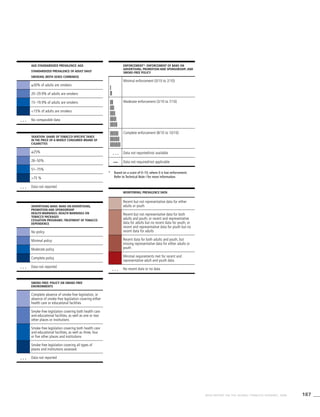
a Definition: Smoking any form of tobacco, including cigarettes,
cigars, pipes, bidis, etc.
b Definition: Smoking manufactured cigarettes.
c Definition: Smoking at the time of the survey, including daily
and non-daily smoking.
d Definition: Smoking everyday at the time of the survey.
e CI: Confidence Interval
* Current smoking prevalence not validated
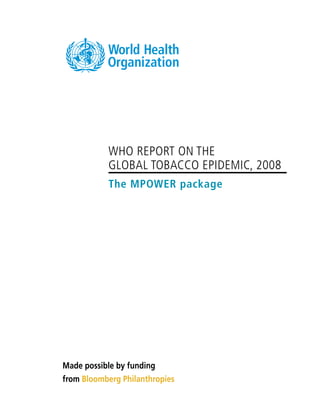
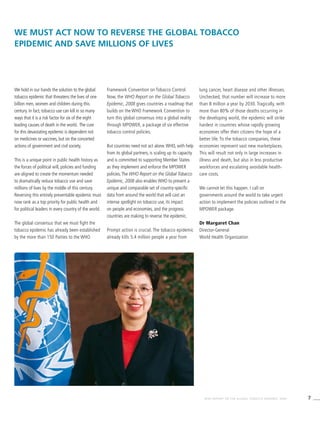
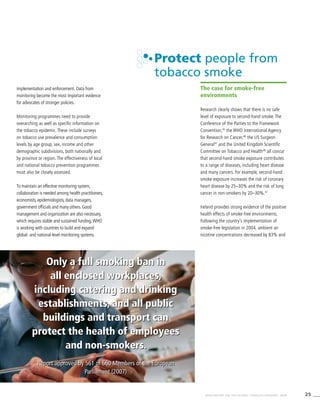
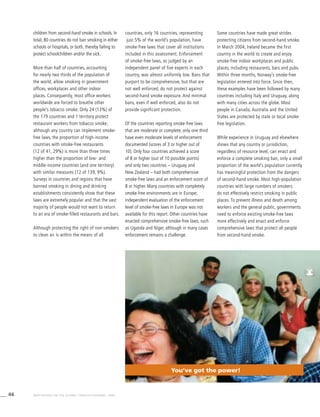
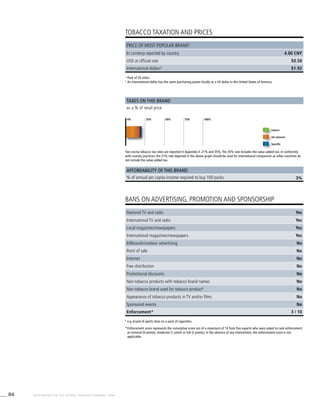
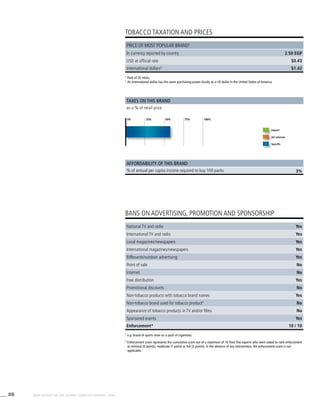
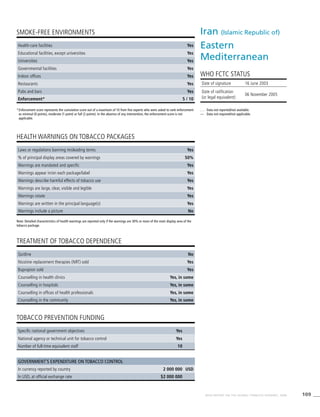
Table 3.2a
Adjusted prevalence
estimates for WHO Member
States (The Americas)
Country Smoking any tobacco product [%]a
Males Females
Currentc
95%CIe
Dailyd
95%CIe
Currentc
95%CIe
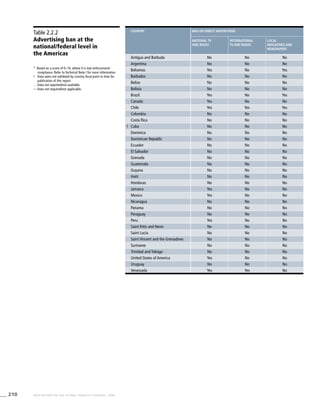
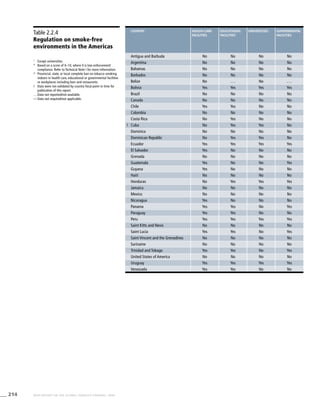
Antigua and Barbuda . . . . . . . . . . . . . . . . . .
Argentina 34.6 (31.1-38.1) 27.0 (24.3-29.8) 24.6 (21.7-27.5)
Bahamas . . . . . . . . . . . . . . . . . .
! Barbados 18.5 (10.1-26.9) 16.6 (8.9-24.3) 3.3 (1.5-5.1)
Belize . . . . . . . . . . . . . . . . . .
Bolivia 35.8 (27.9-43.8) 32.6 (25.3-39.9) 29.8 (26.3-33.4)
* Brazil . . . . . . 16.8 (11.5-22.0) . . . . . .
! Canada . . . . . . . . . . . . . . . . . .
! Chile 42.6 (34.0-51.1) 40.1 (32.0-48.2) 33.3 (27.9-38.6)
Colombia . . . . . . . . . . . . . . . . . .
Costa Rica 26.7 (22.5-30.9) 10.0 (8.2-11.9) 7.3 (5.8-8.9)
Cuba 44.8 (27.1-62.4) 44.4 (26.9-61.9) 29.6 (22.6-36.6)
Dominica . . . . . . . . . . . . . . . . . .
Dominican Republic 14.9 (8.7-21.2) 13.1 (7.6-18.7) 11.0 (7.9-14.1)
Ecuador 23.9 (20.7-27.0) 5.8 (4.5-7.0) 5.4 (4.3-6.5)
El Salvador . . . . . . . . . . . . . . . . . .
Grenada . . . . . . . . . . . . . . . . . .
Guatemala 24.8 (20.8-28.9) 7.8 (6.1-9.4) 3.9 (3.0-4.8)
Guyana . . . . . . . . . . . . . . . . . .
Haiti . . . . . . . . . . . . . . . . . .
Honduras . . . . . . . . . . . . 3.3 (1.8-4.8)
Jamaica 19.6 (11.1-28.1) 17.9 (10.0-25.8) 8.9 (6.1-11.7)
Mexico 37.6 (30.2-45.0) 22.1 (19.0-25.3) 12.4 (8.9-15.9)
Nicaragua . . . . . . . . . . . . . . . . . .
Panama . . . . . . . . . . . . . . . . . .
Paraguay 33.4 (29.6-37.3) 22.1 (19.3-24.9) 14.9 (12.7-17.1)
Peru . . . . . . . . . . . . . . . . . .
Saint Kitts and Nevis . . . . . . . . . . . . . . . . . .
Saint Lucia 28.0 (16.3-39.7) 26.9 (15.6-38.2) 11.0 (7.3-14.6)
Saint Vincent and the Grenadines 17.6 (9.2-26.1) 16.0 (8.2-23.8) 5.2 (2.4-7.9)
Suriname . . . . . . . . . . . . . . . . . .
Trinidad and Tobago 36.5 (21.9-51.1) 36.3 (21.8-50.9) 7.3 (5.0-9.7)
United States of America 25.7 (22.6-28.8) 20.5 (19.0-22.0) 20.3 (17.0-23.6)
Uruguay 36.6 (32.2-41.0) 34.3 (30.1-38.5) 25.8 (22.1-29.6)
Venezuela 33.4 (27.5-39.3) 26.0 (20.8-31.3) 27.8 (21.8-33.8)](https://image.slidesharecdn.com/ol25kkvlqguoxfywagtq-signature-60b0131a05a17be1631d7bde4d7608a3b2ae419a0a24dd90535582b58a53e895-poli-151021161413-lva1-app6891/85/MPOWER-Package-276-320.jpg)
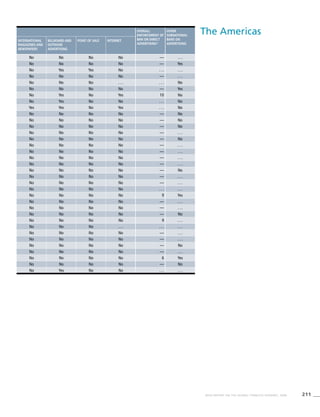
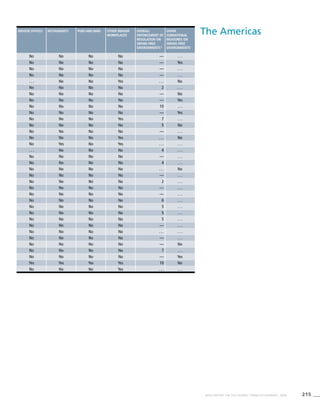
![271WHO REPORT ON THE GLOBAL TOBACCO EPIDEMIC, 2008
Smoking cigarettes [%]b
Males Females
Dailyd
95%CIe
Currentc
95%CIe
Dailyd 95%CIe
Currentc
95%CIe
Dailyd
95%CIe
. . . . . . . . . . . . . . . . . . . . . . . . . . . . . .
21.1 (18.5-23.6) 34.3 (30.8-37.8) 26.1 (23.4-28.8) 22.7 (20.0-25.4) 18.1 (15.9-20.2)
. . . . . . . . . . . . . . . . . . . . . . . . . . . . . .
2.7 (1.1-4.3) 17.1 (9.2-25.0) 15.2 (8.1-22.3) 2.5 (1.0-4.0) 2.0 (0.7-3.4)
. . . . . . . . . . . . . . . . . . . . . . . . . . . . . .
27.0 (23.7-30.2) 35.7 (27.8-43.6) 32.1 (24.9-39.3) 27.3 (24.0-30.6) 24.1 (21.2-27)
9.5 (5.7-13.3) . . . . . . 16.3 (11.3-21.3) . . . . . . 8.4 (5.1-11.8)
. . . . . . . . . . . . . . . . . . . . . . . . . . . . . .
32.8 (27.5-38) 42.2 (33.7-50.7) 39.4 (31.5-47.4) 30.1 (25.2-35.0) 29.1 (24.4-33.9)
. . . . . . . . . . . . . . . . . . . . . . . . . . . . . .
2.5 (1.7-3.2) 26.7 (22.5-30.9) 10.0 (8.2-11.9) 7.3 (5.8-8.9) 2.5 (1.7-3.2)
26.1 (19.9-32.3) 37.0 (22.4-51.6) 36.5 (22.1-50.8) 27.3 (20.8-33.8) 24.0 (18.3-29.8)
. . . . . . . . . . . . . . . . . . . . . . . . . . . . . .
9.4 (6.7-12.1) 13.6 (7.9-19.3) 11.8 (6.7-16.8) 9.4 (6.7-12.1) 8.0 (5.6-10.4)
1.3 (0.8-1.8) 23.6 (20.5-26.7) 5.5 (4.3-6.7) 5.2 (4.1-6.3) 1.2 (0.7-1.6)
. . . . . . . . . . . . . . . . . . . . . . . . . . . . . .
. . . . . . . . . . . . . . . . . . . . . . . . . . . . . .
0.8 (0.5-1.2) 24.8 (20.8-28.9) 7.8 (6.1-9.4) 3.9 (3.0-4.8) 0.8 (0.5-1.2)
. . . . . . . . . . . . . . . . . . . . . . . . . . . . . .
. . . . . . . . . . . . . . . . . . . . . . . . . . . . . .
0.6 (0.3-0.9) . . . . . . . . . . . . 3.3 (1.8-4.8) 0.6 (0.3-0.9)
7.5 (5.1-10.0) 17.7 (9.9-25.5) 15.9 (8.8-23.0) 7.5 (5.0-9.9) 6.3 (4.1-8.5)
6.1 (5.2-7.1) 37.6 (30.2-45.0) 22.1 (19.0-25.3) 12.4 (8.9-15.9) 6.1 (5.2-7.1)
. . . . . . . . . . . . . . . . . . . . . . . . . . . . . .
. . . . . . . . . . . . . . . . . . . . . . . . . . . . . .
6.7 (5.5-7.9) 33.2 (29.4-37.0) 21.3 (18.6-24.0) 14.4 (12.2-16.5) 5.8 (4.7-6.9)
. . . . . . . . . . . . . . . . . . . . . . . . . . . . . .
. . . . . . . . . . . . . . . . . . . . . . . . . . . . . .
9.5 (6.2-12.8) 25.0 (14.4-35.6) 23.6 (13.6-33.6) 8.2 (5.3-11.2) 7.0 (4.4-9.6)
4.4 (1.9-6.9) 17.6 (9.2-26.1) 16.0 (8.2-23.8) 5.2 (2.4-7.9) 4.4 (1.9-6.9)
. . . . . . . . . . . . . . . . . . . . . . . . . . . . . .
6.2 (4.1-8.2) 32.6 (19.5-45.7) 32.3 (19.3-45.2) 5.6 (3.7-7.6) 4.7 (3.0-6.4)
15.8 (13.9-17.7) 25.7 (22.6-28.8) 20.5 (19.0-22.0) 20.3 (17.0-23.6) 15.8 (13.9-17.7)
24.3 (20.7-27.8) 36.6 (32.2-41.0) 34.3 (30.1-38.5) 25.8 (22.1-29.6) 24.3 (20.7-27.8)
25.1 (19.5-30.8) 33.4 (27.5-39.3) 26.0 (20.8-31.3) 27.8 (21.8-33.8) 25.1 (19.5-30.8)](https://image.slidesharecdn.com/ol25kkvlqguoxfywagtq-signature-60b0131a05a17be1631d7bde4d7608a3b2ae419a0a24dd90535582b58a53e895-poli-151021161413-lva1-app6891/85/MPOWER-Package-277-320.jpg)
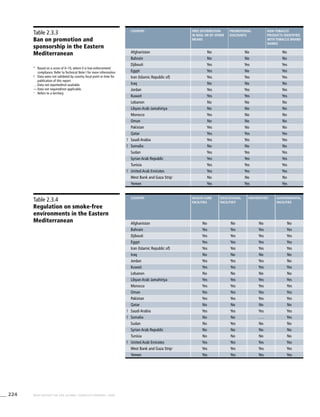
![272 WHO REPORT ON THE GLOBAL TOBACCO EPIDEMIC, 2008
Eastern
Mediterranean
! Data were not validated by country focal point in time for
publication of this report.
. . . Data not available/not reported
a Definition: Smoking any form of tobacco, including cigarettes,
cigars, pipes, bidis, etc.
b Definition: Smoking manufactured cigarettes.
c Definition: Smoking at the time of the survey, including daily
and non-daily smoking.
d Definition: Smoking everyday at the time of the survey.
e CI: Confidence Interval
>
Refers to a territory.
Table 3.3a
Adjusted prevalence estimates
for WHO Member States (Eastern
Mediterranean)
Country Smoking any tobacco product [%]a
Males Females
Currentc
95%CIe
Dailyd
95%CIe
Currentc
95%CIe
Afghanistan . . . . . . . . . . . . . . . . . .
Bahrain 26.2 (22.5-30.0) 13.4 (11.5-15.3) 2.7 (1.1-4.2)
Djibouti . . . . . . . . . . . . . . . . . .
Egypt 26.0 (23.8-28.1) 24.4 (22.3-26.5) 4.1 (3.0-5.2)
Iran (Islamic Republic of) 26.2 (21.3-31.0) 20.2 (16.5-23.9) 4.5 (3.1-6.0)
Iraq 25.7 (21.6-29.9) 9.9 (8.0-11.8) 1.9 (0.6-3.1)
Jordan 61.7 (52.8-70.7) 61.7 (52.8-70.7) 7.9 (3.2-12.6)
Kuwait . . . . . . . . . . . . . . . . . .
Lebanon 29.0 (24.2-33.9) 27.3 (22.7-31.9) 6.9 (2.7-11.2)
Libyan Arab Jamahiriya . . . . . . . . . . . . . . . . . .
Morocco 29.5 (27.3-31.8) 27.9 (25.7-30.1) 0.3 (0.1-0.6)
Oman 24.8 (21.0-28.6) 11.4 (9.4-13.3) 1.0 (0.3-1.7)
Pakistan 31.7 (25.6-37.7) 25.3 (20.4-30.1) 5.2 (3.4-7.1)
Qatar . . . . . . . . . . . . . . . . . .
! Saudi Arabia 25.6 (21.8-29.3) 12.9 (11.0-14.9) 3.2 (1.3-5.2)
Somalia . . . . . . . . . . . . . . . . . .
Sudan . . . . . . . . . . . . . . . . . .
Syrian Arab Republic 42.0 (16.8-67.1) 38.6 (31.5-45.6) . . . . . .
Tunisia 51.0 (48.3-53.8) 49.2 (46.5-51.9) 1.7 (1.1-2.3)
! United Arab Emirates 27.2 (21.9-32.5) 16.0 (12.2-19.8) 2.4 (0.5-4.4)
West Bank and Gaza Strip>
. . . . . . . . . . . . . . . . . .
Yemen . . . . . . . . . . . . . . . . . .](https://image.slidesharecdn.com/ol25kkvlqguoxfywagtq-signature-60b0131a05a17be1631d7bde4d7608a3b2ae419a0a24dd90535582b58a53e895-poli-151021161413-lva1-app6891/85/MPOWER-Package-278-320.jpg)
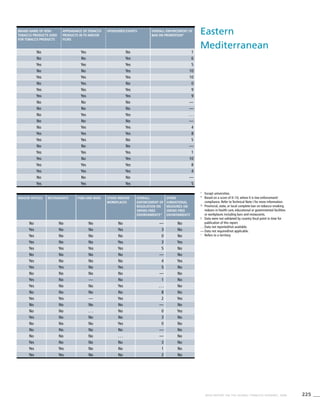
![273WHO REPORT ON THE GLOBAL TOBACCO EPIDEMIC, 2008
Smoking cigarettes [%]b
Males Females
Dailyd
95%CIe
Currentc
95%CIe
Dailyd
95%CIe
Currentc
95%CIe
Dailyd
95%CIe
. . . . . . . . . . . . . . . . . . . . . . . . . . . . . .
1.4 (0.6-2.3) 25.7 (22.1-29.4) 12.0 (10.3-13.7) 2.1 (0.9-3.4) 1.0 (0.4-1.5)
. . . . . . . . . . . . . . . . . . . . . . . . . . . . . .
4.1 (3.0-5.2) 22.7 (20.7-24.7) 21.1 (19.2-23.1) 3.5 (2.5-4.5) 3.5 (2.5-4.5)
3.2 (2.1-4.2) 21.4 (17.5-25.4) 15.8 (12.9-18.7) 1.7 (1.1-2.2) 1.0 (0.6-1.3)
1.0 (0.3-1.7) 25.2 (21.1-29.3) 8.8 (7.1-10.6) 1.3 (0.4-2.1) 0.6 (0.1-1.1)
7.9 (3.2-12.6) 61.4 (52.5-70.3) 61.4 (52.5-70.3) 7.9 (3.2-12.6) 7.9 (3.2-12.6)
. . . . . . . . . . . . . . . . . . . . . . . . . . . . . .
6.9 (2.7-11.2) 29.0 (24.2-33.9) 27.3 (22.7-31.9) 6.9 (2.7-11.2) 6.9 (2.7-11.2)
. . . . . . . . . . . . . . . . . . . . . . . . . . . . . .
0.3 (0.1-0.5) 26.8 (24.6-28.9) 25.2 (23.1-27.3) 0.3 (0.0-0.5) 0.2 (0.0-0.4)
0.2 (0.0-0.4) 24.4 (20.6-28.1) 10.3 (8.5-12.0) 0.3 (0.1-0.6) 0.0 (0.0-0.1)
3.9 (2.4-5.3) 26.7 (21.5-31.8) 20.3 (16.4-24.3) 2.2 (1.3-3.1) 1.4 (0.8-2.0)
. . . . . . . . . . . . . . . . . . . . . . . . . . . . . .
1.9 (0.8-3.1) 25.2 (21.4-28.9) 11.8 (10.0-13.6) 3.0 (1.2-4.8) 1.7 (0.7-2.8)
. . . . . . . . . . . . . . . . . . . . . . . . . . . . . .
. . . . . . . . . . . . . . . . . . . . . . . . . . . . . .
. . . . . . 41.2 (16.5-65.9) 37.8 (30.9-44.8) . . . . . . . . . . . .
1.6 (1.1-2.2) 47.4 (44.7-50.1) 45.5 (42.9-48.2) 1.0 (0.6-1.4) 0.9 (0.5-1.4)
1.1 (0.0-2.1) 26.8 (21.6-32.1) 14.9 (11.3-18.5) 1.7 (0.2-3.2) 0.5 (0.0-1.2)
. . . . . . . . . . . . . . . . . . . . . . . . . . . . . .
. . . . . . . . . . . . . . . . . . . . . . . . . . . . . .](https://image.slidesharecdn.com/ol25kkvlqguoxfywagtq-signature-60b0131a05a17be1631d7bde4d7608a3b2ae419a0a24dd90535582b58a53e895-poli-151021161413-lva1-app6891/85/MPOWER-Package-279-320.jpg)
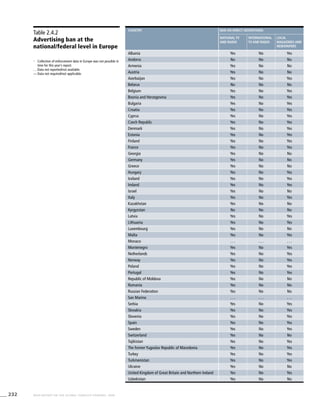
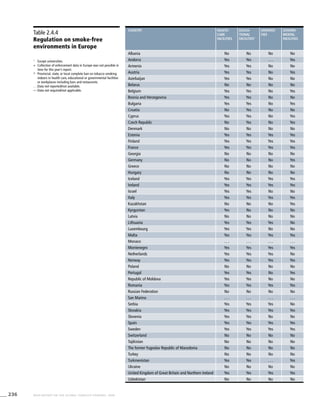
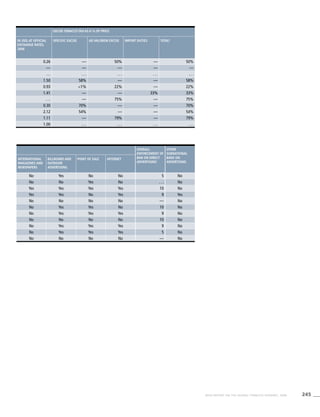
![274 WHO REPORT ON THE GLOBAL TOBACCO EPIDEMIC, 2008
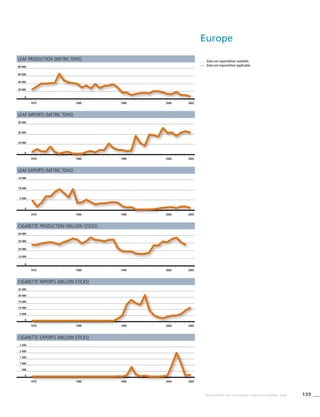
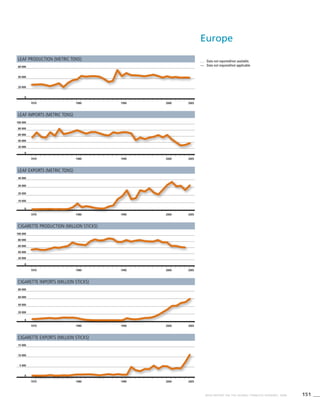
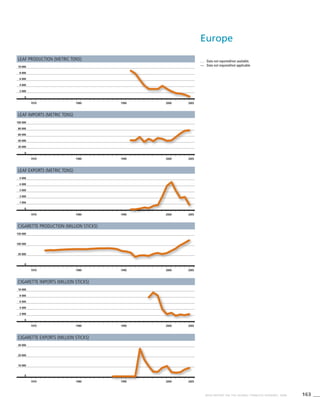
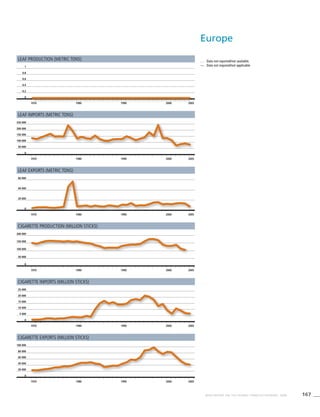
Europe
! Data were not validated by country focal point in time for
publication of this report.
. . . Data not available/not reported
a Definition: Smoking any form of tobacco, including cigarettes,
cigars, pipes, bidis, etc.
b Definition: Smoking manufactured cigarettes.
c Definition: Smoking at the time of the survey, including daily
and non-daily smoking.
d Definition: Smoking everyday at the time of the survey.
e CI: Confidence Interval
Table 3.4a
Adjusted prevalence estimates
for WHO Member States (Europe)
Country Smoking any tobacco product [%]a
Males Females
Currentc
95%CIe
Dailyd
95%CIe
Currentc
95%CIe
Albania 39.6 (26.6-52.7) 36.5 (24.5-48.5) 3.9 (0.6-7.2)
Andorra 35.7 (30.1-41.3) 32.2 (26.9-37.5) 24.5 (19.8-29.2)
Armenia 52.9 (45.2-60.5) 47.0 (40.2-53.8) 4.0 (1.5-6.5)
Austria 45.5 (43.3-47.6) 39.9 (37.8-42.0) 35.8 (33.9-37.8)
Azerbaijan . . . . . . . . . . . . 0.9 (0.3-1.5)
Belarus 63.6 (53.2-73.9) 57.6 (48.1-67.1) 17.4 (12.2-22.6)
Belgium 28.8 (25.8-31.9) 22.0 (19.6-24.4) 21.5 (19.6-23.5)
Bosnia and Herzegovina 48.8 (42.3-55.3) 45.1 (39.0-51.2) 32.0 (26.3-37.8)
Bulgaria 44.6 (36.7-52.5) 38.8 (31.8-45.9) 21.8 (15.3-28.3)
Croatia 37.5 (35.7-39.3) 33.8 (32.0-35.5) 25.4 (24.3-26.5)
Cyprus . . . . . . . . . . . . . . . . . .
Czech Republic 35.9 (29.4-42.5) 29.7 (24.1-35.3) 23.4 (16.4-30.3)
Denmark 35.8 (33.8-37.8) 28.8 (26.9-30.7) 29.4 (27.5-31.2)
Estonia 49.0 (46.2-51.7) 41.3 (38.6-44.0) 25.3 (23.2-27.4)
Finland 30.7 (28.4-33.0) 24.0 (21.9-26.2) 21.0 (19.1-22.9)
France 34.4 (33.6-35.2) 28.3 (27.6-29.0) 22.7 (22.0-23.4)
Georgia 55.8 (47.3-64.3) 49.7 (42.0-57.4) 5.8 (2.2-9.5)
Germany 36.0 (33.5-38.4) 29.5 (27.5-31.6) 22.0 (20.6-23.3)
Greece 62.4 (54.9-69.9) 59.4 (52.2-66.5) 32.8 (28.4-37.1)
Hungary 44.6 (37.4-51.8) 38.2 (31.9-44.4) 30.5 (22.0-38.9)
Iceland 25.7 (23.2-28.1) 19.2 (17.0-21.4) 25.2 (22.9-27.5)
Ireland 25.0 (20.1-29.8) 18.6 (16.2-21.0) 23.8 (20.7-26.9)
Israel 30.9 (26.1-35.8) 27.3 (22.9-31.7) 17.6 (7.1-28.1)
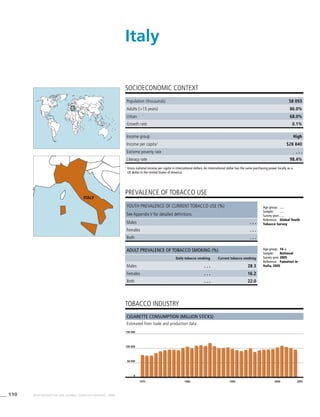
Italy 30.6 (28.4-32.8) 27.0 (25.0-29.0) 16.4 (15.2-17.7)
Kazakhstan 43.9 (35.5-52.3) 37.0 (29.8-44.2) 9.8 (6.4-13.1)
Kyrgyzstan 45.0 (36.9-53.2) 38.6 (31.6-45.7) 2.2 (1.3-3.0)
Latvia 53.2 (44.6-61.8) 45.9 (38.3-53.5) 19.1 (16.3-21.9)
Lithuania 44.4 (37.3-51.5) 36.7 (30.5-42.8) 17.6 (15.0-20.2)
Luxembourg 37.1 (33.6-40.7) 31.3 (28.1-34.5) 27.3 (24.5-30.1)
Malta 32.0 (27.7-36.4) 28.5 (24.7-32.3) 21.8 (18.7-24.9)
Monaco . . . . . . . . . . . . . . . . . .
Montenegro . . . . . . . . . . . . . . . . . .
Netherlands 38.3 (37.4-39.3) 31.5 (30.6-32.4) 28.5 (27.6-29.4)
Norway 32.7 (28.3-37.1) 25.8 (22.2-29.4) 28.3 (24.5-32.1)
Poland 44.0 (35.3-52.7) 37.8 (29.9-45.7) 25.6 (17.0-34.2)
Portugal 38.5 (33.2-43.9) 35.0 (29.9-40.1) 24.3 (20.8-27.9)
Republic of Moldova 45.9 (38.5-53.3) 39.3 (33.0-45.7) 5.3 (3.8-6.8)
Romania 45.2 (37.8-52.6) 38.7 (32.2-45.2) 23.6 (16.7-30.5)
Russian Federation 70.2 (59.2-81.3) 65.0 (54.7-75.3) 23.2 (16.7-29.7)
San Marino . . . . . . . . . . . . . . . . . .
Serbia 41.4 (36.5-46.3) 37.8 (32.9-42.6) 40.4 (35.7-45.1)
Slovakia 41.4 (34.4-48.4) 34.7 (28.6-40.7) 18.5 (13.2-23.8)
Slovenia 29.6 (23.6-35.5) 26.2 (20.6-31.8) 19.9 (15.1-24.7)
Spain 36.0 (31.9-40.1) 32.4 (28.6-36.1) 27.7 (24.3-31.1)
Sweden 19.8 (18.8-20.8) 14.9 (14.0-15.8) 22.7 (21.6-23.7)
Switzerland 29.4 (27.0-31.9) 22.3 (20.3-24.3) 20.3 (18.6-22.0)
Tajikistan . . . . . . . . . . . . . . . . . .
The former Yugoslav Republic of
Macedonia
. . . . . . . . . . . . . . . . . .
Turkey 53.3 (45.5-61.0) 46.4 (39.6-53.2) 20.5 (8.4-32.5)
Turkmenistan . . . . . . . . . . . . . . . . . .
Ukraine 63.3 (53.2-73.5) 57.4 (48.1-66.7) 19.3 (14.0-24.6)
United Kingdom of Great Britain and
Northern Ireland
34.7 (33.6-35.8) 27.6 (26.5-28.6) 31.1 (30.1-32.1)
Uzbekistan 24.2 (19.6-28.7) 18.9 (15.3-22.6) 1.3 (0.8-1.8)](https://image.slidesharecdn.com/ol25kkvlqguoxfywagtq-signature-60b0131a05a17be1631d7bde4d7608a3b2ae419a0a24dd90535582b58a53e895-poli-151021161413-lva1-app6891/85/MPOWER-Package-280-320.jpg)
![275WHO REPORT ON THE GLOBAL TOBACCO EPIDEMIC, 2008
Smoking cigarettes [%]b
Males Females
Dailyd
95%CIe
Currentc
95%CIe
Dailyd
95%CIe
Currentc
95%CIe
Dailyd
95%CIe
2.6 (0.4-4.7) 39.6 (26.6-52.7) 36.5 (24.5-48.5) 3.9 (0.6-7.2) 2.6 (0.4-4.7)
20.6 (16.3-24.8) 35.7 (30.1-41.3) 32.2 (26.9-37.5) 24.5 (19.8-29.2) 20.6 (16.3-24.8)
2.8 (1.0-4.6) 52.9 (45.2-60.5) 47.0 (40.2-53.8) 4.0 (1.5-6.5) 2.8 (1.0-4.6)
35.8 (33.8-37.7) 45.5 (43.3-47.6) 39.9 (37.8-42.0) 35.8 (33.9-37.8) 35.8 (33.8-37.7)
0.4 (0.2-0.6) . . . . . . . . . . . . 0.9 (0.3-1.5) 0.4 (0.2-0.6)
13.8 (9.5-18.0) 63.6 (53.2-73.9) 57.6 (48.1-67.1) 17.4 (12.2-22.6) 13.8 (9.5-18.0)
18.3 (16.6-20.0) 28.8 (25.8-31.9) 22.0 (19.6-24.4) 21.5 (19.6-23.5) 18.3 (16.6-20.0)
28.7 (23.5-33.9) 48.8 (42.3-55.3) 45.1 (39.0-51.2) 32.0 (26.3-37.8) 28.7 (23.5-33.9)
18.3 (12.7-23.9) 44.6 (36.7-52.5) 38.8 (31.8-45.9) 21.8 (15.3-28.3) 18.3 (12.7-23.9)
22.0 (21.0-23.0) 37.5 (35.7-39.3) 33.8 (32.0-35.5) 25.4 (24.3-26.5) 22.0 (21.0-23.0)
. . . . . . . . . . . . . . . . . . . . . . . . . . . . . .
19.3 (13.4-25.2) 35.9 (29.4-42.5) 29.7 (24.1-35.3) 23.4 (16.4-30.3) 19.3 (13.4-25.2)
24.2 (22.4-25.9) 35.8 (33.8-37.8) 28.8 (26.9-30.7) 29.4 (27.5-31.2) 24.2 (22.4-25.9)
19.7 (17.8-21.7) 49.0 (46.2-51.7) 41.3 (38.6-44.0) 25.3 (23.2-27.4) 19.7 (17.8-21.7)
15.4 (13.7-17.1) 30.7 (28.4-33.0) 24.0 (21.9-26.2) 21.0 (19.1-22.9) 15.4 (13.7-17.1)
20.1 (19.4-20.7) 34.4 (33.6-35.2) 28.3 (27.6-29.0) 22.7 (22.0-23.4) 20.1 (19.4-20.7)
3.8 (1.4-6.2) 55.8 (47.3-64.3) 49.7 (42.0-57.4) 5.8 (2.2-9.5) 3.8 (1.4-6.2)
19.2 (18.0-20.4) 36.0 (33.5-38.4) 29.5 (27.5-31.6) 22.0 (20.6-23.3) 19.2 (18.0-20.4)
29.0 (25.1-33) 62.4 (54.9-69.9) 59.4 (52.2-66.5) 32.8 (28.4-37.1) 29.0 (25.1-33)
27.0 (19.5-34.5) 44.6 (37.4-51.8) 38.2 (31.9-44.4) 30.5 (22.0-38.9) 27.0 (19.5-34.5)
18.9 (16.9-21.0) 25.7 (23.2-28.1) 19.2 (17.0-21.4) 25.2 (22.9-27.5) 18.9 (16.9-21.0)
17.5 (15.1-19.8) 25.0 (20.1-29.8) 18.6 (16.2-21.0) 23.8 (20.7-26.9) 17.5 (15.1-19.8)
14.8 (6.0-23.7) 30.9 (26.1-35.8) 27.3 (22.9-31.7) 17.6 (7.1-28.1) 14.8 (6.0-23.7)
13.2 (12.2-14.2) 30.6 (28.4-32.8) 27.0 (25.0-29.0) 16.4 (15.2-17.7) 13.2 (12.2-14.2)
6.5 (4.2-8.9) 43.9 (35.5-52.3) 37.0 (29.8-44.2) 9.8 (6.4-13.1) 6.5 (4.2-8.9)
1.2 (0.6-1.7) 45.0 (36.9-53.2) 38.6 (31.6-45.7) 2.2 (1.3-3.0) 1.2 (0.6-1.7)
13.9 (11.5-16.2) 53.2 (44.6-61.8) 45.9 (38.3-53.5) 19.1 (16.3-21.9) 13.9 (11.5-16.2)
11.9 (9.8-14.1) 44.4 (37.3-51.5) 36.7 (30.5-42.8) 17.6 (15.0-20.2) 11.9 (9.8-14.1)
25.3 (22.6-27.9) 37.1 (33.6-40.7) 31.3 (28.1-34.5) 27.3 (24.5-30.1) 25.3 (22.6-27.9)
18.1 (15.5-20.7) 32.0 (27.7-36.4) 28.5 (24.6-32.4) 21.8 (18.7-24.9) 18.1 (15.4-20.7)
. . . . . . . . . . . . . . . . . . . . . . . . . . . . . .
. . . . . . . . . . . . . . . . . . . . . . . . . . . . . .
26.5 (25.7-27.4) 38.3 (37.4-39.3) 31.5 (30.6-32.4) 28.5 (27.6-29.4) 26.5 (25.7-27.4)
22.8 (19.6-25.9) 32.7 (28.3-37.1) 25.8 (22.2-29.4) 28.3 (24.5-32.1) 22.8 (19.6-25.9)
22.0 (14.4-29.7) 44.0 (35.3-52.7) 37.8 (29.9-45.7) 25.6 (17.0-34.2) 22.0 (14.4-29.7)
20.4 (17.2-23.6) 38.5 (33.2-43.9) 35.0 (29.9-40.1) 24.3 (20.8-27.9) 20.4 (17.2-23.6)
3.3 (2.3-4.3) 45.9 (38.5-53.3) 39.3 (33.0-45.7) 5.3 (3.8-6.8) 3.3 (2.3-4.3)
19.4 (13.6-25.2) 45.2 (37.8-52.6) 38.7 (32.2-45.2) 23.6 (16.7-30.5) 19.4 (13.6-25.2)
18.9 (13.5-24.2) 70.2 (59.2-81.3) 65.0 (54.7-75.3) 23.2 (16.7-29.7) 18.9 (13.5-24.2)
. . . . . . . . . . . . . . . . . . . . . . . . . . . . . .
37.7 (33.1-42.3) 41.4 (36.5-46.3) 37.8 (32.9-42.6) 40.4 (35.7-45.1) 37.7 (33.1-42.3)
14.3 (10.1-18.5) 41.4 (34.4-48.4) 34.7 (28.6-40.7) 18.5 (13.2-23.8) 14.3 (10.1-18.5)
17.2 (12.7-21.6) 29.6 (23.6-35.5) 26.2 (20.6-31.8) 19.9 (15.1-24.7) 17.2 (12.7-21.6)
24.3 (21.3-27.3) 36.0 (31.9-40.1) 32.4 (28.6-36.1) 27.7 (24.3-31.1) 24.3 (21.3-27.3)
17.6 (16.6-18.5) 19.8 (18.8-20.8) 14.9 (14.0-15.8) 22.7 (21.6-23.7) 17.6 (16.6-18.5)
16.8 (15.3-18.3) 29.4 (27.0-31.9) 22.3 (20.3-24.3) 20.3 (18.6-22.0) 16.8 (15.3-18.3)
. . . . . . . . . . . . . . . . . . . . . . . . . . . . . .
. . . . . . . . . . . . . . . . . . . . . . . . . . . . . .
15.7 (6.4-24.9) 53.3 (45.5-61.0) 46.4 (39.6-53.2) 20.5 (8.4-32.5) 15.7 (6.4-24.9)
. . . . . . . . . . . . . . . . . . . . . . . . . . . . . .
15.5 (11.2-19.7) 63.3 (53.2-73.5) 57.4 (48.1-66.7) 19.3 (14.0-24.6) 15.5 (11.2-19.7)
25.6 (24.6-26.5) 34.7 (33.6-35.8) 27.6 (26.5-28.6) 31.1 (30.1-32.1) 25.6 (24.6-26.5)
0.6 (0.3-0.9) 24.2 (19.6-28.7) 18.9 (15.3-22.6) 1.3 (0.8-1.8) 0.6 (0.3-0.9)](https://image.slidesharecdn.com/ol25kkvlqguoxfywagtq-signature-60b0131a05a17be1631d7bde4d7608a3b2ae419a0a24dd90535582b58a53e895-poli-151021161413-lva1-app6891/85/MPOWER-Package-281-320.jpg)
![276 WHO REPORT ON THE GLOBAL TOBACCO EPIDEMIC, 2008
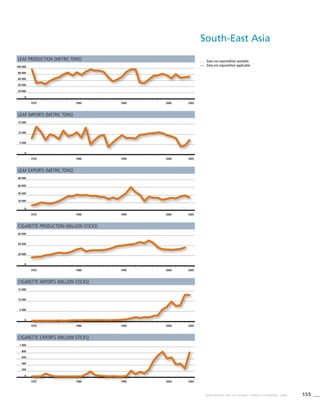
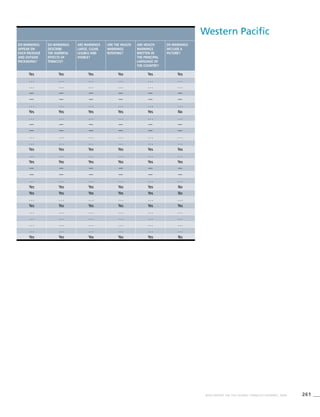
South-East
Asia
Table 3.5a
Adjusted prevalence estimates
for WHO Member States
(South-East Asia)
Country Smoking any tobacco product [%]a
Males Females
Currentc
95%CIe
Dailyd
95%CIe
Currentc
95%CIe
Bangladesh 44.5 (36.1-53.0) 39.2 (31.7-46.7) 2.9 (1.7-4.0)
Bhutan . . . . . . . . . . . . . . . . . .
Democratic People’s Republic
of Korea
59.5 (57.0-62.0) 57.4 (40.4-74.4) . . . . . .
India 30.8 (24.9-36.8) 24.9 (20.1-29.8) 2.8 (1.9-3.7)
Indonesia 65.3 (57.3-73.2) 57.4 (50.4-64.4) 4.2 (3.7-4.7)
Maldives 44.4 (36.0-52.8) 38.0 (30.7-45.2) 9.2 (6.2-12.2)
Myanmar 45.0 (39.2-50.7) 34.6 (30.1-39.1) 11.7 (10.5-12.9)
Nepal 29.9 (24.2-35.6) 24.0 (19.4-28.6) 22.6 (15.4-29.8)
Sri Lanka 29.9 (24.2-35.7) 23.6 (19.0-28.2) 2.5 (1.5-3.4)
Thailand 39.9 (35.1-44.7) 29.6 (26.0-33.1) 3.4 (3.3-3.5)
Timor-Leste . . . . . . . . . . . . . . . . . .
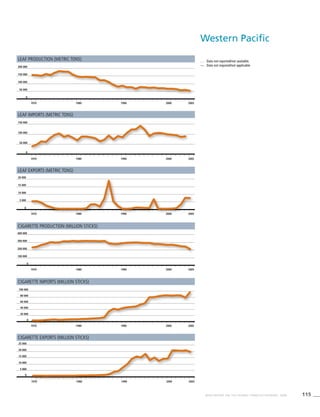
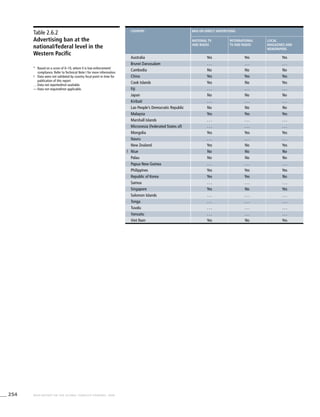
Western Pacific
Table 3.6a
Adjusted prevalence estimates
for WHO Member States
(Western Pacific)
Country Smoking any tobacco product [%]a
Males Females
Currentc
95%CIe
Dailyd
95%CIe
Currentc
95%CIe
! Australia 26.5 (23.2-29.8) 21.1 (18.4-23.7) 20.3 (17.3-23.4)
Brunei Darussalam . . . . . . . . . . . . . . . . . .
Cambodia 31.7 (27.7-35.8) 22.0 (19.1-24.9) 12.4 (11.4-13.3)
China 60.8 (48.8-72.8) 58.5 (41.3-75.8) 4.2 (3.5-4.9)
Cook Islands 36.5 (27.3-45.7) 31.5 (23.1-39.8) 20.8 (14.5-27.1)
Fiji 24.7 (19.6-29.8) 19.6 (15.5-23.8) 5.1 (3.9-6.4)
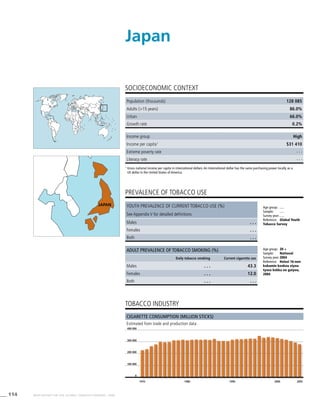
Japan 46.0 (36.8-55.2) 42.6 (29.9-55.2) 13.7 (11.5-15.8)
Kiribati . . . . . . . . . . . . . . . . . .
Lao People’s Democratic Republic 62.5 (54.7-70.2) 54.2 (47.4-61.1) 14.5 (13.4-15.7)
Malaysia 55.5 (48.2-62.8) 44.9 (38.7-51.1) 2.5 (1.7-3.3)
Marshall Islands . . . . . . . . . . . . . . . . . .
Micronesia (Federated States of) . . . . . . . . . . . . . . . . . .
Mongolia 44.6 (31.3-58.0) 41.6 (29.1-54.0) 5.3 (3.8-6.8)
Nauru 47.2 (37.5-56.9) 44.3 (35.2-53.5) 53.3 (41.8-64.8)
New Zealand 25.8 (22.3-29.4) 20.7 (17.9-23.6) 24.3 (20.5-28.1)
Niue . . . . . . . . . . . . . . . . . .
Palau 38.8 (28.7-49.0) 34.2 (24.8-43.5) 10.1 (5.4-14.8)
Papua New Guinea . . . . . . . . . . . . . . . . . .
Philippines 40.7 (35.6-45.8) 31.2 (27.2-35.2) 9.1 (8.2-9.9)
Republic of Korea 53.8 (37.8-69.7) 50.7 (35.7-65.8) 5.6 (4.5-6.7)
Samoa 57.7 (44.9-70.4) 55.6 (43.2-68.0) 23.8 (16.8-30.7)
* Singapore . . . . . . 23.1 (19.7-26.4) . . . . . .
Solomon Islands . . . . . . . . . . . . . . . . . .
Tonga 61.1 (48.3-73.8) 59.3 (46.8-71.7) 15.7 (11.3-20.0)
Tuvalu . . . . . . . . . . . . . . . . . .
Vanuatu 51.9 (41.2-62.6) 49.6 (39.3-59.8) 8.0 (5.5-10.5)
! Viet Nam 44.4 (38.5-50.3) 33.9 (29.2-38.6) 2.1 (1.5-2.8)](https://image.slidesharecdn.com/ol25kkvlqguoxfywagtq-signature-60b0131a05a17be1631d7bde4d7608a3b2ae419a0a24dd90535582b58a53e895-poli-151021161413-lva1-app6891/85/MPOWER-Package-282-320.jpg)
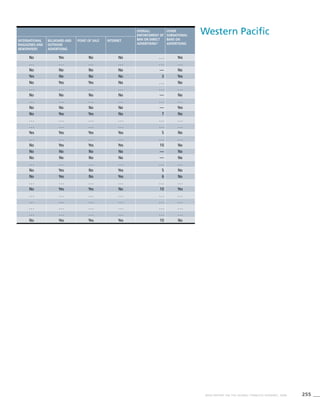
![277WHO REPORT ON THE GLOBAL TOBACCO EPIDEMIC, 2008
! Data were not validated by country focal point in time for
publication of this report.
. . . Data not available/not reported
a Definition: Smoking any form of tobacco, including cigarettes,
cigars, pipes, bidis, etc.
b Definition: Smoking manufactured cigarettes.
c Definition: Smoking at the time of the survey, including daily
and non-daily smoking.
d Definition: Smoking everyday at the time of the survey.
e CI: Confidence Interval
! Data were not validated by country focal point in time for
publication of this report.
. . . Data not available/not reported.
a Definition: Smoking any form of tobacco, including cigarettes,
cigars, pipes, bidis, etc.
b Definition: Smoking manufactured cigarettes.
c Definition: Smoking at the time of the survey, including daily
and non-daily smoking.
d Definition: Smoking everyday at the time of the survey.
e CI: Confidence Interval
* Current smoking prevalence not validated
Smoking cigarettes [%]b
Males Females
Dailyd
95%CIe
Currentc
95%CIe
Dailyd
95%CIe
Currentc
95%CIe
Dailyd
95%CIe
2.0 (1.1-2.8) 41.0 (33.2-48.8) 35.5 (28.7-42.3) 0.7 (0.3-1.1) 0.4 (0.1-0.7)
. . . . . . . . . . . . . . . . . . . . . . . . . . . . . .
. . . . . . 59.5 (57.0-62.0) 57.4 (40.4-74.4) . . . . . . . . . . . .
1.8 (1.2-2.4) 25.8 (20.8-30.8) 20.0 (16.1-23.9) 0.6 (0.4-0.8) 0.3 (0.2-0.4)
3.0 (2.6-3.4) 61.8 (54.3-69.3) 53.0 (46.5-59.5) 3.7 (3.3-4.2) 2.6 (2.2-3.0)
7.5 (5.0-10.0) 40.6 (32.9-48.3) 33.9 (27.4-40.4) 7.1 (4.7-9.5) 5.6 (3.7-7.5)
9.4 (8.3-10.4) 42.5 (37.0-47.9) 31.8 (27.6-36.0) 10.1 (9.0-11.2) 7.9 (7.0-8.9)
21.4 (14.6-28.3) 25.2 (20.4-30.0) 19.4 (15.6-23.2) 22.4 (15.3-29.5) 21.2 (14.5-28.0)
1.5 (0.9-2.2) 24.4 (19.6-29.1) 18.2 (14.6-21.9) 0.4 (0.2-0.7) 0.2 (0.0-0.3)
2.4 (2.3-2.5) 37.3 (32.9-41.8) 26.9 (23.7-30.1) 3.0 (2.9-3.1) 2.1 (2.0-2.1)
. . . . . . . . . . . . . . . . . . . . . . . . . . . . . .
Smoking cigarettes [%]b
Males Females
Dailyd
95%CIee
Currentc
95%CIe
Dailyd
95%CIe
Currentc
95%CIe
Dailyd
95%CIe
14.9 (12.7-17.2) 26.5 (23.2-29.8) 21.1 (18.4-23.7) 20.3 (17.3-23.4) 14.9 (12.7-17.2)
. . . . . . . . . . . . . . . . . . . . . . . . . . . . . .
9.7 (8.9-10.5) 30.3 (26.5-34.1) 20.5 (17.9-23.2) 10.8 (10.0-11.6) 8.4 (7.7-9.1)
3.8 (3.3-4.4) 60.8 (55.7-65.9) 58.5 (41.3-75.8) 4.2 (2.9-5.5) 3.8 (3.3-4.4)
14.2 (9.2-19.1) 36.5 (27.3-45.7) 31.5 (23.1-39.8) 20.8 (14.5-27.1) 14.2 (9.2-19.1)
2.5 (1.8-3.2) 24.7 (19.6-29.8) 19.6 (15.5-23.8) 5.1 (3.9-6.4) 2.5 (1.8-3.2)
10.9 (9.1-12.7) 46.0 (41.1-50.9) 42.6 (29.9-55.2) 13.7 (11.5-15.8) 10.9 (9.1-12.7)
. . . . . . . . . . . . . . . . . . . . . . . . . . . . . .
11.4 (10.4-12.4) 59.2 (51.8-66.5) 50.2 (43.9-56.6) 12.8 (11.7-13.9) 9.9 (9.0-10.8)
1.7 (1.1-2.4) 52.4 (45.4-59.4) 41.4 (35.6-47.2) 2.3 (1.5-3.0) 1.5 (0.9-2.2)
. . . . . . . . . . . . . . . . . . . . . . . . . . . . . .
. . . . . . . . . . . . . . . . . . . . . . . . . . . . . .
4.5 (3.2-5.9) 44.6 (31.3-58.0) 41.6 (29.1-54.0) 5.3 (3.8-6.8) 4.5 (3.2-5.9)
50.5 (39.6-61.4) 47.2 (37.5-56.9) 44.3 (35.2-53.5) 53.3 (41.8-64.8) 50.5 (39.6-61.4)
19.3 (16.2-22.3) 25.8 (22.3-29.4) 20.7 (17.9-23.6) 24.3 (20.5-28.1) 19.3 (16.2-22.3)
. . . . . . . . . . . . . . . . . . . . . . . . . . . . . .
7.5 (3.5-11.5) 38.8 (28.7-49.0) 34.2 (24.8-43.5) 10.1 (5.4-14.8) 7.5 (3.5-11.5)
. . . . . . . . . . . . . . . . . . . . . . . . . . . . . .
6.8 (6.1-7.6) 38.1 (33.4-42.9) 28.4 (24.8-32.1) 8.0 (7.2-8.8) 5.9 (5.3-6.6)
4.8 (3.8-5.8) 53.8 (51.4-56.1) 50.7 (35.7-65.8) 5.6 (4.9-6.4) 4.8 (3.8-5.8)
17.3 (11.7-22.9) 57.7 (44.9-70.4) 55.6 (43.2-68.0) 23.8 (16.8-30.7) 17.3 (11.7-22.9)
3.8 (3.0-4.7) . . . . . . 21.1 (18.0-24.2) . . . . . . 3.4 (2.6-4.2)
. . . . . . . . . . . . . . . . . . . . . . . . . . . . . .
10.4 (7.1-13.7) 61.1 (48.3-73.8) 59.3 (46.8-71.7) 15.7 (11.3-20) 10.4 (7.1-13.7)
. . . . . . . . . . . . . . . . . . . . . . . . . . . . . .
3.9 (2.3-5.5) 51.9 (41.2-62.6) 49.6 (39.3-59.8) 8.0 (5.5-10.5) 3.9 (2.3-5.5)
1.5 (0.9-2.0) 42.0 (36.4-47.6) 31.2 (26.8-35.6) 1.9 (1.2-2.5) 1.3 (0.8-1.8)](https://image.slidesharecdn.com/ol25kkvlqguoxfywagtq-signature-60b0131a05a17be1631d7bde4d7608a3b2ae419a0a24dd90535582b58a53e895-poli-151021161413-lva1-app6891/85/MPOWER-Package-283-320.jpg)
![278 WHO REPORT ON THE GLOBAL TOBACCO EPIDEMIC, 2008
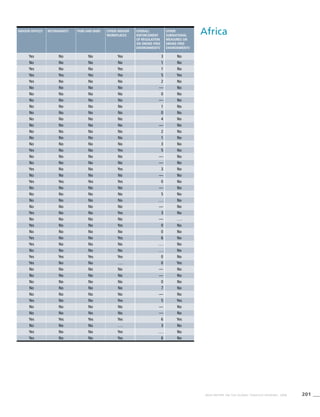
Africa
! Data were not validated by country focal point in time for
publication of this report.
. . . Data not available/not reported
a Definition: Smoking any form of tobacco, including cigarettes,
cigars, pipes, bidis, etc.
b Definition: Smoking manufactured cigarettes.
c Definition: Smoking at the time of the survey, including daily
and non-daily smoking.
d Definition: Smoking everyday at the time of the survey.
e CI: Confidence Interval
Table 3.1b
Age standardized prevalence
estimates for WHO Member
States (Africa)
Country Smoking any tobacco product [%]a
Males Females
Currentc
95%CIe
Dailyd
95%CIe
Currentc
95%CIe
Algeria 29.9 (27.4-32.4) 28.2 (25.8-30.6) 0.3 (0.1-0.5)
Angola . . . . . . . . . . . . . . . . . .
Benin . . . . . . . . . . . . . . . . . .
Botswana . . . . . . . . . . . . . . . . . .
Burkina Faso 22.0 (20.0-23.9) 18.6 (16.8-20.4) 11.2 (9.8-12.6)
Burundi . . . . . . . . . . . . . . . . . .
Cameroon 12.6 (8.5-16.8) 10.3 (6.9-13.7) 2.2 (0.4-4.0)
Cape Verde . . . . . . . . . . . . . . . . . .
Central African Republic . . . . . . . . . . . . . . . . . .
Chad 16.0 (11.0-21.1) 12.9 (8.8-17.0) 2.6 (0.5-4.7)
Comoros 27.7 (23.7-31.7) 22.3 (18.8-25.8) 13.5 (9.6-17.3)
Congo 12.1 (7.9-16.3) 8.7 (5.5-11.8) 1.0 (0.0-2.0)
Côte d’Ivoire 15.4 (13.7-17.1) 11.6 (10.1-13.1) 2.4 (1.8-3.0)
Democratic Republic of the Congo 13.5 (8.8-18.3) 10.3 (6.5-14.0) 2.6 (0.4-4.8)
Equatorial Guinea . . . . . . . . . . . . . . . . . .
Eritrea 16.9 (14.3-19.5) 12.2 (10.0-14.4) 1.2 (0.5-1.8)
Ethiopia 7.6 (6.3-8.9) 5.0 (4.1-6.0) 0.9 (0.4-1.3)
Gabon . . . . . . . . . . . . . . . . . .
Gambia 29.3 (27.1-31.6) 27.5 (25.3-29.7) 2.9 (2.3-3.5)
Ghana 10.2 (8.7-11.7) 7.5 (6.2-8.7) 0.8 (0.4-1.2)
Guinea . . . . . . . . . . . . . . . . . .
Guinea-Bissau . . . . . . . . . . . . . . . . . .
Kenya 27.1 (23.9-30.2) 21.1 (18.5-23.7) 2.2 (1.4-3.0)
Lesotho . . . . . . . . . . . . . . . . . .
Liberia . . . . . . . . . . . . . . . . . .
Madagascar . . . . . . . . . . . . . . . . . .
Malawi 23.7 (20.9-26.4) 18.8 (16.5-21.1) 6.2 (4.5-7.9)
Mali 19.5 (17.6-21.4) 15.7 (14.0-17.5) 2.8 (2.0-3.7)
Mauritania 22.3 (19.9-24.7) 18.7 (16.4-20.9) 3.7 (2.9-4.5)
Mauritius 35.7 (31.9-39.5) 28.8 (25.5-32.1) 1.1 (0.6-1.6)
Mozambique 22.0 (19.8-24.3) 16.4 (14.6-18.2) 3.4 (2.5-4.3)
! Namibia 38.6 (34.7-42.5) 31.9 (28.5-35.3) 10.9 (9.4-12.4)
Niger . . . . . . . . . . . . . . . . . .
Nigeria 13.0 (11.2-14.7) 9.9 (8.3-11.4) 1.2 (0.7-1.6)
Rwanda . . . . . . . . . . . . . . . . . .
Sao Tome and Principe 23.2 (10.4-36.0) 22.3 (9.7-34.8) 10.6 (0.0-23.8)
Senegal 19.8 (17.4-22.1) 16.0 (13.8-18.1) 1.5 (0.8-2.2)
! Seychelles 35.2 (30.2-40.2) 28.2 (23.7-32.6) 7.0 (4.4-9.7)
Sierra Leone . . . . . . . . . . . . . . . . . .
South Africa 27.5 (24.0-31.0) 21.3 (18.3-24.3) 9.1 (7.3-10.9)
Swaziland 14.6 (12.0-17.3) 9.8 (7.7-12.0) 3.2 (2.1-4.2)
Togo . . . . . . . . . . . . . . . . . .
Uganda 20.9 (18.4-23.5) 16.3 (14.1-18.4) 3.2 (2.4-4.1)
United Republic of Tanzania 24.8 (22.2-27.4) 19.5 (17.4-21.7) 4.3 (3.2-5.5)
! Zambia 21.7 (19.0-24.5) 16.8 (14.5-19.1) 5.0 (3.5-6.5)
Zimbabwe 25.5 (22.3-28.7) 20.0 (17.3-22.8) 4.4 (3.1-5.8)](https://image.slidesharecdn.com/ol25kkvlqguoxfywagtq-signature-60b0131a05a17be1631d7bde4d7608a3b2ae419a0a24dd90535582b58a53e895-poli-151021161413-lva1-app6891/85/MPOWER-Package-284-320.jpg)
![279WHO REPORT ON THE GLOBAL TOBACCO EPIDEMIC, 2008
Smoking cigarettes [%]b
Males Females
Dailyd
95%CIe
Currentc
95%CIe
Dailyd
95%CIe
Currentc
95%CIe
Dailyd
95%CIe
0.3 (0.0-0.5) 26.6 (24.2-28.9) 24.9 (22.7-27.2) 0.2 (0.0-0.4) 0.2 (0.0-0.4)
. . . . . . . . . . . . . . . . . . . . . . . . . . . . . .
. . . . . . . . . . . . . . . . . . . . . . . . . . . . . .
. . . . . . . . . . . . . . . . . . . . . . . . . . . . . .
10.8 (9.5-12.2) 14.2 (12.6-15.7) 10.2 (8.9-11.6) 0.8 (0.5-1.2) 0.4 (0.1-0.6)
. . . . . . . . . . . . . . . . . . . . . . . . . . . . . .
1.6 (0.2-3.0) 9.9 (6.6-13.3) 7.4 (4.8-9.9) 1.3 (0.2-2.4) 0.9 (0.1-1.8)
. . . . . . . . . . . . . . . . . . . . . . . . . . . . . .
. . . . . . . . . . . . . . . . . . . . . . . . . . . . . .
1.9 (0.3-3.4) 12.7 (8.7-16.8) 9.4 (6.3-12.4) 1.0 (0.1-2.0) 0.7 (0.1-1.3)
11.6 (8.2-15.0) 22.7 (19.1-26.2) 17.1 (14.1-20.2) 5.0 (3.2-6.8) 3.5 (2.0-4.9)
0.7 (0.0-1.4) 9.8 (6.3-13.3) 6.4 (3.9-8.9) 0.4 (0.1-0.9) 0.3 (0.0-0.7)
1.7 (1.2-2.3) 11.8 (10.3-13.4) 8.2 (6.9-9.4) 0.6 (0.3-0.9) 0.3 (0.1-0.5)
2.0 (0.2-3.7) 10.9 (7.0-14.9) 7.6 (4.6-10.5) 0.6 (0.0-1.3) 0.4 (0.0-0.9)
. . . . . . . . . . . . . . . . . . . . . . . . . . . . . .
0.6 (0.1-1.0) 15.6 (13.1-18.1) 11.1 (9.0-13.1) 0.7 (0.2-1.2) 0.3 (0.0-0.7)
0.5 (0.2-0.7) 6.9 (5.7-8.1) 4.5 (3.6-5.4) 0.5 (0.2-0.8) 0.2 (0.0-0.4)
. . . . . . . . . . . . . . . . . . . . . . . . . . . . . .
2.3 (1.8-2.9) 17.2 (15.5-18.9) 13.7 (12.2-15.3) 0.5 (0.3-0.8) 0.2 (0.1-0.4)
0.4 (0.1-0.7) 7.1 (5.8-8.3) 4.5 (3.5-5.5) 0.5 (0.2-0.8) 0.2 (0.0-0.4)
. . . . . . . . . . . . . . . . . . . . . . . . . . . . . .
. . . . . . . . . . . . . . . . . . . . . . . . . . . . . .
1.4 (0.8-1.9) 23.9 (21.0-26.8) 18.2 (15.8-20.6) 1.1 (0.6-1.6) 0.6 (0.3-0.9)
. . . . . . . . . . . . . . . . . . . . . . . . . . . . . .
. . . . . . . . . . . . . . . . . . . . . . . . . . . . . .
. . . . . . . . . . . . . . . . . . . . . . . . . . . . . .
5.1 (3.7-6.6) 19.2 (16.9-21.6) 14.4 (12.5-16.4) 2.3 (1.6-3.1) 1.6 (1.0-2.1)
2.1 (1.4-2.8) 14.0 (12.3-15.6) 10.1 (8.7-11.5) 0.7 (0.3-1.2) 0.3 (0.0-0.6)
2.8 (2.1-3.5) 16.3 (14.2-18.3) 12.3 (10.5-14.2) 0.8 (0.4-1.1) 0.3 (0.1-0.6)
0.6 (0.2-1.0) 35.7 (31.9-39.5) 28.8 (25.5-32.1) 1.1 (0.6-1.6) 0.6 (0.2-1.0)
2.2 (1.6-2.8) 20.0 (18.0-22.1) 14.6 (13.0-16.3) 1.6 (1.1-2.1) 0.9 (0.6-1.2)
9.2 (7.8-10.6) 35.9 (32.2-39.6) 29.0 (25.8-32.2) 9.2 (7.9-10.6) 7.3 (6.1-8.5)
. . . . . . . . . . . . . . . . . . . . . . . . . . . . . .
0.9 (0.5-1.3) 9.1 (7.6-10.5) 6.1 (4.9-7.3) 0.2 (0.0-0.4) 0.1 (0.0-0.2)
. . . . . . . . . . . . . . . . . . . . . . . . . . . . . .
8.7 (0.0-20.7) 23.2 (10.4-36.0) 22.3 (9.7-34.8) 10.6 (0.0-23.8) 8.7 (0.0-20.7)
0.9 (0.4-1.5) 14.4 (12.3-16.5) 10.5 (8.7-12.3) 0.6 (0.2-1.0) 0.2 (0.0-0.5)
5.1 (2.9-7.2) 30.8 (26.1-35.4) 23.9 (19.8-28.0) 3.0 (1.4-4.5) 1.8 (0.6-2.9)
. . . . . . . . . . . . . . . . . . . . . . . . . . . . . .
6.9 (5.4-8.4) 25.0 (21.7-28.3) 19.0 (16.2-21.8) 7.8 (6.1-9.4) 5.5 (4.1-6.9)
2.0 (1.2-2.8) 13.3 (10.8-15.8) 8.7 (6.7-10.8) 2.8 (1.8-3.7) 1.6 (0.9-2.3)
. . . . . . . . . . . . . . . . . . . . . . . . . . . . . .
2.1 (1.5-2.8) 18.4 (16.0-20.8) 13.9 (11.9-15.8) 1.5 (1.0-1.9) 0.8 (0.5-1.1)
3.4 (2.5-4.3) 20.5 (18.3-22.7) 15.3 (13.5-17.1) 1.7 (1.2-2.2) 1.1 (0.7-1.5)
3.8 (2.6-5.0) 18.0 (15.6-20.4) 13.2 (11.2-15.2) 2.1 (1.3-2.9) 1.3 (0.7-1.9)
3.1 (2.1-4.1) 21.2 (18.3-24.0) 15.8 (13.5-18.1) 2.0 (1.2-2.7) 1.1 (0.6-1.6)](https://image.slidesharecdn.com/ol25kkvlqguoxfywagtq-signature-60b0131a05a17be1631d7bde4d7608a3b2ae419a0a24dd90535582b58a53e895-poli-151021161413-lva1-app6891/85/MPOWER-Package-285-320.jpg)
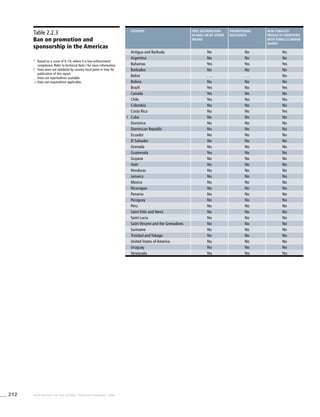
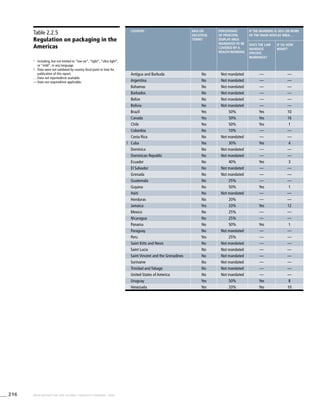
![280 WHO REPORT ON THE GLOBAL TOBACCO EPIDEMIC, 2008
The Americas
! Data were not validated by country focal point in time for
publication of this report.
. . . Data not available/not reported
a Definition: Smoking any form of tobacco, including cigarettes,
cigars, pipes, bidis, etc.
b Definition: Smoking manufactured cigarettes.
c Definition: Smoking at the time of the survey, including daily
and non-daily smoking.
d Definition: Smoking everyday at the time of the survey.
e CI: Confidence Interval
* Current smoking prevalence not validated
Table 3.2b
Age standardized prevalence
estimates for WHO Member
States (The Americas)
Country Smoking any tobacco product [%]a
Males Females
Currentc
95%CIe
Dailyd
95%CIe
Currentc
95%CIe
Antigua and Barbuda . . . . . . . . . . . . . . . . . .
Argentina 34.6 (31.1-38.2) 27.4 (24.6-30.2) 25.4 (22.3-28.4)
Bahamas . . . . . . . . . . . . . . . . . .
! Barbados 18.4 (10.0-26.8) 16.6 (8.9-24.2) 3.0 (1.4-4.7)
Belize . . . . . . . . . . . . . . . . . .
Bolivia 34.1 (26.5-41.7) 30.1 (23.3-36.9) 29.2 (25.7-32.7)
* Brazil . . . . . . 16.7 (11.5-21.9) . . . . . .
! Canada . . . . . . . . . . . . . . . . . .
! Chile 42.1 (33.6-50.5) 39.3 (31.4-47.2) 33.6 (28.2-38.9)
Colombia . . . . . . . . . . . . . . . . . .
Costa Rica 26.1 (22.0-30.3) 9.9 (8.0-11.7) 7.3 (5.7-8.8)
Cuba 43.4 (26.3-60.5) 42.9 (26-59.8) 28.3 (21.6-35.1)
Dominica . . . . . . . . . . . . . . . . . .
Dominican Republic 17.5 (10.3-24.8) 15.7 (9.2-22.3) 13.3 (9.7-17.0)
Ecuador 23.9 (20.7-27.0) 6.4 (5.0-7.7) 5.8 (4.7-7.0)
El Salvador . . . . . . . . . . . . . . . . . .
Grenada . . . . . . . . . . . . . . . . . .
Guatemala 24.5 (20.5-28.4) 7.9 (6.2-9.6) 4.1 (3.2-5.1)
Guyana . . . . . . . . . . . . . . . . . .
Haiti . . . . . . . . . . . . . . . . . .
Honduras . . . . . . . . . . . . 3.4 (1.9-4.9)
Jamaica 20.8 (11.8-29.8) 19.1 (10.8-27.5) 9.2 (6.3-12.1)
Mexico 36.9 (29.6-44.1) 21.8 (18.7-25.0) 12.4 (8.9-15.9)
Nicaragua . . . . . . . . . . . . . . . . . .
Panama . . . . . . . . . . . . . . . . . .
Paraguay 33.0 (29.1-36.8) 23.7 (20.8-26.6) 14.8 (12.6-16.9)
Peru . . . . . . . . . . . . . . . . . .
Saint Kitts and Nevis . . . . . . . . . . . . . . . . . .
Saint Lucia 28.9 (16.8-41.0) 27.9 (16.2-39.6) 12.1 (8.2-16.0)
Saint Vincent and the Grenadines . . . . . . . . . . . . . . . . . .
Suriname . . . . . . . . . . . . . . . . . .
Trinidad and Tobago 36.4 (21.8-51.0) 36.2 (21.7-50.8) 7.6 (5.2-10.0)
United States of America 26.3 (23.2-29.5) 20.9 (19.3-22.4) 21.5 (18.0-25.0)
Uruguay 37.1 (32.7-41.6) 34.9 (30.7-39.2) 28.0 (24.0-32.0)
Venezuela 32.5 (26.7-38.4) 25.6 (20.4-30.8) 27.0 (21.1-32.9)](https://image.slidesharecdn.com/ol25kkvlqguoxfywagtq-signature-60b0131a05a17be1631d7bde4d7608a3b2ae419a0a24dd90535582b58a53e895-poli-151021161413-lva1-app6891/85/MPOWER-Package-286-320.jpg)
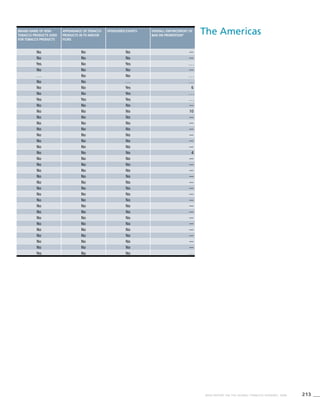
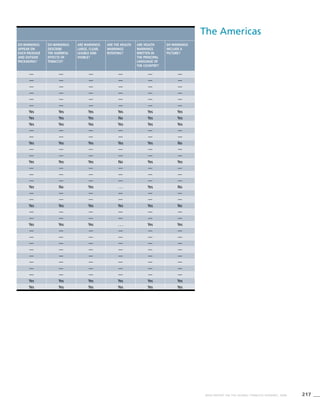
![281WHO REPORT ON THE GLOBAL TOBACCO EPIDEMIC, 2008
Smoking cigarettes [%]b
Males Females
Dailyd
95%CIe
Currentc
95%CIe
Dailyd
95%CIe
Currentc
95%CIe
Dailyd
95%CIe
. . . . . . . . . . . . . . . . . . . . . . . . . . . . . .
21.8 (19.2-24.4) 34.3 (30.8-37.8) 26.4 (23.7-29.1) 23.5 (20.7-26.3) 18.8 (16.6-21.1)
. . . . . . . . . . . . . . . . . . . . . . . . . . . . . .
2.5 (1.0-4.1) 16.9 (9.1-24.7) 15.0 (7.9-22.1) 2.3 (0.8-3.7) 1.9 (0.6-3.2)
. . . . . . . . . . . . . . . . . . . . . . . . . . . . . .
27.0 (23.8-30.2) 33.8 (26.3-41.4) 29.4 (22.7-36) 26.1 (23-29.3) 23.5 (20.7-26.3)
9.6 (5.8-13.4) . . . . . . 16.2 (11.3-21.2) . . . . . . 8.4 (5.1-11.8)
. . . . . . . . . . . . . . . . . . . . . . . . . . . . . .
33.1 (27.7-38.4) 41.7 (33.3-50.1) 38.6 (30.8-46.4) 30.5 (25.6-35.4) 29.5 (24.8-34.3)
. . . . . . . . . . . . . . . . . . . . . . . . . . . . . .
2.4 (1.7-3.2) 26.1 (22.0-30.3) 9.9 (8.0-11.7) 7.3 (5.7-8.8) 2.4 (1.7-3.2)
25.0 (19.0-30.9) 36.1 (21.9-50.4) 35.5 (21.5-49.5) 26.4 (20.1-32.7) 23.2 (17.7-28.7)
. . . . . . . . . . . . . . . . . . . . . . . . . . . . . .
11.5 (8.3-14.7) 15.7 (9.1-22.3) 13.8 (8.0-19.6) 10.9 (7.8-13.9) 9.3 (6.6-11.9)
1.5 (1.0-2.0) 23.6 (20.5-26.7) 6.1 (4.8-7.3) 5.6 (4.5-6.8) 1.4 (0.9-1.9)
. . . . . . . . . . . . . . . . . . . . . . . . . . . . . .
. . . . . . . . . . . . . . . . . . . . . . . . . . . . . .
0.9 (0.5-1.3) 24.5 (20.5-28.4) 7.9 (6.2-9.6) 4.1 (3.2-5.1) 0.9 (0.5-1.3)
. . . . . . . . . . . . . . . . . . . . . . . . . . . . . .
. . . . . . . . . . . . . . . . . . . . . . . . . . . . . .
0.6 (0.3-0.9) . . . . . . . . . . . . 3.4 (1.9-4.9) 0.6 (0.3-0.9)
7.8 (5.2-10.3) 18.8 (10.6-27) 16.9 (9.4-24.4) 7.6 (5.1-10.1) 6.4 (4.2-8.6)
6.2 (5.2-7.2) 36.9 (29.6-44.1) 21.8 (18.7-25.0) 12.4 (8.9-15.9) 6.2 (5.2-7.2)
. . . . . . . . . . . . . . . . . . . . . . . . . . . . . .
. . . . . . . . . . . . . . . . . . . . . . . . . . . . . .
7.4 (6.1-8.7) 32.6 (28.8-36.4) 22.5 (19.7-25.3) 13.9 (11.8-16) 6.1 (5.0-7.2)
. . . . . . . . . . . . . . . . . . . . . . . . . . . . . .
. . . . . . . . . . . . . . . . . . . . . . . . . . . . . .
10.5 (7.0-14.0) 25.4 (14.7-36.1) 23.9 (13.8-34.1) 9.2 (6.0-12.4) 7.8 (5.0-10.7)
. . . . . . . . . . . . . . . . . . . . . . . . . . . . . .
. . . . . . . . . . . . . . . . . . . . . . . . . . . . . .
6.4 (4.3-8.5) 32.2 (19.3-45.1) 31.8 (19.0-44.6) 5.7 (3.8-7.7) 4.8 (3.1-6.5)
16.5 (14.5-18.4) 26.3 (23.2-29.5) 20.9 (19.3-22.4) 21.5 (18.0-25.0) 16.5 (14.5-18.4)
26.5 (22.7-30.4) 37.1 (32.7-41.6) 34.9 (30.7-39.2) 28.0 (24.0-32.0) 26.5 (22.7-30.4)
24.8 (19.1-30.4) 32.5 (26.7-38.4) 25.6 (20.4-30.8) 27.0 (21.1-32.9) 24.8 (19.1-30.4)](https://image.slidesharecdn.com/ol25kkvlqguoxfywagtq-signature-60b0131a05a17be1631d7bde4d7608a3b2ae419a0a24dd90535582b58a53e895-poli-151021161413-lva1-app6891/85/MPOWER-Package-287-320.jpg)
![282 WHO REPORT ON THE GLOBAL TOBACCO EPIDEMIC, 2008
Eastern
Mediterranean
! Data were not validated by country focal point in time for
publication of this report.
. . . Data not available/not reported
a Definition: Smoking any form of tobacco, including cigarettes,
cigars, pipes, bidis, etc.
b Definition: Smoking manufactured cigarettes.
c Definition: Smoking at the time of the survey, including daily
and non-daily smoking.
d Definition: Smoking everyday at the time of the survey.
e CI: Confidence Interval
>
Refers to a territory.
Table 3.3b
Age standardized prevalence
estimates for WHO Member
States (Eastern Mediterranean)
Country Smoking any tobacco product [%]a
Males Females
Currentc
95%CIe
Dailyd
95%CIe
Currentc
95%CIe
Afghanistan . . . . . . . . . . . . . . . . . .
Bahrain 26.1 (22.4-29.9) 13.2 (11.3-15.1) 2.9 (1.2-4.6)
Djibouti . . . . . . . . . . . . . . . . . .
Egypt 28.7 (26.5-31.0) 27.1 (24.9-29.2) 1.3 (0.8-1.8)
Iran (Islamic Republic of) 29.6 (24.1-35.0) 23.2 (18.9-27.5) 5.5 (3.8-7.3)
Iraq 25.8 (21.6-30.0) 10.0 (8.0-11.9) 2.5 (0.9-4.2)
Jordan 62.7 (53.5-71.8) 62.7 (53.5-71.8) 9.8 (4.0-15.6)
Kuwait . . . . . . . . . . . . . . . . . .
Lebanon 29.1 (24.2-34.0) 27.5 (22.8-32.1) 7.0 (2.7-11.2)
Libyan Arab Jamahiriya . . . . . . . . . . . . . . . . . .
Morocco 29.5 (27.3-31.8) 27.9 (25.7-30.1) 0.3 (0.1-0.5)
Oman 24.7 (20.9-28.5) 11.0 (9.2-12.9) 1.3 (0.4-2.2)
Pakistan 35.4 (28.6-42.1) 28.9 (23.4-34.4) 6.6 (4.3-8.9)
Qatar . . . . . . . . . . . . . . . . . .
! Saudi Arabia 25.6 (21.9-29.4) 13.2 (11.1-15.2) 3.6 (1.4-5.7)
Somalia . . . . . . . . . . . . . . . . . .
Sudan . . . . . . . . . . . . . . . . . .
Syrian Arab Republic 44.0 (17.7-70.4) 42.0 (34.5-49.5) . . . . . .
Tunisia 51.0 (48.2-53.8) 49.2 (46.5-51.9) 1.9 (1.3-2.6)
! United Arab Emirates 26.1 (20.9-31.2) 13.9 (10.5-17.4) 2.6 (0.6-4.7)
West Bank and Gaza Strip>
. . . . . . . . . . . . . . . . . .
Yemen . . . . . . . . . . . . . . . . . .](https://image.slidesharecdn.com/ol25kkvlqguoxfywagtq-signature-60b0131a05a17be1631d7bde4d7608a3b2ae419a0a24dd90535582b58a53e895-poli-151021161413-lva1-app6891/85/MPOWER-Package-288-320.jpg)
![283WHO REPORT ON THE GLOBAL TOBACCO EPIDEMIC, 2008
Smoking cigarettes [%]b
Males Females
Dailyd
95%CIe
Currentc
95%CIe
Dailyd
95%CIe
Currentc
95%CIe
Dailyd
95%CIe
. . . . . . . . . . . . . . . . . . . . . . . . . . . . . .
1.7 (0.7-2.8) 25.6 (21.9-29.2) 11.5 (9.9-13.2) 2.4 (1.0-3.9) 1.3 (0.5-2.1)
. . . . . . . . . . . . . . . . . . . . . . . . . . . . . .
1.2 (0.8-1.7) 24.5 (22.4-26.6) 22.9 (20.9-24.9) 0.9 (0.5-1.2) 0.8 (0.4-1.2)
4.0 (2.7-5.2) 24.0 (19.5-28.4) 17.9 (14.6-21.2) 1.9 (1.3-2.5) 1.1 (0.8-1.5)
1.6 (0.5-2.6) 25.1 (21.0-29.2) 8.7 (6.9-10.4) 1.9 (0.6-3.1) 1.0 (0.3-1.7)
9.8 (4.0-15.6) 61.9 (52.9-70.9) 61.9 (52.9-70.9) 9.8 (4.0-15.6) 9.8 (4.0-15.6)
. . . . . . . . . . . . . . . . . . . . . . . . . . . . . .
7.0 (2.7-11.2) 29.1 (24.2-34.0) 27.5 (22.8-32.1) 7.0 (2.7-11.2) 7.0 (2.7-11.2)
. . . . . . . . . . . . . . . . . . . . . . . . . . . . . .
0.2 (0.0-0.4) 26.1 (24.0-28.3) 24.6 (22.5-26.6) 0.2 (0.0-0.4) 0.2 (0.0-0.3)
0.3 (0.1-0.6) 24.1 (20.4-27.8) 9.7 (8.0-11.4) 0.3 (0.1-0.6) 0.0 (0.0-0.1)
5.0 (3.2-6.8) 29.7 (24.0-35.4) 23.1 (18.6-27.6) 2.8 (1.7-3.8) 1.8 (1.0-2.5)
. . . . . . . . . . . . . . . . . . . . . . . . . . . . . .
2.4 (0.9-3.8) 25.1 (21.4-28.8) 11.6 (9.8-13.4) 3.4 (1.3-5.4) 2.1 (0.8-3.4)
. . . . . . . . . . . . . . . . . . . . . . . . . . . . . .
. . . . . . . . . . . . . . . . . . . . . . . . . . . . . .
. . . . . . 42.6 (17.1-68.1) 40.6 (33.3-47.9) . . . . . . . . . . . .
1.9 (1.2-2.5) 46.5 (43.9-49.2) 44.7 (42.1-47.3) 1.0 (0.6-1.5) 1.0 (0.5-1.4)
1.2 (0.1-2.4) 25.5 (20.4-30.6) 12.6 (9.4-15.9) 1.6 (0.2-3.1) 0.5 (0.0-1.2)
. . . . . . . . . . . . . . . . . . . . . . . . . . . . . .
. . . . . . . . . . . . . . . . . . . . . . . . . . . . . .](https://image.slidesharecdn.com/ol25kkvlqguoxfywagtq-signature-60b0131a05a17be1631d7bde4d7608a3b2ae419a0a24dd90535582b58a53e895-poli-151021161413-lva1-app6891/85/MPOWER-Package-289-320.jpg)
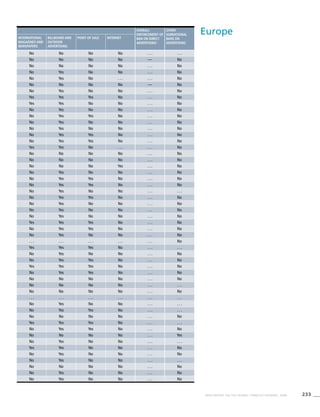
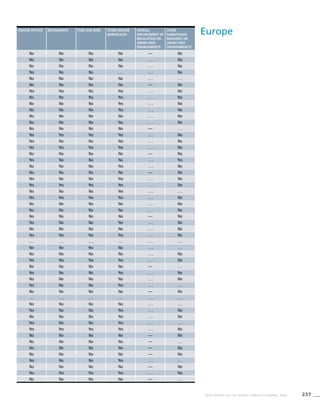
![284 WHO REPORT ON THE GLOBAL TOBACCO EPIDEMIC, 2008
Europe
! Data were not validated by country focal point in time for
publication of this report.
. . . Data not available/not reported
a Definition: Smoking any form of tobacco, including cigarettes,
cigars, pipes, bidis, etc.
b Definition: Smoking manufactured cigarettes.
c Definition: Smoking at the time of the survey, including daily
and non-daily smoking.
d Definition: Smoking everyday at the time of the survey.
e CI: Confidence Interval
Table 3.4b
Age standardized prevalence
estimates for WHO Member
States (Europe)
Country Smoking any tobacco product [%]a
Males Females
Currentc
95%CIe
Dailyd
95%CIe
Currentc
95%CIe
Albania 40.5 (27.2-53.8) 37.3 (25.0-49.6) 4.0 (0.7-7.3)
Andorra 36.5 (30.8-42.2) 33.0 (27.6-38.3) 29.2 (24.0-34.4)
Armenia 55.1 (47.1-63.0) 49.2 (42.1-56.4) 3.7 (1.4-6.1)
Austria 46.4 (44.2-48.5) 41.3 (39.2-43.4) 40.1 (38.2-42.1)
Azerbaijan . . . . . . . . . . . . 0.9 (0.3-1.4)
Belarus 63.7 (53.3-74.0) 57.7 (48.2-67.1) 21.1 (14.9-27.3)
Belgium 30.1 (27.0-33.2) 23.1 (20.6-25.6) 24.1 (22.0-26.2)
Bosnia and Herzegovina 49.3 (42.8-55.9) 45.7 (39.5-51.9) 35.1 (28.9-41.2)
Bulgaria 47.5 (39.2-55.7) 41.3 (33.9-48.7) 27.8 (19.7-35.9)
Croatia 38.9 (37.1-40.7) 35.1 (33.3-36.9) 29.1 (28.0-30.3)
Cyprus . . . . . . . . . . . . . . . . . .
Czech Republic 36.6 (30.0-43.2) 30.0 (24.3-35.6) 25.4 (17.9-32.8)
Denmark 36.1 (34.1-38.1) 28.4 (26.5-30.3) 30.6 (28.7-32.5)
Estonia 49.9 (47.2-52.6) 42.0 (39.3-44.7) 27.5 (25.4-29.7)
Finland 31.8 (29.5-34.2) 24.5 (22.3-26.6) 24.4 (22.4-26.4)
France 36.6 (35.8-37.4) 30.6 (29.9-31.3) 26.7 (26.0-27.4)
Georgia 57.1 (48.4-65.8) 50.9 (43.0-58.7) 6.3 (2.4-10.1)
Germany 37.4 (34.9-40.0) 31.1 (28.9-33.2) 25.8 (24.2-27.3)
Greece 63.6 (56.1-71.2) 60.7 (53.4-68.0) 39.8 (34.7-45.0)
Hungary 45.7 (38.4-53.1) 39.0 (32.7-45.4) 33.9 (24.5-43.2)
Iceland 26.1 (23.6-28.5) 19.4 (17.2-21.6) 26.6 (24.2-29.0)
Ireland 26.5 (21.3-31.6) 19.6 (17.0-22.1) 26.0 (22.6-29.3)
Israel 31.1 (26.3-36.0) 27.5 (23.1-31.9) 17.9 (7.3-28.6)
Italy 32.8 (30.4-35.2) 29.1 (27.0-31.2) 19.2 (17.7-20.6)
Kazakhstan 43.2 (34.9-51.4) 36.5 (29.4-43.7) 9.7 (6.4-13.1)
Kyrgyzstan 46.9 (38.4-55.3) 40.7 (33.3-48.1) 2.2 (1.4-3.1)
Latvia 54.4 (45.6-63.1) 46.8 (39.1-54.6) 24.1 (20.9-27.3)
Lithuania 45.1 (37.9-52.3) 37.2 (31.0-43.4) 20.8 (18.0-23.7)
Luxembourg 39.1 (35.4-42.8) 33.8 (30.5-37.2) 30.3 (27.3-33.2)
Malta 32.8 (28.3-37.2) 29.2 (25.3-33) 24.5 (21.1-28.0)
Monaco . . . . . . . . . . . . . . . . . .
Montenegro . . . . . . . . . . . . . . . . . .
Netherlands 38.3 (37.3-39.2) 31.6 (30.7-32.5) 30.3 (29.4-31.1)
Norway 33.6 (29.1-38.2) 26.1 (22.5-29.7) 30.4 (26.4-34.5)
Poland 43.9 (35.2-52.6) 37.6 (29.8-45.5) 27.2 (18.2-36.3)
Portugal 40.6 (35.1-46.1) 37.0 (31.8-42.2) 31.0 (26.8-35.1)
Republic of Moldova 45.8 (38.4-53.1) 39.3 (32.9-45.7) 5.8 (4.2-7.5)
Romania 40.6 (33.8-47.4) 33.9 (28.1-39.6) 24.5 (17.4-31.7)
Russian Federation 70.1 (59.1-81.2) 64.9 (54.6-75.2) 26.5 (19.1-33.9)
San Marino . . . . . . . . . . . . . . . . . .
Serbia 42.3 (37.4-47.2) 38.6 (33.7-43.4) 42.3 (37.4-47.2)
Slovakia 41.6 (34.6-48.6) 34.8 (28.7-40.8) 20.1 (14.4-25.9)
Slovenia 31.8 (25.7-37.9) 28.4 (22.5-34.2) 21.1 (16.2-26.1)
Spain 36.4 (32.2-40.6) 32.7 (28.9-36.5) 30.9 (27.2-34.6)
Sweden 19.6 (18.6-20.7) 14.4 (13.5-15.3) 24.5 (23.4-25.6)
Switzerland 30.7 (28.2-33.3) 23.6 (21.5-25.7) 22.2 (20.4-24.0)
Tajikistan . . . . . . . . . . . . . . . . . .
The former Yugoslav Republic of
Macedonia
. . . . . . . . . . . . . . . . . .
Turkey 51.6 (44.1-59.2) 45.1 (38.5-51.7) 19.2 (7.9-30.6)
Turkmenistan . . . . . . . . . . . . . . . . . .
Ukraine 63.8 (53.6-74.0) 57.8 (48.4-67.1) 22.7 (16.5-28.9)
United Kingdom of Great Britain and
Northern Ireland
36.7 (35.5-37.8) 28.8 (27.8-29.9) 34.7 (33.7-35.8)
Uzbekistan 24.2 (19.6-28.7) 19.2 (15.4-22.9) 1.2 (0.7-1.7)](https://image.slidesharecdn.com/ol25kkvlqguoxfywagtq-signature-60b0131a05a17be1631d7bde4d7608a3b2ae419a0a24dd90535582b58a53e895-poli-151021161413-lva1-app6891/85/MPOWER-Package-290-320.jpg)
![285WHO REPORT ON THE GLOBAL TOBACCO EPIDEMIC, 2008
Smoking cigarettes [%]b
Males Females
Dailyd
95%CIe
Currentc
95%CIe
Dailyd
95%CIe
Currentc
95%CIe
Dailyd
95%CIe
2.6 (0.4-4.8) 40.5 (27.2-53.8) 37.3 (25.0-49.6) 4.0 (0.7-7.3) 2.6 (0.4-4.8)
24.7 (19.9-29.4) 36.5 (30.8-42.2) 33.0 (27.6-38.3) 29.2 (24.0-34.4) 24.7 (19.9-29.4)
2.5 (0.9-4.2) 55.1 (47.1-63.0) 49.2 (42.1-56.4) 3.7 (1.4-6.1) 2.5 (0.9-4.2)
40.0 (38.0-41.9) 46.4 (44.2-48.5) 41.3 (39.2-43.4) 40.1 (38.2-42.1) 40.0 (38.0-41.9)
0.4 (0.2-0.6) . . . . . . . . . . . . 0.9 (0.3-1.4) 0.4 (0.2-0.6)
16.8 (11.8-21.9) 63.7 (53.3-74.0) 57.7 (48.2-67.1) 21.1 (14.9-27.3) 16.8 (11.8-21.9)
20.0 (18.1-21.8) 30.1 (27.0-33.2) 23.1 (20.6-25.6) 24.1 (22.0-26.2) 20.0 (18.1-21.8)
31.1 (25.5-36.7) 49.3 (42.8-55.9) 45.7 (39.5-51.9) 35.1 (28.9-41.2) 31.1 (25.5-36.7)
23.4 (16.5-30.4) 47.5 (39.2-55.7) 41.3 (33.9-48.7) 27.8 (19.7-35.9) 23.4 (16.5-30.4)
25.2 (24.1-26.3) 38.9 (37.1-40.7) 35.1 (33.3-36.9) 29.1 (28.0-30.3) 25.2 (24.1-26.3)
. . . . . . . . . . . . . . . . . . . . . . . . . . . . . .
20.7 (14.5-26.9) 36.6 (30.0-43.2) 30.0 (24.3-35.6) 25.4 (17.9-32.8) 20.7 (14.5-26.9)
24.0 (22.2-25.7) 36.1 (34.1-38.1) 28.4 (26.5-30.3) 30.6 (28.7-32.5) 24.0 (22.2-25.7)
20.7 (18.7-22.7) 49.9 (47.2-52.6) 42.0 (39.3-44.7) 27.5 (25.4-29.7) 20.7 (18.7-22.7)
17.4 (15.6-19.2) 31.8 (29.5-34.2) 24.5 (22.3-26.6) 24.4 (22.4-26.4) 17.4 (15.6-19.2)
23.6 (22.9-24.2) 36.6 (35.8-37.4) 30.6 (29.9-31.3) 26.7 (26.0-27.4) 23.6 (22.9-24.2)
4.0 (1.5-6.6) 57.1 (48.4-65.8) 50.9 (43.0-58.7) 6.3 (2.4-10.1) 4.0 (1.5-6.6)
22.2 (20.8-23.5) 37.4 (34.9-40.0) 31.1 (28.9-33.2) 25.8 (24.2-27.3) 22.2 (20.8-23.5)
35.4 (30.7-40.0) 63.6 (56.1-71.2) 60.7 (53.4-68.0) 39.8 (34.7-45.0) 35.4 (30.7-40.0)
29.8 (21.6-38.1) 45.7 (38.4-53.1) 39.0 (32.7-45.4) 33.9 (24.5-43.2) 29.8 (21.6-38.1)
19.7 (17.6-21.8) 26.1 (23.6-28.5) 19.4 (17.2-21.6) 26.6 (24.2-29.0) 19.7 (17.6-21.8)
18.9 (16.4-21.4) 26.5 (21.3-31.6) 19.6 (17.0-22.1) 26.0 (22.6-29.3) 18.9 (16.4-21.4)
15.1 (6.1-24.1) 31.1 (26.3-36.0) 27.5 (23.1-31.9) 17.9 (7.3-28.6) 15.1 (6.1-24.1)
15.5 (14.3-16.7) 32.8 (30.4-35.2) 29.1 (27.0-31.2) 19.2 (17.7-20.6) 15.5 (14.3-16.7)
6.5 (4.1-8.8) 43.2 (34.9-51.4) 36.5 (29.4-43.7) 9.7 (6.4-13.1) 6.5 (4.1-8.8)
1.2 (0.7-1.8) 46.9 (38.4-55.3) 40.7 (33.3-48.1) 2.2 (1.4-3.1) 1.2 (0.7-1.8)
17.4 (14.7-20.1) 54.4 (45.6-63.1) 46.8 (39.1-54.6) 24.1 (20.9-27.3) 17.4 (14.7-20.1)
14.0 (11.7-16.4) 45.1 (37.9-52.3) 37.2 (31.0-43.4) 20.8 (18.0-23.7) 14.0 (11.7-16.4)
27.9 (25.1-30.7) 39.1 (35.4-42.8) 33.8 (30.5-37.2) 30.3 (27.3-33.2) 27.9 (25.1-30.7)
20.4 (17.5-23.3) 32.8 (28.3-37.2) 29.2 (25.2-33.2) 24.5 (21.1-28.0) 20.4 (17.5-23.3)
. . . . . . . . . . . . . . . . . . . . . . . . . . . . . .
. . . . . . . . . . . . . . . . . . . . . . . . . . . . . .
27.5 (26.6-28.4) 38.3 (37.3-39.2) 31.6 (30.7-32.5) 30.3 (29.4-31.1) 27.5 (26.6-28.4)
23.7 (20.4-27.0) 33.6 (29.1-38.2) 26.1 (22.5-29.7) 30.4 (26.4-34.5) 23.7 (20.4-27.0)
23.3 (15.3-31.3) 43.9 (35.2-52.6) 37.6 (29.8-45.5) 27.2 (18.2-36.3) 23.3 (15.3-31.3)
26.3 (22.6-30.0) 40.6 (35.1-46.1) 37.0 (31.8-42.2) 31.0 (26.8-35.1) 26.3 (22.6-30.0)
3.7 (2.6-4.7) 45.8 (38.4-53.1) 39.3 (32.9-45.7) 5.8 (4.2-7.5) 3.7 (2.6-4.7)
19.9 (14.0-25.8) 40.6 (33.8-47.4) 33.9 (28.1-39.6) 24.5 (17.4-31.7) 19.9 (14.0-25.8)
21.6 (15.5-27.7) 70.1 (59.1-81.2) 64.9 (54.6-75.2) 26.5 (19.1-33.9) 21.6 (15.5-27.7)
. . . . . . . . . . . . . . . . . . . . . . . . . . . . . .
38.6 (33.7-43.4) 43.8 (39.1-48.6) 40.6 (35.9-45.4) 43.8 (39.1-48.6) 40.6 (35.9-45.4)
15.5 (11.0-20.0) 41.6 (34.6-48.6) 34.8 (28.7-40.8) 20.1 (14.4-25.9) 15.5 (11.0-20.0)
18.3 (13.7-22.9) 31.8 (25.7-37.9) 28.4 (22.5-34.2) 21.1 (16.2-26.1) 18.3 (13.7-22.9)
27.1 (23.8-30.4) 36.4 (32.2-40.6) 32.7 (28.9-36.5) 30.9 (27.2-34.6) 27.1 (23.8-30.4)
18.1 (17.2-19.1) 19.6 (18.6-20.7) 14.4 (13.5-15.3) 24.5 (23.4-25.6) 18.1 (17.2-19.1)
17.7 (16.2-19.3) 30.7 (28.2-33.3) 23.6 (21.5-25.7) 22.2 (20.4-24.0) 17.7 (16.2-19.3)
. . . . . . . . . . . . . . . . . . . . . . . . . . . . . .
. . . . . . . . . . . . . . . . . . . . . . . . . . . . . .
14.8 (6.0-23.5) 51.6 (44.1-59.2) 45.1 (38.5-51.7) 19.2 (7.9-30.6) 14.8 (6.0-23.5)
. . . . . . . . . . . . . . . . . . . . . . . . . . . . . .
18.2 (13.2-23.2) 63.8 (53.6-74.0) 57.8 (48.4-67.1) 22.7 (16.5-28.9) 18.2 (13.2-23.2)
27.9 (27.0-28.9) 36.7 (35.5-37.8) 28.8 (27.8-29.9) 34.7 (33.7-35.8) 27.9 (27.0-28.9)
0.6 (0.3-0.9) 24.2 (19.6-28.7) 19.2 (15.4-22.9) 1.2 (0.7-1.7) 0.6 (0.3-0.9)](https://image.slidesharecdn.com/ol25kkvlqguoxfywagtq-signature-60b0131a05a17be1631d7bde4d7608a3b2ae419a0a24dd90535582b58a53e895-poli-151021161413-lva1-app6891/85/MPOWER-Package-291-320.jpg)
![286 WHO REPORT ON THE GLOBAL TOBACCO EPIDEMIC, 2008
South-East
Asia
Table 3.5b
Age standardized prevalence
estimates for WHO Member
States (South-East Asia)
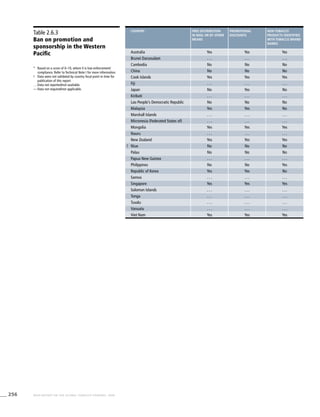
Western Pacific
Table 3.6b
Age standardized prevalence
estimates for WHO Member
States (Western Pacific)
Country Smoking any tobacco product [%]a
Males Females
Currentc
95%CIe
Dailyd
95%CIe
Currentc
95%CIe
Bangladesh 47.0 (38.1-55.9) 41.7 (33.8-49.7) 3.8 (2.3-5.2)
Bhutan . . . . . . . . . . . . . . . . . .
Democratic People’s Republic
of Korea
58.6 (56.1-61.1) 56.5 (39.7-73.2) . . . . . .
India 33.1 (26.7-39.5) 24.9 (20.1-29.7) 3.8 (2.6-5.0)
Indonesia 65.9 (57.9-73.9) 58.4 (51.3-65.6) 4.5 (4.0-5.0)
Maldives 44.5 (36.1-52.9) 38.1 (30.8-45.3) 11.6 (7.8-15.3)
Myanmar 46.5 (40.6-52.4) 36.3 (31.6-41.0) 13.6 (12.3-14.9)
Nepal 34.8 (28.3-41.4) 28.7 (23.3-34.2) 26.4 (18-34.8)
Sri Lanka 30.2 (24.4-36.0) 23.9 (19.2-28.5) 2.6 (1.6-3.5)
Thailand 39.8 (35.0-44.5) 29.5 (25.9-33.0) 3.4 (3.3-3.6)
Timor-Leste . . . . . . . . . . . . . . . . . .
Country Smoking any tobacco product [%]a
Males Females
Currentc
95%CIe
Dailyd
95%CIe
Currentc 95%CIe
! Australia 27.7 (24.3-31.1) 21.8 (19-24.5) 21.8 (18.6-25.1)
Brunei Darussalam . . . . . . . . . . . . . . . . . .
Cambodia 40.5 (35.5-45.6) 31.0 (27.1-35.0) 6.5 (5.8-7.1)
China 59.5 (47.7-71.3) 57.1 (40.3-73.9) 3.7 (3.1-4.4)
Cook Islands 36.1 (27.0-45.3) 31.8 (23.4-40.2) 20.0 (13.9-26.2)
Fiji 23.6 (18.7-28.5) 19.1 (15.1-23.1) 5.1 (3.8-6.3)
Japan 44.3 (35.4-53.2) 41.0 (28.8-53.2) 14.3 (12.0-16.5)
Kiribati . . . . . . . . . . . . . . . . . .
Lao People’s Democratic Republic 65.0 (57.0-73.1) 57.9 (50.7-65.2) 15.6 (14.4-16.8)
Malaysia 54.4 (47.2-61.6) 43.8 (37.7-49.8) 2.8 (1.9-3.6)
Marshall Islands . . . . . . . . . . . . . . . . . .
Micronesia (Federated States of) . . . . . . . . . . . . . . . . . .
Mongolia 45.8 (32.1-59.5) 42.7 (29.9-55.5) 6.5 (4.7-8.2)
Nauru 46.1 (36.7-55.6) 43.6 (34.6-52.7) 52.4 (41.1-63.7)
New Zealand 29.7 (25.6-33.8) 23.9 (20.6-27.2) 27.5 (23.2-31.9)
Niue . . . . . . . . . . . . . . . . . .
Palau 38.1 (28.1-48.2) 34.0 (24.7-43.4) 9.7 (5.1-14.3)
Papua New Guinea . . . . . . . . . . . . . . . . . .
Philippines 42.0 (36.8-47.3) 32.5 (28.4-36.7) 9.8 (8.9-10.7)
Republic of Korea 53.3 (37.5-69.1) 50.2 (35.3-65.2) 5.7 (4.6-6.8)
Samoa 58.3 (45.5-71.1) 56.7 (44.1-69.3) 23.4 (16.6-30.3)
* Singapore . . . . . . 22.0 (18.8-25.2) . . . . . .
Solomon Islands . . . . . . . . . . . . . . . . . .
Tonga 61.8 (48.9-74.7) 60.6 (47.9-73.3) 15.8 (11.4-20.3)
Tuvalu . . . . . . . . . . . . . . . . . .
Vanuatu 49.1 (38.9-59.3) 47.1 (37.3-56.9) 8.1 (5.6-10.7)
! Viet Nam 45.7 (39.7-51.8) 35.2 (30.4-40.1) 2.5 (1.8-3.3)](https://image.slidesharecdn.com/ol25kkvlqguoxfywagtq-signature-60b0131a05a17be1631d7bde4d7608a3b2ae419a0a24dd90535582b58a53e895-poli-151021161413-lva1-app6891/85/MPOWER-Package-292-320.jpg)
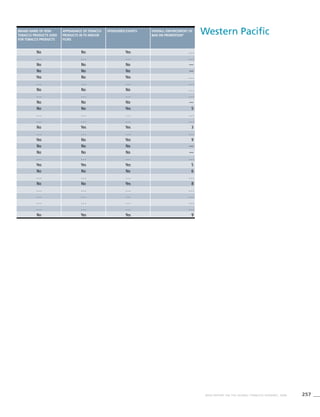
![287WHO REPORT ON THE GLOBAL TOBACCO EPIDEMIC, 2008
! Data were not validated by country focal point in time for
publication of this report.
. . . Data not available/not reported
a
Definition: Smoking any form of tobacco, including cigarettes,
cigars, pipes, bidis, etc.
b
Definition: Smoking manufactured cigarettes.
c
Definition: Smoking at the time of the survey, including daily
and non-daily smoking.
d
Definition: Smoking everyday at the time of the survey.
e
CI: Confidence Interval
! Data were not validated by country focal point in time for
publication of this report.
. . . Data not available/not reported.
a
Definition: Smoking any form of tobacco, including cigarettes,
cigars, pipes, bidis, etc.
b
Definition: Smoking manufactured cigarettes.
c
Definition: Smoking at the time of the survey, including daily
and non-daily smoking.
d
Definition: Smoking everyday at the time of the survey.
e
CI: Confidence Interval
* Current smoking prevalence not validated
Smoking cigarettes [%]b
Males Females
Dailyd
95%CIe
Currentc
95%CIe
Dailyd
95%CIe
Currentc
95%CIe
Dailyd
95%CIe
2.6 (1.6-3.7) 42.8 (34.6-50.9) 37.2 (30.0-44.3) 0.9 (0.4-1.4) 0.5 (0.2-0.8)
. . . . . . . . . . . . . . . . . . . . . . . . . . . . . .
. . . . . . 58.6 (56.1-61.1) 56.5 (39.7-73.2) . . . . . . . . . . . .
1.8 (1.2-2.4) 27.6 (22.2-32.9) 21.5 (17.3-25.6) 1.0 (0.6-1.3) 0.5 (0.3-0.7)
3.2 (2.8-3.6) 62.1 (54.5-69.6) 53.6 (47.0-60.1) 4.0 (3.5-4.4) 2.8 (2.4-3.2)
9.7 (6.5-12.8) 39.7 (32.2-47.2) 33.0 (26.7-39.3) 8.9 (6.0-11.9) 7.2 (4.8-9.6)
11.0 (9.8-12.1) 43.6 (38.0-49.1) 32.9 (28.5-37.2) 11.7 (10.5-12.8) 9.2 (8.2-10.3)
25.4 (17.3-33.5) 29.3 (23.8-34.9) 23.1 (18.7-27.5) 26.2 (17.9-34.6) 25.3 (17.2-33.3)
1.6 (0.9-2.2) 24.5 (19.7-29.2) 18.3 (14.7-22.0) 0.4 (0.2-0.7) 0.2 (0.0-0.3)
2.4 (2.3-2.5) 37.1 (32.7-41.6) 26.7 (23.5-29.9) 3.0 (2.9-3.1) 2.1 (2.0-2.2)
. . . . . . . . . . . . . . . . . . . . . . . . . . . . . .
Smoking cigarettes [%]b
Males Females
Dailyd
95%CIe
Currentc
95%CIe
Dailyd
95%CIe
Currentc
95%CIe
Dailyd
95%CIe
15.6 (13.3-18.0) 27.7 (24.3-31.1) 21.8 (19.0-24.5) 21.8 (18.6-25.1) 15.6 (13.3-18.0)
. . . . . . . . . . . . . . . . . . . . . . . . . . . . . .
4.7 (4.2-5.2) 37.9 (33.2-42.7) 27.9 (24.4-31.5) 5.7 (5.1-6.2) 4.1 (3.6-4.6)
3.4 (2.9-3.9) 59.5 (54.6-64.5) 57.1 (40.3-73.9) 3.7 (2.6-4.9) 3.4 (2.9-3.9)
14.0 (9.1-18.9) 36.1 (27.0-45.3) 31.8 (23.4-40.2) 20.0 (13.9-26.2) 14.0 (9.1-18.9)
2.6 (1.8-3.3) 23.6 (18.7-28.5) 19.1 (15.1-23.1) 5.1 (3.8-6.3) 2.6 (1.8-3.3)
11.1 (9.3-12.9) 44.3 (39.6-49.1) 41.0 (28.8-53.2) 14.3 (12.0-16.5) 11.1 (9.3-12.9)
. . . . . . . . . . . . . . . . . . . . . . . . . . . . . .
12.3 (11.3-13.4) 61.1 (53.5-68.6) 53.0 (46.3-59.6) 13.6 (12.5-14.7) 10.6 (9.6-11.5)
1.9 (1.2-2.6) 51.1 (44.2-57.9) 40.0 (34.3-45.7) 2.5 (1.7-3.3) 1.7 (1.0-2.3)
. . . . . . . . . . . . . . . . . . . . . . . . . . . . . .
. . . . . . . . . . . . . . . . . . . . . . . . . . . . . .
5.6 (4.1-7.2) 45.8 (32.1-59.5) 42.7 (29.9-55.5) 6.5 (4.7-8.2) 5.6 (4.1-7.2)
49.9 (39.1-60.7) 46.1 (36.7-55.6) 43.6 (34.6-52.7) 52.4 (41.1-63.7) 49.9 (39.1-60.7)
21.5 (18.1-24.8) 29.7 (25.6-33.8) 23.9 (20.6-27.2) 27.5 (23.2-31.9) 21.5 (18.1-24.8)
. . . . . . . . . . . . . . . . . . . . . . . . . . . . . .
7.2 (3.3-11.1) 38.1 (28.1-48.2) 34.0 (24.7-43.4) 9.7 (5.1-14.3) 7.2 (3.3-11.1)
. . . . . . . . . . . . . . . . . . . . . . . . . . . . . .
7.5 (6.7-8.2) 38.9 (34.1-43.8) 29.2 (25.5-32.9) 8.5 (7.7-9.3) 6.4 (5.7-7.1)
4.8 (3.8-5.7) 53.3 (51.0-55.6) 50.2 (35.3-65.2) 5.7 (4.9-6.5) 4.8 (3.8-5.7)
17.5 (11.9-23.2) 58.3 (45.5-71.1) 56.7 (44.1-69.3) 23.4 (16.6-30.3) 17.5 (11.9-23.2)
4.4 (3.5-5.2) . . . . . . 20.3 (17.3-23.3) . . . . . . 3.9 (3.1-4.8)
. . . . . . . . . . . . . . . . . . . . . . . . . . . . . .
10.8 (7.4-14.2) 61.8 (48.9-74.7) 60.6 (47.9-73.3) 15.8 (11.4-20.3) 10.8 (7.4-14.2)
. . . . . . . . . . . . . . . . . . . . . . . . . . . . . .
4.5 (2.8-6.2) 49.1 (38.9-59.3) 47.1 (37.3-56.9) 8.1 (5.6-10.7) 4.5 (2.8-6.2)
1.8 (1.2-2.3) 42.9 (37.1-48.6) 32.0 (27.5-36.6) 2.2 (1.5-2.9) 1.5 (1.0-2.1)](https://image.slidesharecdn.com/ol25kkvlqguoxfywagtq-signature-60b0131a05a17be1631d7bde4d7608a3b2ae419a0a24dd90535582b58a53e895-poli-151021161413-lva1-app6891/85/MPOWER-Package-293-320.jpg)

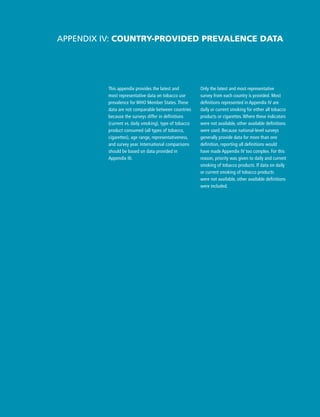
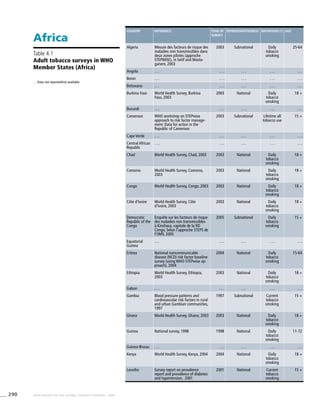
![291WHO REPORT ON THE GLOBAL TOBACCO EPIDEMIC, 2008
Male
prevalence
[%]
Female
prevalence
[%]
Both sexes
prevalence
[%]
Definition (2) Age Male
prevalence
[%]
Female
prevalence
[%]
Both sexes
prevalence
[%]
32.3 0.4 12.8 Current
tobacco
smoking
25-64 38.1 0.5 15.1
. . . . . . . . . . . . . . . . . . . . . . . .
. . . . . . . . . . . . . . . . . . . . . . . .
. . . . . . . . . . . . . . . . . . . . . . . .
19.0 10.3 14.4 Current
tobacco
smoking
18 + 23.6 11.1 16.9
. . . . . . . . . . . . . . . . . . . . . . . .
. . . . . . 13.2 . . . . . . . . . . . . . . .
. . . . . . . . . . . . . . . . . . . . . . . .
. . . . . . . . . . . . . . . . . . . . . . . .
13.2 2.1 7.5 Current
tobacco
smoking
18 + 17.4 2.9 10.0
24.1 15.0 19.5 Current
tobacco
smoking
18 + 27.8 17.0 22.3
10.7 1.1 5.5 Current
tobacco
smoking
18 + 13.0 1.3 6.6
14.5 1.2 8.9 Current
tobacco
smoking
18 + 19.3 2.3 12.1
10.2 0.6 4.4 Current
tobacco
smoking
15 + 14.2 1.2 6.4
. . . . . . . . . . . . . . . . . . . . . . . .
. . . . . . 7.2 Current
tobacco
smoking
15-64 . . . . . . 8.0
5.3 0.4 2.8 Current
tobacco
smoking
18 + 6.3 0.5 3.3
. . . . . . . . . . . . . . . . . . . . . . . .
38.5 4.4 . . . . . . . . . . . . . . . . . .
6.2 0.4 3.2 Current
tobacco
smoking
18 + 9.0 1.2 5.0
. . . 8.6 57.6 . . . . . . . . . . . . . . .
. . . . . . . . . . . . . . . . . . . . . . . .
21.2 0.9 10.8 Current
tobacco
smoking
18 + 26.2 1.9 13.7
47.9 34.2 39.3 . . . . . . . . . . . . . . .](https://image.slidesharecdn.com/ol25kkvlqguoxfywagtq-signature-60b0131a05a17be1631d7bde4d7608a3b2ae419a0a24dd90535582b58a53e895-poli-151021161413-lva1-app6891/85/MPOWER-Package-297-320.jpg)
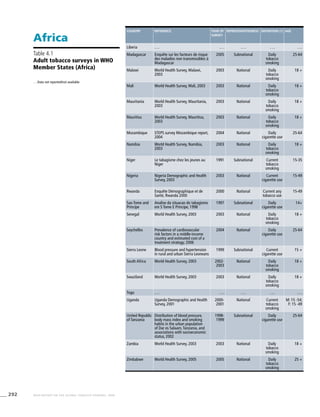
![293WHO REPORT ON THE GLOBAL TOBACCO EPIDEMIC, 2008
Male
prevalence
[%]
Female
prevalence
[%]
Both sexes
prevalence
[%]
Definition (2) Age Male
prevalence
[%]
Female
prevalence
[%]
Both sexes
prevalence
[%]
. . . . . . . . . . . . . . . . . . . . . . . .
. . . . . . 14.1 Current
tobacco
smoking
25-64 . . . . . . 17.6
20.6 5.1 12.7 Current
tobacco
smoking
18 + 25.5 6.1 15.6
18.8 1.6 9.5 Current
tobacco
smoking
18 + 24.1 2.3 12.3
23.2 3.2 12.8 Current
tobacco
smoking
18 + 27.4 4.2 15.4
32.2 1.1 16.4 Current
tobacco
smoking
18 + 42.4 2.9 22.3
16.7 1.9 7.7 Current all
tobacco use
25-64 38.8 15.0 24.3
22.3 9.4 15.4 Current
tobacco
smoking
18 + 28.0 12.4 19.6
40.6 11.3 35.1 . . . . . . . . . . . . . . .
. . . 0.5 . . . Current
tobacco
smoking
15-49 . . . 1.0 . . .
. . . 8.3 . . . . . . . . . . . . . . . . . .
28.8 14.3 25.0 . . . . . . . . . . . . . . .
19.8 1.0 10.0 Current
tobacco
smoking
18 + 22.2 1.7 11.6
30.8 3.9 17.4 . . . . . . . . . . . . . . .
32.3 10.3 17.7 . . . . . . . . . . . . . . .
27.1 8.2 17.1 Current
tobacco
smoking
18 + 36 10.2 22.4
9.9 2.1 5.4 Current
tobacco
smoking
18 + 13.8 3.3 7.7
. . . . . . . . . . . . . . . . . . . . . . . .
25.2 3.3 . . . . . . . . . . . . . . . . . .
23.0 1.3 . . . . . . . . . . . . . . . . . .
15.3 3.4 9.2 Current
tobacco
smoking
18 + 22.7 5.7 14.0
33.4 5.0 12.1 Daily
cigarette use
25 + 26.7 1.4 7.9](https://image.slidesharecdn.com/ol25kkvlqguoxfywagtq-signature-60b0131a05a17be1631d7bde4d7608a3b2ae419a0a24dd90535582b58a53e895-poli-151021161413-lva1-app6891/85/MPOWER-Package-299-320.jpg)
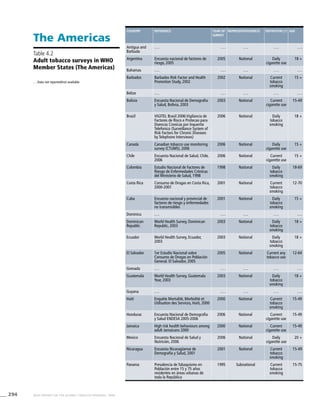
![295WHO REPORT ON THE GLOBAL TOBACCO EPIDEMIC, 2008
Male
prevalence
[%]
Female
prevalence
[%]
Both sexes
prevalence
[%]
Definition (2) Age Male
prevalence
[%]
Female
prevalence
Both sexes
prevalence
[%]
. . . . . . . . . . . . . . . . . . . . . . . .
26.2 18.6 22.2 Current
cigarette use
18 + 35.1 24.9 29.7
. . . . . . . . . . . . . . . . . . . . . . . .
19.3 3.0 7.1 . . . . . . . . . . . . . . .
. . . . . . . . . . . . . . . . . . . . . . . .
. . . 29.6 . . . Current
tobacco
smoking
15-49 . . . 32.5 . . .
16.9 10.0 . . . Current
tobacco
smoking
18 + 20.3 12.8 16.2
15.3 11.8 13.5 Current
cigarette use
15 + 19.9 15.5 17.7
43.6 31.8 37.4 . . . . . . . . . . . . . . .
26.8 11.3 18.9 . . . . . . . . . . . . . . .
23.3 8.2 . . . . . . . . . . . . . . . . . .
41.6 23.0 31.6 . . . . . . . . . . . . . . .
. . . . . . . . . . . . . . . . . . . . . . . .
15.3 10.8 13.1 Current
tobacco
smoking
18 + 17.2 12.5 14.9
6.1 1.3 3.7 Current
tobacco
smoking
18 + 26.3 6.6 16.5
21.5 3.4 11.7 . . . . . . . . . . . . . . .
. . . . . . . . . . . . . . . . . . . . . . . .
8.3 0.9 3.7 Current
tobacco
smoking
18 + 23.9 3.4 11.2
. . . . . . . . . . . . . . . . . . . . . . . .
. . . 4.4 . . . . . . . . . . . . . . . . . .
. . . 2.3 . . . . . . . . . . . . . . . . . .
28.6 7.7 . . . . . . . . . . . . . . . . . .
21.6 6.5 13.3 Current
cigarette use
20 + 30.4 9.5 18.9
. . . 5.3 . . . . . . . . . . . . . . . . . .
52.1 19.5 35.8 . . . . . . . . . . . . . . .
WHO REPORT ON THE GLOBAL TOBACCO EPIDEMIC, 2008](https://image.slidesharecdn.com/ol25kkvlqguoxfywagtq-signature-60b0131a05a17be1631d7bde4d7608a3b2ae419a0a24dd90535582b58a53e895-poli-151021161413-lva1-app6891/85/MPOWER-Package-301-320.jpg)
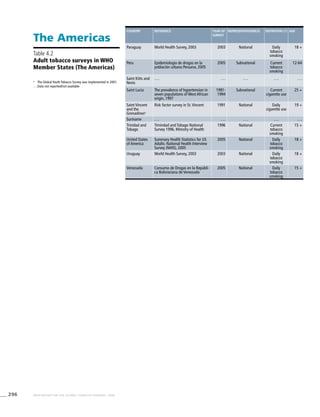
![297WHO REPORT ON THE GLOBAL TOBACCO EPIDEMIC, 2008
Male
prevalence
[%]
Female
prevalence
[%]
Both sexes
prevalence
[%]
Definition (2) Age Male
prevalence
[%]
Female
prevalence
Both sexes
prevalence
[%]
23.5 6.5 14.9 Current
tobacco
smoking
18 + 41.6 13.3 27.3
42.6 22.5 31.8 . . . . . . . . . . . . . . .
. . . . . . . . . . . . . . . . . . . . . . . .
37.3 5.6 19.9 . . . . . . . . . . . . . . .
17.4 1.9 8.6 Current
cigarette use
19+ 26.4 3.5 13.5
. . . . . . . . . . . . . . . . . . . . . . . .
29.8 5.1 21.1 . . . . . . . . . . . . . . .
20.7 15.5 18.0 Current
tobacco
smoking
18 + 27.5 19.0 23.2
33.8 23.4 28.4 Current
tobacco
smoking
18 + 38.8 28.4 33.3
20.9 13.0 16.9 Current
tobacco
smoking
15 + 22.6 13.6 18.0](https://image.slidesharecdn.com/ol25kkvlqguoxfywagtq-signature-60b0131a05a17be1631d7bde4d7608a3b2ae419a0a24dd90535582b58a53e895-poli-151021161413-lva1-app6891/85/MPOWER-Package-303-320.jpg)
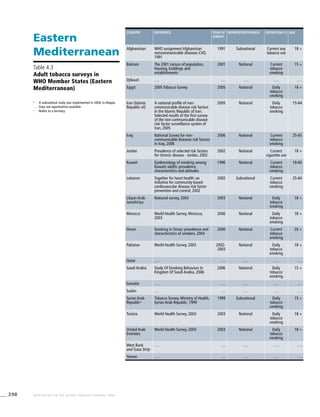
![299WHO REPORT ON THE GLOBAL TOBACCO EPIDEMIC, 2008
Male
prevalence
[%]
Female
prevalence
[%]
Both sexes
prevalence
[%]
Definition (2) Age Male
prevalence
[%]
Female
prevalence
[%]
Both sexes
prevalence
[%]
82.0 17.0 . . . . . . . . . . . . . . . . . .
15.0 3.1 10.2 . . . . . . . . . . . . . . .
. . . . . . . . . . . . . . . . . . . . . . . .
39.2 0.4 19.1 Current
tobacco
smoking
18 + 59.3 2.7 29.9
20.9 2.9 11.9 Current
tobacco
smoking
15-64 24.1 4.3 14.2
41.5 6.9 21.9 Daily tobacco
smoking
25-65 5.0 4.1 3.4
50.5 8.3 29.8 . . . . . . . . . . . . . . .
34.4 1.9 17.0 . . . . . . . . . . . . . . .
61.0 57.1 58.8 Current
cigarette use
25-64 42.3 30.6 35.7
32.0 1.5 16.7 . . . . . . . . . . . . . . .
30.3 0.2 15.1 Daily
cigarette use
18 + 27.4 0.2 13.6
13.4 0.5 7.0 . . . . . . . . . . . . . . .
27.3 4.4 15.9 Current
tobacco
smoking
18 + 32.4 5.7 19.1
. . . . . . . . . . . . . . . . . . . . . . . .
37.6 6.0 22.0 . . . . . .
. . . . . . . . . . . . . . . . . . . . . . . .
. . . . . . . . . . . . . . . . . . . . . . . .
47.0 8.0 26.0 Current
tobacco
smoking
15 + 51.0 10.0 29.0
50.3 1.9 25.8 Current
tobacco
smoking
18 + 52.1 2.0 26.7
17.6 1.4 12.8 Current
tobacco
smoking
18 + 28.1 2.4 20.5
. . . . . . . . . . . . . . . . . . . . . . . .
. . . . . . . . . . . . . . . . . . . . . . . .](https://image.slidesharecdn.com/ol25kkvlqguoxfywagtq-signature-60b0131a05a17be1631d7bde4d7608a3b2ae419a0a24dd90535582b58a53e895-poli-151021161413-lva1-app6891/85/MPOWER-Package-305-320.jpg)
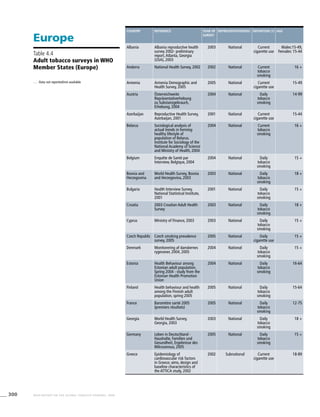
![301WHO REPORT ON THE GLOBAL TOBACCO EPIDEMIC, 2008
Male
prevalence
[%]
Female
prevalence
[%]
Both sexes
prevalence
[%]
Definition (2) Age Male
prevalence
[%]
Female
prevalence
[%]
Both sexes
prevalence
[%]
46.3 3.0 . . . . . . . . . . . . . . . . . .
42.0 30.0 36.0 . . . . . . . . . . . . . . .
60.5 1.7 . . . . . . . . . . . . . . . . . .
40.2 35.5 . . . Current
tobacco
smoking
14-99 48.0 47.0 47.0
. . . 0.6 . . . . . . . . . . . . . . . . . .
56.8 15.4 34.3 . . . . . . . . . . . . . . .
28.0 19.7 23.7 Current
tobacco
smoking
15 + 32.5 23.0 27.6
46.6 24.9 35.5 Current
tobacco
smoking
18 + 54.2 34.2 44.0
40.8 22.8 32.7 . . . . . . . . . . . . . . .
30.0 17.8 22.9 Current
tobacco
smoking
18 + 31.6 22.9 26.6
38.1 10.5 23.9 . . . . . . . . . . . . . . .
29.6 19.4 24.3 Current
cigarette use
15 + 33.8 22.9 28.2
28.6 24.1 26.3 Current
tobacco
smoking
15 + 31.5 25.9 28.7
47.7 21.1 32.8 Current
tobacco
smoking
16-64 55.5 30.7 41.6
26.0 18.0 22.0 Current
tobacco
smoking
16-64 32.9 24.5 28.7
28.2 21.7 25.0 Current
tobacco
smoking
12-75 33.3 26.5 29.9
50.4 4.1 25.1 Current
tobacco
smoking
18 + 58.1 5.4 29.4
27.9 18.8 23.2 Current
tobacco
smoking
15 + 32.2 22.4 27.2
51.0 39.0 . . . Daily
cigarette use
18-89 47.4 39.6 . . .](https://image.slidesharecdn.com/ol25kkvlqguoxfywagtq-signature-60b0131a05a17be1631d7bde4d7608a3b2ae419a0a24dd90535582b58a53e895-poli-151021161413-lva1-app6891/85/MPOWER-Package-307-320.jpg)
![303WHO REPORT ON THE GLOBAL TOBACCO EPIDEMIC, 2008
Male
prevalence
[%]
Female
prevalence
[%]
Both sexes
prevalence
[%]
Definition (2) Age Male
prevalence
[%]
Female
prevalence
[%]
Both sexes
prevalence
[%]
38.6 27.7 32.8 Current
tobacco
smoking
18 + 42.5 31.3 36.5
19.3 19.2 . . . Current
tobacco
smoking
15-89 22.0 23.0 . . .
24.9 25.3 . . . . . . . . . . . . . . . . . .
13.9 9.1 . . . . . . . . . . . . . . . . . .
28.3 16.2 22.0 . . . . . . . . . . . . . . .
38.7 5.8 21.6 Current
tobacco
smoking
18 + 52.2 9.6 29.9
45.0 1.6 21.8 Current
cigarette use
15 + 41.7 1.5 20.2
47.3 17.8 30.1 Current
tobacco
smoking
15-64 53.0 23.7 35.9
39.0 14.0 25.0 Current
tobacco
smoking
20-64 45.8 20.3 31.5
36.0 26.0 31.0 . . . . . . . . . . . . . . .
29.9 17.6 23.3 Current
cigarette use
15-98 . . . . . . 26.1
. . . . . . . . . . . . . . . . . . . . . . . .
. . . . . . . . . . . . . . . . . . . . . . . .
31.0 25.0 28.0 . . . . . . . . . . . . . . .
27.0 24.0 26.0 Current
cigarette use
16-74 39.0 35.0 37.0
38.0 25.6 32.0 . . . . . . . . . . . . . . .
35.0 17.6 . . . . . . . . . . . . . . . . . .
51.1 7.1 . . . . . . . . . . . . . . . . . .
33.0 27.1 30.0 . . . . . . . . . . . . . . .
60.4 15.5 . . . . . . . . . . . . . . . . . .
. . . . . . . . . . . . . . . . . . . . . . . .
36.0 36.0 36.0 . . . . . . . . . . . . . . .](https://image.slidesharecdn.com/ol25kkvlqguoxfywagtq-signature-60b0131a05a17be1631d7bde4d7608a3b2ae419a0a24dd90535582b58a53e895-poli-151021161413-lva1-app6891/85/MPOWER-Package-309-320.jpg)
![304 WHO REPORT ON THE GLOBAL TOBACCO EPIDEMIC, 2008
Country Reference Year of
survey
Representativeness Definition (1) Age
Slovakia World Health Survey, 2003 2003 National Daily
tobacco
smoking
18 +
Slovenia World Health Survey, 2003 2003 National Daily
tobacco
smoking
18 +
Spain World Health Survey, 2003 2002-
2003
National Daily
tobacco
smoking
18 +
Sweden The Swedish survey of living
conditions, 2004
2002-
2003
National Daily
tobacco
smoking
16-84
Switzerland Tabakmonitoring:
Entwicklung Rauchprävalenz
2001 bis 2005 [Prevalence
of tobacco use from 2001 to
2005], 2006
2005 National Daily
cigarette use
15-65
Tajikistan . . . . . . . . . . . . . . .
The former
Yugoslav
Republic of
Macedonia
. . . . . . . . . . . . . . .
Turkey World Health Survey, 2003 2003 National Daily
tobacco
smoking
18 +
Turkmenistan . . . . . . . . . . . . . . .
Ukraine Tobacco in Ukraine, 2006 2005 National Daily
tobacco
smoking
15 +
United
Kingdom of
Great Britain
and Northern
Ireland
General Household Survey-
Great Britain, 2002
2002 Subnational Daily
cigarette use
16 +
Uzbekistan Uzbekistan Health
Examination Survey, 2003
2002 National Current
cigarette use
Males: 15-59;
Females: 15-49
Europe
Table 4.4
Adult tobacco surveys in WHO
Member States (Europe)
. . . Data not reported/not available](https://image.slidesharecdn.com/ol25kkvlqguoxfywagtq-signature-60b0131a05a17be1631d7bde4d7608a3b2ae419a0a24dd90535582b58a53e895-poli-151021161413-lva1-app6891/85/MPOWER-Package-310-320.jpg)
![305WHO REPORT ON THE GLOBAL TOBACCO EPIDEMIC, 2008
Male
prevalence
[%]
Female
prevalence
[%]
Both sexes
prevalence
[%]
Definition (2) Age Male
prevalence
[%]
Female
prevalence
[%]
Both sexes
prevalence
[%]
32.8 14.3 22.1 Current
tobacco
smoking
18 + 40.8 23.0 30.5
25.3 16.8 20.7 Current
tobacco
smoking
18 + 28.3 18.4 23.0
34.1 23.7 28.7 Current
tobacco
smoking
18 + 40.0 26.8 33.2
16.5 18.8 . . . . . . . . . . . . . . . . . .
24.0 19.0 22.0 Current
cigarette use
15-65 35.0 26.0 31.0
. . . . . . . . . . . . . . . . . . . . . . . .
. . . . . . . . . . . . . . . . . . . . . . . .
49.9 15.6 32.7 Current
tobacco
smoking
18 + 52.0 17.3 34.6
. . . . . . . . . . . . . . . . . . . . . . . .
62.3 16.7 37.4 Current
tobacco
smoking
15 + 66.8 19.9 41.2
27.0 25.0 26.0 . . . . . . . . . . . . . . .
22.6 0.9 . . . . . . . . . . . . . . . . . .](https://image.slidesharecdn.com/ol25kkvlqguoxfywagtq-signature-60b0131a05a17be1631d7bde4d7608a3b2ae419a0a24dd90535582b58a53e895-poli-151021161413-lva1-app6891/85/MPOWER-Package-311-320.jpg)
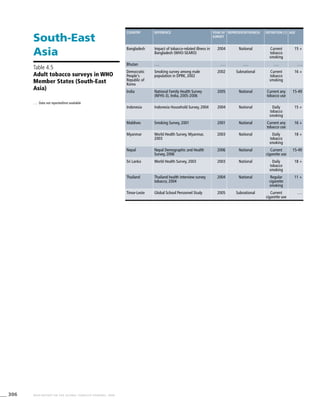
![307WHO REPORT ON THE GLOBAL TOBACCO EPIDEMIC, 2008
Male
prevalence
[%]
Female
prevalence
[%]
Both sexes
prevalence
[%]
Definition (2) Age Male
prevalence
[%]
Female
prevalence
[%]
Both sexes
prevalence
[%]
41.0 1.8 20.9 Current any
tobacco use
15 + 48.6 25.4 36.8
. . . . . . . . . . . . . . . . . . . . . . . .
59.9 . . . . . . . . . . . . . . . . . . . . .
57.0 3.1 . . . Current
cigarette or
bidi use
15-49 32.7 1.4 . . .
52.4 3.3 28.4 Current
tobacco
smoking
15 + 63.2 4.5 34.5
37.4 15.6 . . . Current
cigarette use
16 + 27.3 2.2 12.6
35.6 10.4 22.7 Current
tobacco
smoking
18 + 48.9 13.7 30.9
30.2 15.2 . . . . . . . . . . . . . . . . . .
24.5 1.6 13.6 Current
tobacco
smoking
18 + 39.0 2.6 21.6
34.1 1.9 17.9 Current
cigarette use
11 + 40.2 2.4 21.1
30.5 1.3 23.4 Current any
tobacco use
NA 37.0 6.1 29.9](https://image.slidesharecdn.com/ol25kkvlqguoxfywagtq-signature-60b0131a05a17be1631d7bde4d7608a3b2ae419a0a24dd90535582b58a53e895-poli-151021161413-lva1-app6891/85/MPOWER-Package-313-320.jpg)
![308 WHO REPORT ON THE GLOBAL TOBACCO EPIDEMIC, 2008
Western Pacific
Table 4.6
Adult tobacco surveys in
WHO Member States
(Western Pacific)
. . . Data not reported/not available
Country Reference Year of
survey
Representativeness Definition (1)
Australia National Health Survey: Summary
of results, 2005
2005 National Current
tobacco
smoking
Brunei Darussalam . . . . . . . . . . . .
Cambodia Report on the analysis of smoking
behavior survey in Cambodia, 2004
2004 National Daily tobacco
smoking
China Smoking and passive smoking in
Chinese, 2002
2002 National Current
cigarette use
Cook Islands National survey, 2004 2004 National Daily tobacco
smoking
Fiji Fiji NCD STEPS Report (Draft) V4.9,
2002
2002 National Daily tobacco
smoking
Japan Heisei 16-nen kokumin kenkou
eiyou tyosa kekka no gaiyou
[Summary of results of the
National Health and Nutrition
Survey, 2004]
2004 National Current
cigarette use
Kiribati Country Profiles on Tobacco or
Health, 2000
2000 National Current
tobacco
smoking
Lao People's Democratic
Republic
World Health Survey, Lao People's
Democratic Republic, 2003
2003 National Daily tobacco
smoking
Malaysia Malaysia NCD Surveillance 2006:
NCD Risk Factors in Malaysia
2006 National Daily tobacco
smoking
Marshall Islands . . . . . . . . . . . .
Micronesia (Federated
States of)
. . . . . . . . . . . .
Mongolia Mongolian STEPS survey on the
prevalence of noncommunicable
disease risk factors, 2006
2006 National Daily tobacco
smoking
Nauru Nauru NCD risk factors STEPS
report, 2004
2004 National Daily tobacco
smoking
New Zealand Prevalence of Smoking in New
Zealand by District Health Board
(Census 2006)
2006 National Daily
cigarette use
Niue . . . . . . . . . . . .
Palau Palau Health Survey 1991 National Current
tobacco
smoking
Papua New Guinea . . . . . . . . . . . .
Philippines World Health Survey, 2003 2003 National Daily tobacco
smoking
Republic of Korea Korea National Health and
Nutrition Examination Survey
(KNHANES III) 2005 - Health
Behaviors of Adults, 2006
2005 National Current
cigarette use
Samoa Cardiovascular disease (CVD) risk
factors in Samoa and American
Samoa (1990-1995), 2001
1995 Subnational Current
cigarette use
Singapore National Health Survey; 2005 2004 National Daily
cigarette use
Solomon Islands . . . . . . . . . . . .
Tonga The prevalence of diabetes in the
Kingdom of Tonga
2000 National Current
cigarette use
Tuvalu . . . . . . . . . . . .
Vanuatu 1998 Vanuatu non-comunicable
disease survey report
1998 National Daily
cigarette use
Viet Nam World Health Survey, 2003 2003 National Daily tobacco
smoking](https://image.slidesharecdn.com/ol25kkvlqguoxfywagtq-signature-60b0131a05a17be1631d7bde4d7608a3b2ae419a0a24dd90535582b58a53e895-poli-151021161413-lva1-app6891/85/MPOWER-Package-314-320.jpg)
![309WHO REPORT ON THE GLOBAL TOBACCO EPIDEMIC, 2008
Age Male
prevalence
[%]
Female
prevalence
[%]
Both
sexes [%]
Definition (2) Age Male
prevalence
[%]
Female
prevalence
[%]
Both sexes
[%]
18 + 26.2 20.4 23.3 . . . . . . . . . . . . . . .
. . . . . . . . . . . . . . . . . . . . . . . . . . .
18-64 54.0 6.0 28.0 . . . . . . . . . . . . . . .
15-69 57.4 2.6 31.4 Cigarette
ever smoking
15-69 66.0 3.1 35.8
25-64 38.0 29 33.0 Current
tobacco
smoking
25-64 47.0 41.0 44.0
15-85 26.0 3.9 . . . . . . . . . . . . . . . . . .
20 + 43.3 12.0 . . . . . . . . . . . . . . . . . .
16 + 56.5 32.3 42.0 . . . . . . . . . . . . . . .
18 + 59.0 13.2 35.7 Current
tobacco
smoking
18 + 65.8 15.4 40.2
25-64 39.0 2.1 32.3 Current
tobacco
smoking
25-64 46.5 3.0 25.5
. . . . . . . . . . . . . . . . . . . . . . . . . . .
. . . . . . . . . . . . . . . . . . . . . . . . . . .
15-64 43.1 4.1 24.2 Current
tobacco
smoking
15-64 48.4 5.5 27.6
15-64 45.5 50.8 48.2 Current
tobacco
smoking
15-64 49.7 56.0 52.9
15 + 21.9 19.5 20.7 . . . . . . . . . . . . . . .
. . . . . . . . . . . . . . . . . . . . . . . . . . .
35-64 No data for total age
group
. . . . . . . . . . . . . . . . . .
. . . . . . . . . . . . . . . . . . . . . . . . . . .
18 + 40.3 7.1 23.6 Current
tobacco
smoking
18 + 57.5 12.3 34.7
20 + 52.8 5.8 29.1 . . . . . . . . . . . . . . .
29 + 60.0 24.0 . . . . . . . . . . . . . . . . . .
18-69 21.8 3.5 12.6 Current
cigarette use
18-69 24.9 4.1 14.5
. . . . . . . . . . . . . . . . . . . . . . . . . . .
15 + 52.9 10.5 . . . . . . . . . . . . . . . . . .
. . . . . . . . . . . . . . . . . . . . . . . . . . .
20 + 37.4 3.2 . . . Current
tobacco
smoking
20 + 49.1 5.0 27.2
18 + 34.8 1.8 17.5 Current
tobacco
smoking
18 + 49.4 2.3 24.8](https://image.slidesharecdn.com/ol25kkvlqguoxfywagtq-signature-60b0131a05a17be1631d7bde4d7608a3b2ae419a0a24dd90535582b58a53e895-poli-151021161413-lva1-app6891/85/MPOWER-Package-315-320.jpg)

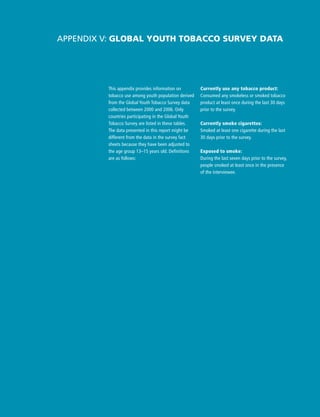
![312 WHO REPORT ON THE GLOBAL TOBACCO EPIDEMIC, 2008
Country National survey or
jurisdiction where
survey conducted
Survey
year
Proportion currently using any tobacco
product [%]a
Males (95% CI)d
Females (95% CI)d
Benin Atlantique Littoral 2003 14.6 (11.4 - 18.5) 5.8 (3.9 - 8.7)
Benin Borgou Alibori 2003 29.3 (24.5 - 34.5) 11.8 (8.8 - 15.6)
Botswana National 2001 12.3 (9.4 - 16.1) 10.5 (8.1 - 13.4)
Burkina Faso Ouagadougou 2006 19.9 (16.1 - 24.3) 6.7 (5.0 - 9.0)
Eritrea National 2006 7.8 (6.4 - 9.6) 4.6 (3.4 - 6.1)
Ethiopia Addis Abeba 2003 9.9 (6.3 - 15.4) 4.9 (3.1 - 7.7)
Ghana National 2006 11.6 (8.5 - 15.5) 10.9 (8.2 - 14.4)
Côte d'Ivoire Abidjan 2003 21.7 (19.1 - 24.5) 10.3 (8.0 - 13.3)
Kenya National 2001 14.2 (10.5 - 18.8) 11.4 (8.0 - 15.9)
Lesotho National 2002 22.4 (18.3 - 27.0) 17.7 (15.1 - 20.7)
Malawi National 2005 19.1 (15.9 - 22.7) 17.9 (11.6 - 26.5)
Mali Bamako 2001 42.6 (36.3 - 49.2) 7.4 (4.8 - 11.3)
Mauritania National 2006 31.5 (26.8 - 36.7) 29.5 (23.8 - 36.0)
Mauritius National 2003 . . . . . . . . . . . .
Mozambique Maputo 2002 9.1 (6.8 - 12.0) 7.2 (5.4 - 9.6)
Namibia National 2004 28.6 (25.6 - 31.8) 22.9 (20.2 - 26.0)
Niger National 2006 15.2 (10.9 - 20.9) 8.0 (5.1 - 12.5)
Nigeria Cross River State 2000 22.6 (18.0 - 27.9) 11.2 (7.8 - 15.9)
Senegal National 2002 24.3 (20.3 - 28.8) 6.9 (4.9 - 9.6)
Seychelles National 2002 33.4 (27.5 - 39.8) 24.9 (20.2 - 30.4)
South Africa National 2002 29.0 (24.9 - 33.5) 20.0 (17.8 - 22.4)
Swaziland National 2005 14.7 (13.0 - 16.5) 9.0 (7.8 - 10.3)
Togo National 2002 19.6 (15.7 - 24.3) 9.7 (7.2 - 12.9)
Uganda Kampala 2002 11.9 (9.1 - 15.2) 11.3 (8.0 - 15.7)
United Republic of
Tanzania
Arusha 2003 8.7 (5.8 - 12.8) 4.7 (3.7 - 5.9)
Zambia Lusaka 2002 22.8 (17.5 - 29.1) 22.4 (16.5 - 29.8)
Zimbabwe Harare 2003 12.7 (8.9 - 17.8) 7.3 (5.4 - 9.9)
Africa
Table 5.1
Global Youth Tobacco Survey
(participating countries only)
(Africa)
a
Definition: Consumed any smokeless or smoked tobacco
product at least once during the last 30 days prior to the
survey.
b
Definition: Smoked at least one cigarette during the last 30
days prior to the survey.
c
Definition: During the last seven days prior to the survey,
people smoked at least once in the presence of the
interviewee.
d
CI: Confidence Interval
. . . Data not reported/not available](https://image.slidesharecdn.com/ol25kkvlqguoxfywagtq-signature-60b0131a05a17be1631d7bde4d7608a3b2ae419a0a24dd90535582b58a53e895-poli-151021161413-lva1-app6891/85/MPOWER-Package-318-320.jpg)
![313WHO REPORT ON THE GLOBAL TOBACCO EPIDEMIC, 2008
Proportion currently smoking cigarettes [%]b
Proportion exposed to
smoke in homes
[%]c
(95% CI)d
Proportion exposed to
smoke outside homes
[%]c
(95% CI)d
Males (95% CI)d
Females (95% CI)d
11.2 (7.4 - 16.5) 1.8 (0.9 - 3.6) 21.5 (18.3 - 25.0) 38.0 (34.4 - 41.8)
19.2 (14.2 - 25.5) 2.6 (1.3 - 5.5) 30.7 (26.9 - 34.7) 41.4 (36.9 - 46.0)
3.9 (2.5 - 5.9) 2.1 (1.1 - 4.1) 33.0 (29.8 - 36.3) 52.5 (48.1 - 56.8)
14.1 (10.4 - 18.7) 2.4 (1.3 - 4.3) 32.9 (28.9 - 37.1) 48.8 (44.1 - 53.5)
2.0 (1.5 - 2.7) 0.6 (0.2 - 1.4) 18.4 (16.6 - 20.3) 37.3 (33.7 - 41.0)
2.5 (1.1 - 5.3) 0.7 (0.2 - 2.4) 14.9 (11.3 - 19.3) 41.2 (37.4 - 45.0)
2.8 (1.7 - 4.7) 2.3 (1.4 - 3.5) 15.9 (13.7 - 18.5) 31.6 (29.7 - 33.5)
19.3 (16.1 - 23.0) 7.1 (5.1 - 9.9) 44.2 (41.0 - 47.5) 69.7 (65.8 - 73.3)
8.7 (5.9 - 12.6) 4.7 (2.4 - 8.7) 27.2 (23.1 - 31.7) 43.2 (39.3 - 47.1)
16.6 (12.4 - 21.9) 4.8 (3.4 - 6.9) 39.5 (36.7 - 42.3) 60.4 (57.7 - 63.1)
3.8 (2.2 - 6.4) 2.2 (1.3 - 3.6) 10.4 (8.4 - 12.8) 24.2 (20.2 - 28.7)
41.8 (34.0 - 50.0) 4.6 (2.7 - 7.7) 59.9 (54.8 - 64.9) 75.9 (69.0 - 81.7)
20.3 (17.5 - 23.4) 18.3 (13.4 - 24.5) 42.7 (38.2 - 47.3) 53.6 (49.6 - 57.5)
19.9 (15.0 - 25.9) 7.9 (4.7 - 12.9) 42.0 (37.3 - 46.8) 68.1 (62.8 - 72.9)
5.0 (2.9 - 8.5) 1.4 (0.6 - 3.3) 24.8 (19.4 - 31.2) 39.4 (34.5 - 44.5)
21.9 (18.9 - 25.2) 16.1 (13.3 - 19.3) 40.3 (36.9 - 43.7) 58.5 (55.8 - 61.1)
11.7 (7.6 - 17.4) 1.1 (0.3 - 3.9) 30.3 (24.6 - 36.8) 52.3 (45.5 - 59.0)
7.7 (4.4 - 13.3) 3.3 (1.9 - 5.8) 34.3 (29.2 - 39.9) 49.6 (29.2 -39.9)
20.2 (16.4 - 24.7) 4.4 (3.0 - 6.6) 45.8 (41.8 - 49.8) 62.6 (58.6 - 66.5)
29.9 (23.3 - 37.4) 23.9 (18.7 - 30.0) 43.3 (40.0 - 46.7) 60.9 (56.9 - 64.8)
21.0 (16.7 - 26.1) 10.6 (8.3 - 13.4) 34.9 (31.3 - 38.6) 43.4 (40.4 - 46.6)
8.9 (7.8 - 10.2) 3.2 (2.5 - 4.2) 23.0 (21.4 - 24.7) 50.9 (48.3 - 53.4)
14.9 (11.1 - 19.6) 4.0 (2.6 - 6.3) 28.2 (24.3 - 32.5) 59.8 (53.2 - 66.0)
3.7 (1.6 - 8.3) 2.6 (1.2 - 5.4) 16.6 (14.3 - 19.2) 46.2 (38.6 - 54.0)
4.0 (2.0 - 7.6) 0.4 (0.2 - 0.8) 18.2 (14.8 - 22.1) 23.3 (18.1 - 29.5)
9.4 (6.3 - 13.9) 8.7 (4.6 - 15.9) 29.4 (25.2 - 33.9) 40.9 (37.3 - 44.6)
6.1 (4.0 - 9.4) 3.2 (1.8 - 5.7) 27.4 (24.6 - 30.4) 56.4 (53.6 - 59.2)](https://image.slidesharecdn.com/ol25kkvlqguoxfywagtq-signature-60b0131a05a17be1631d7bde4d7608a3b2ae419a0a24dd90535582b58a53e895-poli-151021161413-lva1-app6891/85/MPOWER-Package-319-320.jpg)
![314 WHO REPORT ON THE GLOBAL TOBACCO EPIDEMIC, 2008
Country National survey
or jurisdiction
where survey
conducted
Survey
year
Proportion currently using any tobacco
product [%]a
Males (95% CI)d
Females (95% CI)d
Antigua and Barbuda National 2004 15.1 (12.1 - 18.8) 12.5 (9.2 - 16.8)
Argentina Capital Federal 2003 22.4 (17.8 - 27.8) 27.5 (22.9 - 32.6)
Bahamas National 2004 12.9 (10.3 - 16.1) 10.2 (7.6 - 13.5)
Barbados National 2002 16.9 (13.5 - 20.8) 12.9 (11.0 - 15.0)
Belize National 2002 22.6 (18.6 - 27.3) 13.5 (10.3 - 17.3)
Bolivia La Paz 2003 24.7 (20.6 - 29.3) 16.6 (14.3 - 19.1)
Brazil Rio de Janeiro 2005 17.2 (14.0 - 21.0) 15.7 (12.3 - 19.8)
Chile Santiago 2003 29.9 (23.9 - 36.6) 40.2 (33.3 - 47.5)
Colombia Bogota 2001 31.6 (28.6 - 34.8) 34.0 (30.6 - 37.5)
Costa Rica National 2002 18.5 (16.2 - 20.9) 18.6 (15.7 - 21.8)
Cuba Havana 2004 13.6 (10.1 - 18.2) 15.7 (11.8 - 20.6)
Dominica National 2004 19.3 (14.8 - 24.8) 13.5 (10.4 - 17.3)
Dominican Republic National 2004 18.4 (15.9 - 21.1) 11.9 (9.8 - 14.3)
Ecuador Quito 2001 31.6 (27.1 - 36.5) 17.1 (13.8 - 20.9)
El Salvador National 2003 24.4 (19.2 - 30.4) 15.4 (11.2 - 20.7)
Grenada National 2004 17.6 (14.0 - 21.9) 15.7 (12.9 - 19.1)
Guatemala Guatemala City 2002 19.6 (14.9 - 25.3) 12.3 (9.9 - 15.2)
Guyana National 2004 17.6 (12.9 - 23.5) 12.2 (8.1 - 18.0)
Haiti National 2005 20.3 (17.9 - 23.0) 19.2 (15.8 - 23.0)
Honduras Tegucigalpa 2003 22.8 (19.3 - 26.7) 18.2 (13.8 - 23.7)
Jamaica National 2000 24.4 (18.6 - 31.3) 14.5 (12.0 - 17.4)
Mexico Mexico City 2003 29.4 (25.0 - 34.1) 24.8 (18.8 - 32.1)
Nicaragua Centro 2003 26.1 (22.4 - 30.2) 13.3 (9.6 - 18.1)
Nicaragua Centro Managua 2003 30.4 (26.3 - 34.9) 20.5 (15.6 - 26.4)
Panama National 2002 20.5 (16.3 - 25.4) 15.6 (12.2 - 19.7)
Paraguay Asuncion 2003 26.1 (20.7 - 32.3) 25.2 (21.7 - 28.9)
Peru Lima 2003 21.6 (18.0 - 25.7) 24.4 (18.0 - 32.2)
Saint Kitts and Nevis National 2002 18.2 (13.5 - 24.2) 13.6 (10.9 - 17.0)
Saint Lucia National 2000 15.8 (12.3 - 20.1) 11.0 (8.3 - 14.3)
Saint Vincent and the
Grenadines
National 2000 25.3 (21.2 - 30.0) 18.5 (14.9 - 22.6)
Suriname National 2004 12.6 (9.3 - 16.9) 8.6 (6.1 - 11.8)
Trinidad and Tobago National 2000 18.0 (15.2 - 21.1) 10.3 (8.7 - 12.1)
United States of
America
National 2002 20.7 (18.7 - 22.8) 16.2 (14.8 - 17.6)
Uruguay Montevideo 2000 27.2 (21.9 - 33.3) 31.4 (26.2 - 37.1)
Venezuela Barinas 2003 18.7 (14.2 - 24.2) 13.0 (9.0 - 18.5)
The Americas
Table 5.2
Global Youth Tobacco Survey
(participating countries only)
(The Americas)
a
Definition: Consumed any smokeless or smoked tobacco
product at least once during the last 30 days prior to the
survey.
b
Definition: Smoked at least one cigarette during the last 30
days prior to the survey.
c
Definition: During the last seven days prior to the survey,
people smoked at least once in the presence of the
interviewee.
d
CI: Confidence Interval
. . . Data not reported/not available](https://image.slidesharecdn.com/ol25kkvlqguoxfywagtq-signature-60b0131a05a17be1631d7bde4d7608a3b2ae419a0a24dd90535582b58a53e895-poli-151021161413-lva1-app6891/85/MPOWER-Package-320-320.jpg)
![315WHO REPORT ON THE GLOBAL TOBACCO EPIDEMIC, 2008
Proportion currently smoking cigarettes [%]b
Proportion exposed to
smoke in homes
[%]c
(95% CI)d
Proportion exposed to
smoke outside homes
[%]c
(95% CI)d
Males (95% CI)d
Females (95% CI)d
2.7 (1.7 - 4.3) 4.4 (2.3 - 8.2) 18.0 (15.3 - 21.0) 40.3 (36.1 - 44.7)
17.2 (13.3 - 22.0) 26.8 (22.1 - 32.1) 61.1 (57.5 - 64.6) 82.7 (79.9 - 85.2)
6.2 (3.8 - 10.1) 3.7 (2.1 - 6.6) 21.6 (17.5 - 26.4) 51.1 (45.7 - 56.4)
7.6 (5.5 - 10.4) 6.4 (4.3 - 9.4) 22.4 (19.3 - 25.9) 51.3 (48.2 - 54.4)
18.9 (15.0 - 23.5) 10.4 (7.1 - 15.0) 32.6 (28.0 - 37.5) 60.3 (56.3 - 64.2)
20.3 (16.5 - 24.7) 12.0 (9.3 - 15.3) 34.3 (31.1 - 37.7) 52.9 (49.5 - 56.3)
9.1 (6.5 - 12.5) 12.9 (9.6 - 17.1) 35.0 (31.2 - 39.0) 50.0 (47.2 - 52.8)
27.6 (21.7 - 34.5) 39.2 (32.1 - 46.9) 60.6 (57.0 - 64.2) 69.8 (67.1 - 72.3)
31.0 (27.5 - 34.8) 33.4 (29.5 - 37.5) 6.7 (5.6 - 7.9) 60.6 (58.0 - 63.1)
16.8 (14.4 - 19.6) 15.7 (12.9 - 19.0) 29.4 (27.2 - 31.7) 51.0 (48.4 - 53.5)
8.8 (6.5 - 11.9) 11.2 (8.3 - 15.1) 62.4 (58.1 - 66.6) 65.0 (60.2 - 69.4)
11.8 (8.1 - 16.9) 9.6 (7.0 - 13.0) 26.3 (23.0 - 29.8) 60.2 (56.8 - 63.6)
7.3 (5.9 - 9.0) 5.8 (4.0 - 8.2) 33.1 (29.9 - 36.4) 41.9 (38.7 - 45.1)
27.2 (23.0 - 31.8) 12.6 (9.0 - 17.4) 36.1 (31.9 - 40.6) 56.9 (52.9 - 60.7)
18.4 (13.4 - 24.8) 10.9 (6.8 - 17.1) 14.8 (10.8 - 20.0) 39.5 (27.6 - 52.7)
10.9 (7.4 - 15.8) 9.5 (7.4 - 12.2) 27.3 (24.7 - 30.1) 61.8 (58.0 - 65.5)
17.3 (12.8 - 22.8) 11.2 (8.5 - 14.5) 36.3 (31.8 - 41.1) 49.4 (45.7 - 53.1)
11.0 (7.4 - 16.0) 5.4 (3.1 - 9.3) 33.4 (29.2 - 37.9) 61.1 (56.4 - 65.6)
14.1 (12.1 - 16.4) 13.8 (10.8 - 17.4) 26.5 (23.3 - 29.9) 38.6 (33.2 - 44.2)
14.4 (10.9 - 18.8) 14.1 (9.8 - 19.9) 29.6 (26.2 - 33.3) 42.2 (36.5 - 48.2)
20.3 (15.0 - 26.9) 11.8 (9.5 - 14.5) 68.1 (63.6 - 72.3) 30.7 (27.4 - 34.1)
24.4 (19.8 - 29.7) 23.2 (16.5 - 31.5) 51.6 (48.7 - 54.4) 60.4 (56.9 - 63.8)
21.1 (16.3 - 26.9) 9.4 (5.6 - 15.2) 38.1 (33.9 - 42.5) 48.3 (43.6 - 53.0)
25.6 (21.4 - 30.3) 17.4 (12.6 - 23.6) 43.7 (38.0 - 49.5) 54.1 (51.5 - 56.7)
14.7 (10.4 - 20.2) 11.1 (7.8 - 15.6) 32.0 (29.1 - 35.0) 51.8 (49.0 - 54.6)
19.2 (14.3 - 25.3) 18.5 (15.0 - 22.7) 42.4 (40.0 - 44.8) 66.3 (63.7 - 68.9)
17.0 (13.1 - 21.7) 20.8 (15.3 - 27.7) 25.1 (22.4 - 27.9) 41.7 (36.2 - 47.5)
7.0 (4.2 - 11.3) 1.9 (0.9 - 4.1) 16.5 (13.4 - 20.1) 48.8 (44.8 - 52.9)
11.5 (8.5 - 15.5) 7.9 (5.5 - 11.3) 76.7 (73.0 - 80.0) 26.9 (24.4 - 29.5)
17.2 (13.6 - 21.5) 10.7 (8.0 - 14.2) 68.1 (64.4 - 71.5) 32.5 (29.5 - 35.6)
9.3 (6.3 - 13.5) 4.7 (2.7 - 8.2) 49.7 (45.5 - 53.9) 64.2 (59.0 - 69.0)
16.0 (13.2 - 19.2) 7.6 (6.1 - 9.5) 68.9 (65.9 - 71.8) 37.2 (34.6 - 39.8)
13.9 (12.6 - 15.4) 13.6 (12.3 - 15.1) 57.2 (55.2 - 59.1) . . . . . .
22.2 (17.6 - 27.5) 29.6 (24.4 - 35.3) 65.0 (61.6 - 68.4) 64.6 (61.6 - 67.5)
7.5 (5.3 - 10.5) 7.2 (4.5 - 11.3) 34.4 (31.3 - 37.7) 41.5 (38.4 - 44.7)](https://image.slidesharecdn.com/ol25kkvlqguoxfywagtq-signature-60b0131a05a17be1631d7bde4d7608a3b2ae419a0a24dd90535582b58a53e895-poli-151021161413-lva1-app6891/85/MPOWER-Package-321-320.jpg)
![316 WHO REPORT ON THE GLOBAL TOBACCO EPIDEMIC, 2008
Country National survey
or jurisdiction
where survey
conducted
Survey
year
Proportion currently using any tobacco
product [%]a
Males (95% CI)d
Females (95% CI)d
Afghanistan Kabul 2004 13.1 (9.2 - 18.3) 3.2 (1.6 - 6.3)
Bahrain National 2002 28.0 (23.5 - 32.9) 11.7 (8.6 - 15.8)
Djibouti National 2003 17.9 (13.4 - 23.5) 10.7 (7.1 - 15.9)
Egypt National 2005 16.0 (13.0 - 19.6) 7.6 (6.1 - 9.3)
Iran (Islamic Republic of) National 2003 17.6 (14.4 - 21.5) 8.9 (7.2 - 11.1)
Iraq Kurdistan 2006 29.0 (22.8 - 36.1) 10.3 (7.4 - 14.1)
Jordan National 2003 31.6 (28.0 - 35.4) 24.0 (21.4 - 26.8)
Kuwait National 2005 28.0 (24.3 - 32.1) 14.3 (12.3 - 16.7)
Lebanon National 2005 65.8 (58.2 - 72.7) 54.1 (50.7 - 57.4)
Libyan Arab Jamahiriya National 2003 16.8 (12.0 - 23.1) 8.1 (5.4 - 11.9)
Morocco National 2006 12.5 (9.6 - 16.1) 8.2 (6.5 - 10.3)
Oman National 2002 24.1 (15.9 - 34.9) 7.6 (5.8 - 9.9)
Pakistan Islamabad 2003 12.4 (9.2 - 16.5) 7.5 (5.4 - 10.2)
Qatar National 2004 21.1 (18.5 - 23.9) 12.7 (10.7 - 15.1)
Saudi Arabia Riyadh 2001 13.2 (11.3 - 15.3) . . . . . .
Somalia Somaliland 2004 18.6 (10.2 - 31.4) 22.4 (13.4 - 35.1)
Sudan National 2005 18.0 (13.4 - 23.7) 10.1 (8.0 - 12.8)
Syrian Arab Republic National 2002 22.9 (19.4 - 26.8) 15.0 (11.3 - 19.5)
Tunisia National 2001 24.9 (21.5 - 28.6) 6.0 (4.7 - 7.7)
United Arab Emirates National 2005 25.2 (23.2 - 27.4) 13.2 (11.6 - 15.0)
West Bank and Gaza Strip>
West Bank 2005 37.8 (32.9 - 42.9) 17.4 (14.1 - 21.4)
Yemen National 2003 19.7 (18.2 - 21.2) 13.7 (11.5 - 16.1)
Eastern
Mediterranean
Table 5.3
Global Youth Tobacco Survey
(participating countries only)
(Eastern Mediterranean)
a
Definition: Consumed any smokeless or smoked tobacco
product at least once during the last 30 days prior to the
survey.
b
Definition: Smoked at least one cigarette during the last 30
days prior to the survey.
c
Definition: During the last seven days prior to the survey,
people smoked at least once in the presence of the
interviewee.
d
CI: Confidence Interval
. . . Data not reported/not available
>
Refers to a territory.](https://image.slidesharecdn.com/ol25kkvlqguoxfywagtq-signature-60b0131a05a17be1631d7bde4d7608a3b2ae419a0a24dd90535582b58a53e895-poli-151021161413-lva1-app6891/85/MPOWER-Package-322-320.jpg)
![317WHO REPORT ON THE GLOBAL TOBACCO EPIDEMIC, 2008
Proportion currently smoking cigarettes [%]b
Proportion exposed to
smoke in homes
[%]c
(95% CI)d
Proportion exposed to
smoke outside homes
[%]c
(95% CI)d
Males (95% CI)d
Females (95% CI)d
7.6 (4.5 - 12.7) 0.0 . . . 38.8 (32.9 - 45.1) 45.0 (32.5 - 58.1)
17.5 (14.5 - 20.8) 3.9 (2.2 - 6.7) 38.7 (35.3 - 42.1) 45.3 (41.4 - 49.2)
8.6 (5.3 - 13.6) 2.6 (1.3 - 5.4) 39.5 (34.3 - 45.0) 43.2 (36.7 - 49.8)
5.9 (4.4 - 7.9) 1.4 (0.9 - 2.3) 38.7 (35.7 - 41.7) 43.7 (39.5 - 47.9)
3.2 (2.3 - 4.5) 1.0 (0.6 - 1.6) 41.7 (39.3 - 44.2) 50.6 (47.9 - 53.3)
21.0 (13.6 - 31.0) 2.1 (1.1 - 3.9) 46.5 (41.1 - 51.9) 30.4 (21.7 - 40.9)
21.4 (17.9 - 25.4) 12.6 (10.1 - 15.7) 63.0 (59.1 - 66.6) 63.8 (60.8 - 66.7)
17.7 (14.2 - 21.7) 4.5 (3.0 - 6.9) 44.4 (41.7 - 47.2) 56.2 (53.0 - 59.4)
11.8 (8.5 - 16.3) 5.6 (4.2 - 7.5) 78.4 (75.4 - 81.1) 74.4 (72.5 - 76.1)
7.3 (4.5 - 11.6) 0.8 (0.3 - 2.4) 40.4 (36.2 - 44.8) 38.6 (35.2 - 42.2)
4.3 (2.9 - 6.4) 2.1 (1.1 - 3.9) 27.1 (24.6 - 29.7) 41.1 (37.7 - 44.5)
14.2 (6.5 - 28.1) 1.8 (1.0 - 3.4) 21.0 (16.0 - 27.0) 30.3 (24.8 - 36.5)
2.3 (0.9 - 5.4) 0.6 (0.2 - 1.9) 26.6 (22.7 - 30.8) 33.9 (28.9 - 39.2)
10.7 (8.8 - 13.0) 2.8 (1.7 - 4.8) 30.2 (27.9 - 32.6) 46.8 (43.3 - 50.3)
4.7 (3.6 - 6.2) . . . . . . 25.9 (22.8 - 29.4) 33.3 (29.4 - 37.5)
8.6 (3.6 - 19.3) 14.8 (7.4 - 27.5) 56.9 (43.3 - 69.5) 63.9 (53.6 - 73.1)
10.2 (6.6 - 15.5) 2.1 (1.4 - 3.2) 27.5 (24.4 - 31.0) 41.4 (35.4 - 47.6)
8.1 (5.7 - 11.4) 3.1 (1.8 - 5.4) 54.5 (47.7 - 61.2) 49.7 (43.9 - 55.5)
19.0 (15.7 - 22.8) 3.6 (2.6 - 4.9) 62.4 (59.5 - 65.1) 65.3 (62.8 - 67.8)
12.1 (10.3 - 14.1) 3.6 (2.9 - 4.4) 25.3 (23.9 - 26.8) 31.6 (29.5 - 33.8)
27.6 (21.3 - 35.1) 8.7 (5.8 - 12.8) 62.4 (57.4 - 67.1) 59.4 (55.7 - 63.0)
6.5 (5.5 - 7.6) 3.0 (1.9 - 4.5) 44.0 (41.8 - 46.2) 47.6 (45.2 - 50.1)](https://image.slidesharecdn.com/ol25kkvlqguoxfywagtq-signature-60b0131a05a17be1631d7bde4d7608a3b2ae419a0a24dd90535582b58a53e895-poli-151021161413-lva1-app6891/85/MPOWER-Package-323-320.jpg)
![318 WHO REPORT ON THE GLOBAL TOBACCO EPIDEMIC, 2008
Country National survey
or jurisdiction
where survey
conducted
Survey
year
Proportion currently using any tobacco
product [%]a
Males (95% CI)d
Females (95% CI)d
Albania National 2004 17.3 (13.6 - 21.8) 9.4 (7.8 - 11.3)
Armenia National 2004 13.0 (9.5 - 17.5) 2.7 (1.5 - 4.7)
Belarus National 2004 31.6 (28.3 - 35.0) 22.2 (19.6 - 25.0)
Bosnia and Herze-
govina
National 2003 15.1 (12.8 - 17.8) 9.9 (8.1 - 12.2)
Bulgaria National 2002 28.6 (24.5 - 33.0) 39.2 (34.3 - 44.4)
Croatia National 2003 20.7 (17.2 - 24.7) 16.8 (13.9 - 20.1)
Cyprus National 2006 13.2 (11.6 - 15.0) 8.4 (7.2 - 9.8)
Czech Republic National 2002 35.5 (31.5 - 39.7) 33.6 (29.8 - 37.5)
Estonia National 2003 31.2 (28.2 - 34.5) 27.3 (24.5 - 30.3)
Georgia National 2003 36.4 (31.9 - 41.2) 13.6 (10.9 - 16.9)
Greece National 2005 17.1 (15.0 - 19.4) 14.4 (12.1 - 16.9)
Hungary National 2003 28.0 (23.8 - 32.7) 26.9 (23.2 - 30.9)
Kazakhstan National 2004 15.2 (13.0 - 17.7) 8.1 (6.4 - 10.1)
Kyrgyzstan National 2004 10.8 (7.7 - 15.1) 4.8 (3.5 - 6.5)
Latvia National 2002 37.1 (33.7 - 40.7) 30.9 (26.8 - 35.3)
Lithuania National 2005 36.8 (32.6 - 41.2) 28.1 (24.0 - 32.7)
Montenegro National 2003 7.0 (5.1 - 9.6) 6.2 (4.1 - 9.2)
Poland National 2003 21.4 (16.6 - 27.0) 17.3 (14.5 - 20.6)
Republic of Moldova National 2004 25.3 (20.8 - 30.3) 7.9 (6.2 - 10.0)
Romania National 2004 22.2 (17.0 - 28.4) 14.8 (12.0 - 18.2)
Russian Federation National 2004 30.1 (26.6 - 33.8) 24.4 (21.5 - 27.6)
Serbia National 2003 12.8 (10.8 - 15.2) 13.7 (11.1 - 16.9)
Slovakia National 2003 29.1 (25.9 - 32.5) 25.0 (22.7 - 27.4)
Slovenia National 2003 22.9 (20.0 - 26.2) 23.5 (19.6 - 27.9)
Tajikistan National 2004 6.8 (3.9 - 11.6) 2.8 (1.4 - 5.7)
The Former Yugoslav
Republic of Macedonia
National 2003 9.6 (6.5 - 13.9) 8.2 (5.7 - 11.6)
Turkey National 2003 11.1 (9.8 - 12.5) 4.4 (3.7 - 5.3)
Ukraine National 2005 29.8 (25.0 - 35.1) 22.2 (18.3 - 26.6)
Europe
Table 5.4
Global Youth Tobacco Survey
(participating countries only)
(Europe)
a
Definition: Consumed any smokeless or smoked tobacco
product at least once during the last 30 days prior to the
survey.
b
Definition: Smoked at least one cigarette during the last 30
days prior to the survey.
c
Definition: During the last seven days prior to the survey,
people smoked at least once in the presence of the
interviewee.
d
CI: Confidence Interval
. . . Data not reported/not available](https://image.slidesharecdn.com/ol25kkvlqguoxfywagtq-signature-60b0131a05a17be1631d7bde4d7608a3b2ae419a0a24dd90535582b58a53e895-poli-151021161413-lva1-app6891/85/MPOWER-Package-324-320.jpg)
![319WHO REPORT ON THE GLOBAL TOBACCO EPIDEMIC, 2008
Proportion currently smoking cigarettes [%]b
Proportion exposed to
smoke in homes
[%]c
(95% CI)d
Proportion exposed to
smoke outside homes
[%]c
(95% CI)d
Males (95% CI)d
Females (95% CI)d
11.9 (9.0 - 15.5) 5.8 (4.5 - 7.5) 84.8 (81.8 - 87.3) 80.6 (78.0 - 83.0)
10.3 (7.7 - 13.5) 0.9 (0.4 - 2.2) 89.8 (87.8 - 91.6) 85.1 (81.5 - 88.1)
31.2 (27.7 - 35.0) 21.7 (19.0 - 24.8) 75.3 (73.2 - 77.3) 90.1 (88.7 - 91.3)
13.6 (11.0 - 16.8) 8.9 (7.0 - 11.2) 96.5 (95.8 - 97.2) 91.4 (90.5 - 92.3)
26.0 (21.6 - 30.8) 39.4 (34.2 - 44.9) 67.7 (64.9 - 70.4) 75.7 (73.0 - 78.3)
19.9 (16.1 - 24.3) 16.4 (13.4 - 19.9) 94.9 (93.5 - 96.0) 91.1 (89.9 - 92.1)
12.3 (10.7 - 14.1) 8.2 (6.9 - 9.6) 86.8 (85.6 - 87.8) 87.8 (86.9 - 88.7)
34.0 (29.7 - 38.5) 35.1 (30.8 - 39.6) 41.1 (38.2 - 44.1) 74.5 (72.1 - 76.7)
29.8 (26.6 - 33.2) 27.4 (24.1 - 30.9) 80.6 (78.9 - 82.2) 90.7 (89.8 - 91.6)
35.5 (30.9 - 40.3) 12.9 (10.2 - 16.2) 95.0 (94.0 - 95.8) 93.8 (92.5 - 94.9)
11.3 (9.4 - 13.6) 9.0 (7.2 - 11.3) 89.8 (88.3 - 91.1) 94.1 (93.2 - 94.9)
26.7 (22.7 - 31.2) 26.8 (22.9 - 31.2) 84.0 (82.2 - 85.6) 92.8 (90.8 - 94.4)
12.7 (10.5 - 15.3) 6.6 (5.1 - 8.5) 72.7 (69.8 - 75.3) 71.8 (68.5 - 74.8)
7.6 (5.6 - 10.2) 4.2 (3.0 - 5.8) 64.4 (59.4 - 69.1) 64.9 (60.5 - 69.1)
33.8 (30.7 - 37.1) 27.8 (23.5 - 32.5) 59.0 (56.2 - 61.8) 71.3 (69.3 - 73.3)
33.8 (29.4 - 38.6) 25.9 (21.2 - 31.2) 43.1 (40.0 - 46.3) 64.6 (62.4 - 66.7)
6.0 (4.2 - 8.6) 5.0 (3.2 - 7.6) 96.1 (95.0 - 96.9) 86.3 (84.6 - 87.8)
19.6 (15.1 - 25.1) 17.1 (14.1 - 20.5) 86.7 (83.9 - 89.1) 90.4 (88.5 - 92.0)
23.0 (18.5 - 28.2) 6.0 (4.4 - 8.2) 62.3 (59.3 - 65.2) 96.7 (94.8 - 97.9)
21.5 (16.1 - 28.0) 14.3 (11.4 - 17.7) 90.4 (88.2 - 92.2) 81.5 (78.6 - 84.1)
26.9 (23.5 - 30.6) 23.9 (20.6 - 27.4) 76.4 (73.4 - 79.1) 89.4 (88.3 - 90.4)
12.2 (10.1 - 14.6) 13.1 (10.5 - 16.2) 97.7 (97.0 - 98.2) 90.6 (89.3 - 91.7)
28.1 (25.1 - 31.4) 24.3 (22.0 - 26.8) 79.5 (77.1 - 81.7) 85.7 (84.5 - 86.9)
21.4 (18.4 - 24.7) 23.9 (19.9 - 28.5) 65.9 (63.2 - 68.4) 89.0 (87.6 - 90.3)
1.5 (0.9 - 2.5) 0.5 (0.3 - 0.9) 51.5 (44.3 - 58.6) 69.7 (63.8 - 75.0)
8.5 (5.3 - 13.2) 6.8 (4.2 - 10.6) 91.9 (90.2 - 93.2) 80.2 (76.9 - 83.0)
9.4 (8.2 - 10.9) 3.5 (2.9 - 4.3) 81.6 (80.6 - 82.5) 85.9 (84.8 - 87.0)
27.6 (24.0 - 31.5) 20.6 (16.9 - 24.8) 70.1 (67.3 - 72.8) 84.4 (82.0 - 86.5)](https://image.slidesharecdn.com/ol25kkvlqguoxfywagtq-signature-60b0131a05a17be1631d7bde4d7608a3b2ae419a0a24dd90535582b58a53e895-poli-151021161413-lva1-app6891/85/MPOWER-Package-325-320.jpg)
![320 WHO REPORT ON THE GLOBAL TOBACCO EPIDEMIC, 2008
South-East
Asia
Western Pacific
Table 5.5
Global Youth Tobacco Survey
(participating countries only)
(South-East Asia)
Table 5.6
Global Youth Tobacco Survey
(participating countries only)
(Western Pacific)
Country National survey
or jurisdiction
where survey
conducted
Survey
year
Proportion currently using any tobacco
product [%]a
Males (95% CI)d
Females (95% CI)d
Bangladesh Dhaka 2004 5.9 (4.4 - 7.7) 4.7 (3.4 - 6.4)
Bhutan National 2006 33.5 (28.1 - 39.3) 13.3 (10.7 - 16.4)
India National 2006 17.3 (14.5 - 20.4) 9.7 (7.2 - 12.8)
Indonesia National 2006 24.1 (19.0 - 30.1) 4.0 (3.0 - 5.4)
Maldives National 2004 7.9 (5.7 - 10.8) 18.4 (14.4 - 23.1)
Myanmar National 2004 21.8 (18.6 - 25.4) 5.8 (4.3 - 7.8)
Nepal National 2001 11.0 (8.0 - 15.0) 4.3 (1.8 - 10.0)
Sri Lanka National 2003 7.1 (5.6 - 8.9) 9.7 (7.1 - 13.2)
Thailand National 2005 21.7 (19.4 - 24.2) 8.4 (6.9 - 10.2)
Timor-Leste National 2006 62.7 (55.1 - 69.8) 31.1 (23.0 - 40.5)
Country National survey
or jurisdiction
where survey
conducted
Survey
year
Proportion currently using any tobacco
product [%]a
Males (95% CI)d
Females (95% CI)d
Cambodia National 2003 7.2 (4.7 - 10.8) 3.0 (1.5 - 5.9)
China Shanghai 2004 7.1 (5.2 - 9.4) 4.1 (2.3 - 7.0)
China Macau 2005 12.8 (10.0 - 16.2) 11.0 (8.2 - 14.7)
Cook Islands National 2003 39.9 (32.9 - 47.4) 49.6 (42.0 - 57.2)
Fiji National 2005 13.8 (10.8 - 17.6) 10.5 (7.8 - 13.9)
Micronesia (Federated
States of)
Pohnpei 2000 47.1 (43.0 - 51.3) 38.9 (33.5 - 44.7)
Republic of Korea National 2005 10.9 (9.2 - 13.0) 8.8 (7.0 - 10.9)
Lao People's Demo-
cratic Republic
Vientiane
Municipality
2003 14.9 (11.0 - 19.8) 2.7 (1.9 - 3.9)
Malaysia National 2003 40.0 (34.6 - 45.7) 11.5 (9.4 - 13.9)
Mongolia National 2003 20.7 (16.9 - 25.1) 10.3 (8.2 - 12.9)
Palau National 2005 38.0 (33.3 - 42.9) 28.4 (24.1 - 33.1)
Philippines National 2004 21.4 (17.5 - 26.0) 11.8 (9.4 - 14.8)
Singapore National 2000 10.5 (8.8 - 12.4) 7.5 (6.2 - 9.1)
Tuvalu National 2006 41.6 (41.2 - 41.9) 32.7 (32.4 - 32.9)
Viet Nam Hanoi 2003 3.2 (1.3 - 7.4) 1.0 (0.4 - 2.6)
a
Definition: Consumed any smokeless or smoked tobacco
product at least once during the last 30 days prior to the
survey.
b
Definition: Smoked at least one cigarette during the last 30
days prior to the survey.
c
Definition: During the last seven days prior to the survey,
people smoked at least once in the presence of the
interviewee.
d
CI: Confidence Interval
. . . Data not reported/not available](https://image.slidesharecdn.com/ol25kkvlqguoxfywagtq-signature-60b0131a05a17be1631d7bde4d7608a3b2ae419a0a24dd90535582b58a53e895-poli-151021161413-lva1-app6891/85/MPOWER-Package-326-320.jpg)
![321WHO REPORT ON THE GLOBAL TOBACCO EPIDEMIC, 2008
Proportion currently smoking cigarettes [%]b
Proportion exposed to
smoke in homes
[%]c
(95% CI)d
Proportion exposed to
smoke outside homes
[%]c
(95% CI)d
Males (95% CI)d
Females (95% CI)d
4.0 (2.5 - 6.2) 0.6 (0.1 - 2.3) 33.8 (31.6 - 36.0) 46.7 (42.7 - 50.8)
23.3 (18.5 - 28.8) 7.5 (5.8 - 9.7) 32.8 (29.1 - 36.7) 54.2 (47.4 - 60.7)
5.9 (4.7 - 7.4) 1.8 (1.1 - 2.8) 26.6 (23.9 - 29.4) 40.3 (37.2 - 43.4)
23.9 (18.5 - 30.3) 1.9 (1.2 - 2.8) 64.7 (60.3 - 68.8) 81.4 (78.1 - 84.3)
3.6 (2.2 - 5.9) 12.1 (9.6 - 15.2) 50.2 (47.2 - 53.3) 75.1 (72.1 - 78.0)
11.4 (9.6 - 13.4) 3.1 (2.3 - 4.2) . . . . . . . . . . . .
6.3 (4.3 - 9.1) 0.6 (0.3 - 1.3) 35.7 (31.9 - 39.7) 46.5 (40.8 - 52.3)
1.3 (0.6 - 2.7) 3.1 (1.9 - 5.0) 51.3 (47.7 - 55.0) 68.3 (64.8 - 71.6)
17.4 (15.2 - 20.0) 4.8 (3.6 - 6.4) 49.0 (45.9 - 52.0) 68.2 (64.8 - 71.4)
59.0 (49.0 - 68.3) 19.3 (12.8 - 28.0) 65.1 (59.5 - 70.3) 70.8 (65.6 - 75.4)
Proportion currently smoking cigarettes [%]b
Proportion exposed to
smoke in homes
[%]c
(95% CI)d
Proportion exposed to
smoke outside homes
[%]c
(95% CI)d
Males (95% CI)d
Females (95% CI)d
4.6 (2.4 - 8.6) 0.2 (0.0 - 1.6) 47.0 (41.0 - 53.1) 58.5 (52.6 - 64.1)
2.7 (1.4 - 5.2) 0.8 (0.3 - 1.8) 47.0 (44.0 - 50.0) 35.2 (31.9 - 38.8)
11.0 (8.1 - 14.8) 9.8 (7.0 - 13.6) 42.1 (38.7 - 45.5) 67.3 (64.0 - 70.4)
39.9 (32.9 - 47.4) 49.6 (42.0 - 57.2) 57.6 (53.2 - 61.8) 73.0 (69.8 - 76.0)
8.5 (6.0 - 11.8) 3.2 (1.9 - 5.3) 45.9 (42.4 - 49.4) 56.5 (53.1 - 59.7)
23.3 (19.3 - 27.9) 16.8 (13.1 - 21.3) 51.2 (48.1 - 54.3) . . . . . .
7.9 (6.4 - 9.7) 5.3 (3.9 - 7.3) 39.7 (38.2 - 41.1) 65.2 (63.2 - 67.2)
10.2 (7.1 - 14.3) 0.7 (0.2 - 2.3) 43.2 (40.8 - 45.7) 57.0 (53.3 - 60.6)
36.3 (30.6 - 42.5) 4.2 (3.0 - 5.9) 11.5 (8.9 - 14.8) 16.7 (13.5 - 20.4)
14.4 (10.9 - 18.7) 4.0 (2.7 - 5.7) 63.7 (60.2 - 67.0) 48.4 (45.5 - 51.2)
31.0 (26.9 - 35.5) 22.6 (18.1 - 27.8) . . . . . . . . . . . .
16.6 (12.2 - 22.3) 7.8 (5.6 - 11.0) 56.4 (53.5 - 59.3) 58.6 (55.8 - 61.4)
10.5 (8.8 - 12.4) 7.5 (6.2 - 9.1) 35.1 (33.7 - 36.7) 65.1 (63.7 - 66.4)
33.2 (32.9 - 33.6) 22.1 (21.9 - 22.4) 76.6 (76.4 - 76.8) 76.7 (76.5 - 76.9)
1.5 (0.8 - 3.0) 0.8 (0.3 - 2.1) 57.7 (45.9 - 68.7) . . . . . .
a
Definition: Consumed any smokeless or smoked tobacco
product at least once during the last 30 days prior to the
survey.
b
Definition: Smoked at least one cigarette during the last 30
days prior to the survey.
c
Definition: During the last seven days prior to the survey,
people smoked at least once in the presence of the
interviewee.
d
CI: Confidence Interval
. . . Data not reported/not available](https://image.slidesharecdn.com/ol25kkvlqguoxfywagtq-signature-60b0131a05a17be1631d7bde4d7608a3b2ae419a0a24dd90535582b58a53e895-poli-151021161413-lva1-app6891/85/MPOWER-Package-327-320.jpg)

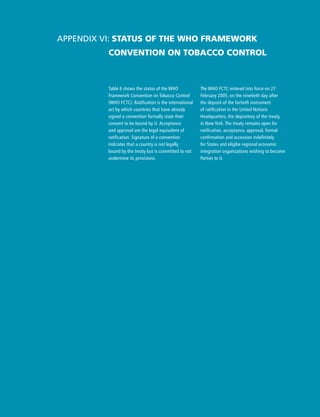
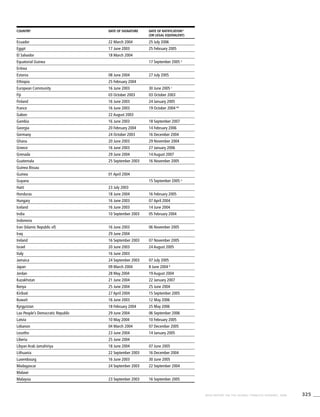
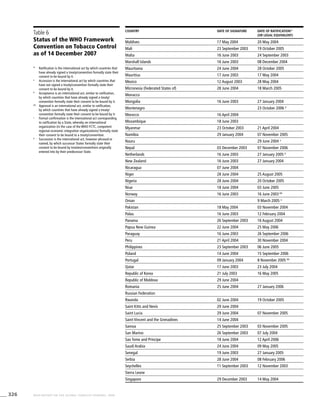
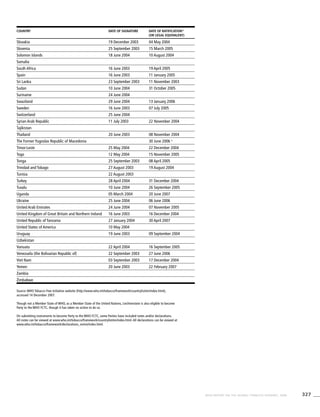
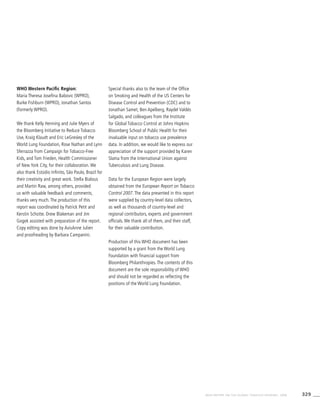
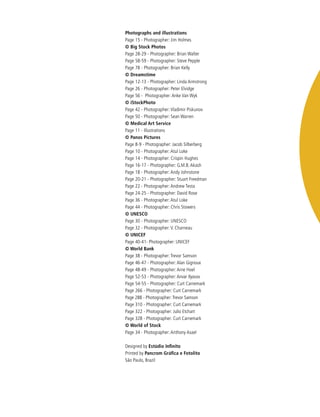
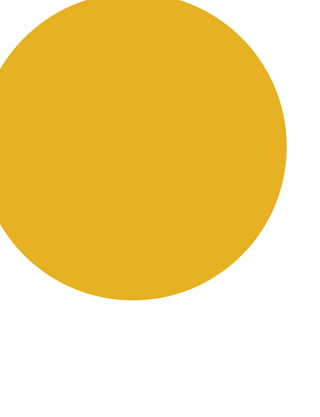


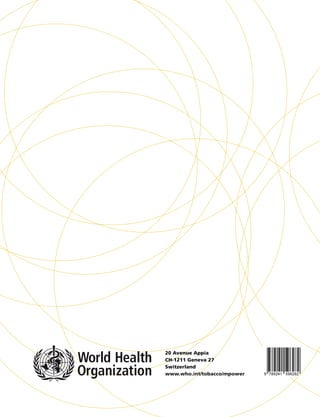

The document summarizes the WHO Report on the Global Tobacco Epidemic, 2008. It outlines that tobacco use kills over 5 million people per year and could kill over 1 billion people this century if urgent action is not taken. It presents MPOWER, a package of 6 policies recommended by the WHO to help countries implement the WHO Framework Convention on Tobacco Control: Monitor tobacco use; Protect from secondhand smoke; Offer help to quit; Warn about dangers; Enforce advertising bans; and Raise taxes. However, implementation of these policies remains limited, with only 5% of the global population currently protected by comprehensive smoke-free laws and advertising bans. Increased efforts are needed to curb the tobacco epidemic.


![ONFH[AVN HIP] -TRIPLE REGIME -A NOVAL SURGICAL CONCEPT .pptx](https://cdn.slidesharecdn.com/ss_thumbnails/onfhavnhip2026koaconcalicutdrgokuldevdrmashraf-260210064517-213ec005-thumbnail.jpg?width=640&height=640&fit=bounds)


