Download as PDF, PPTX


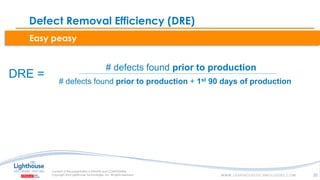
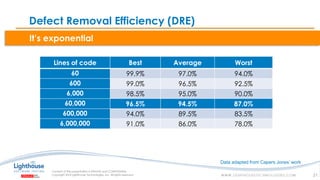


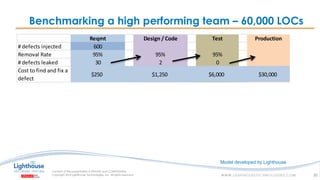
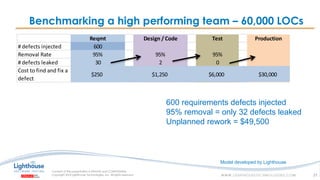
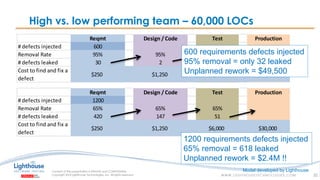
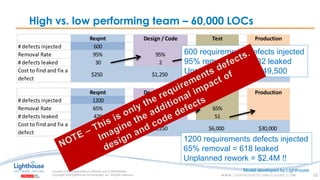


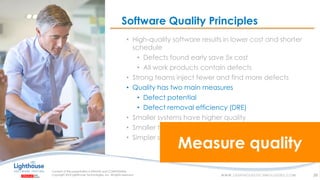

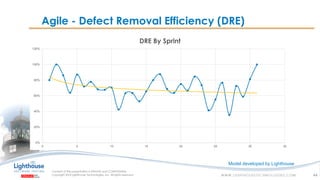


This document discusses software quality and improving defect removal efficiency. It provides principles of software quality, including that defects should be found early as they are cheaper to fix. It discusses measuring defect potential and defect removal efficiency. Finally, it provides recommendations for teams to find defects in early work products like requirements and design, strengthen inspection practices, and help their team get stronger at quality. The overall message is that high quality software results from injecting fewer defects and finding more defects early.


