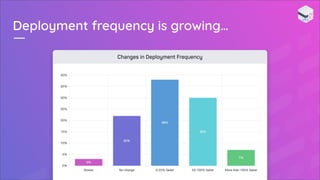
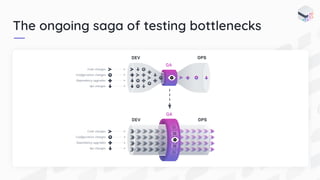
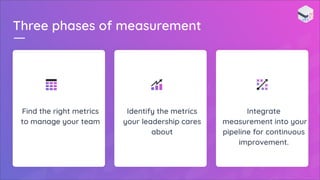
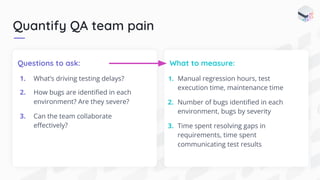
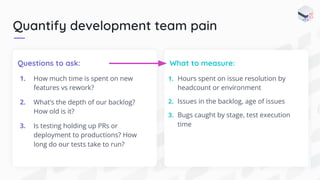
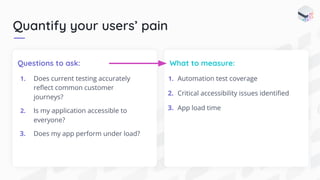
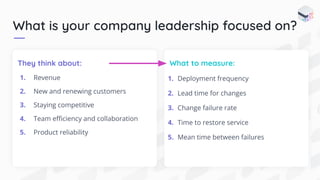
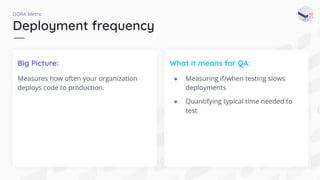
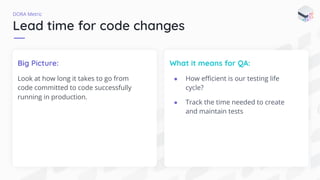
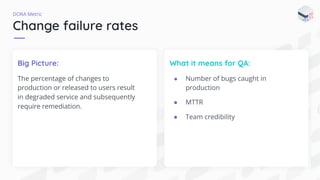
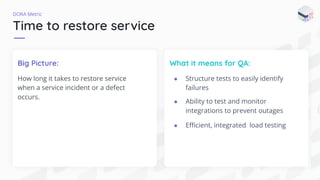
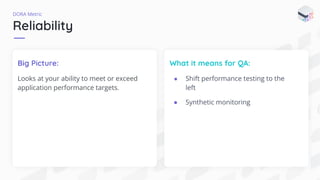
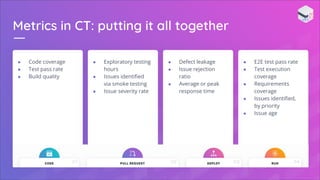
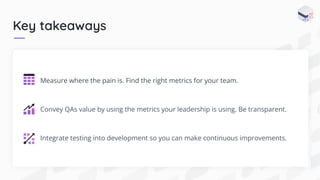
Understanding the Continuous
Testing Metrics That Matter
QA or the Highway | May 30, 2023
It’s great to be here!
Sarah Geisinger
Solutions Engineer, mabl
● Helping teams drive the adoption of automated
testing
● Passionate about helping teams in their
end-to-end test strategy
The plan for today
● Importance of tracking metrics
● Align QA performance metrics with
company goals
● What to measure in continuous
testing
● Use data to increase collaboration
and impact
$1.3T
Cost of poor quality software
Consortium for IT Software Quality,
“The Cost of Poor Quality Software in the US: a 2020 Report”
Deployment frequency is growing…
The ongoing saga of testing bottlenecks
What people don’t
understand they ignore,
and the more people
that can talk the talk,
they feel bought into quality.
Stacey Kirk, CEO of QualityWorks
Deliver better quality software faster
ROI data based on customer case studies compared to Selenium frameworks and other commercial tools.
300%
faster test creation
70%
Less time spent on
maintenance
80%
cost savings over open source
frameworks
600%
faster test execution time
BUILD FASTER IMPROVE EFFICIENCY SAVE MONEY INCREASE VELOCITY
What do you measure?
Three phases of measurement
Find the right metrics
to manage your team
Identify the metrics
your leadership cares
about
Integrate
measurement into your
pipeline for continuous
improvement.
Find the Right
Team Metrics
Look for the pain or friction across your team.
Quantify QA team pain
Questions to ask:
1. What’s driving testing delays?
2. How bugs are identified in each
environment? Are they severe?
3. Can the team collaborate
effectively?
What to measure:
1. Manual regression hours, test
execution time, maintenance time
2. Number of bugs identified in each
environment, bugs by severity
3. Time spent resolving gaps in
requirements, time spent
communicating test results
Quantify development team pain
Questions to ask:
1. How much time is spent on new
features vs rework?
2. What’s the depth of our backlog?
How old is it?
3. Is testing holding up PRs or
deployment to productions? How
long do our tests take to run?
What to measure:
1. Hours spent on issue resolution by
headcount or environment
2. Issues in the backlog, age of issues
3. Bugs caught by stage, test execution
time
Quantify your users’ pain
Questions to ask:
1. Does current testing accurately
reflect common customer
journeys?
2. Is my application accessible to
everyone?
3. Does my app perform under load?
What to measure:
1. Automation test coverage
2. Critical accessibility issues identified
3. App load time
Identify the
Metrics
Leadership is
Focused on
It is likely different than the metrics you use to
manage your team.
What is your company leadership focused on?
They think about:
1. Revenue
2. New and renewing customers
3. Staying competitive
4. Team efficiency and collaboration
5. Product reliability
What to measure:
1. Deployment frequency
2. Lead time for changes
3. Change failure rate
4. Time to restore service
5. Mean time between failures
DevOps Research and Assessment Metrics
DORA looks at 5 key metrics that measure
a software team’s performance.
Why is it important?
● Customer experience = revenue
● Your leadership is already tracking
these metrics
Save this for further reading
Google, Accelerate State of DevOps 2020 Report
Deployment frequency
Big Picture:
Measures how often your organization
deploys code to production.
What it means for QA:
● Measuring if/when testing slows
deployments
● Quantifying typical time needed to
test
DORA Metric
Lead time for code changes
Big Picture:
Look at how long it takes to go from
code committed to code successfully
running in production.
What it means for QA:
● How efficient is our testing life
cycle?
● Track the time needed to create
and maintain tests
DORA Metric
Change failure rates
What it means for QA:
● Number of bugs caught in
production
● MTTR
● Team credibility
DORA Metric
Big Picture:
The percentage of changes to
production or released to users result
in degraded service and subsequently
require remediation.
Time to restore service
Big Picture:
How long it takes to restore service
when a service incident or a defect
occurs.
What it means for QA:
● Structure tests to easily identify
failures
● Ability to test and monitor
integrations to prevent outages
● Efficient, integrated load testing
DORA Metric
Reliability
Big Picture:
Looks at your ability to meet or exceed
application performance targets.
What it means for QA:
● Shift performance testing to the
left
● Synthetic monitoring
DORA Metric
Integrating QA
Metrics into Your
Pipeline
There are nuances to measurement, starting from
the coding phase.
Metrics in CT: putting it all together
● Code coverage
● Test pass rate
● Build quality
● Exploratory testing
hours
● Issues identified
via smoke testing
● Issue severity rate
● Defect leakage
● Issue rejection
ratio
● Average or peak
response time
● E2E test pass rate
● Test execution
coverage
● Requirements
coverage
● Issues identified,
by priority
● Issue age
The power of real-time dashboards
● Transparency can go a long way in
building credibility with other teams
and leadership
● Leverage your BI tool of choice to
give visibility to each of your
stakeholders
Key takeaways
Measure where the pain is. Find the right metrics for your team.
Convey QAs value by using the metrics your leadership is using. Be transparent.
Integrate testing into development so you can make continuous improvements.
Impacting your KPIs with low-code testing
Let’s dive into the mabl
platform to see how
mabl can positively
impact some of the
metrics that we talked
about here today.
Enterprise-grade scale,
support, security
Rich integrations with DevOps
workflow
Analytics identify issues
proactively
Unified platform enables
consolidation
Auto-healing reduces test
maintenance
Mabl is test automation that scales
Low code framework for UI,
API, Mobile, a11y
Questions?

Sarah Geisinger - Continious Testing Metrics That Matter.pdf

  • 1.
    Understanding the Continuous TestingMetrics That Matter QA or the Highway | May 30, 2023
  • 2.
    It’s great tobe here! Sarah Geisinger Solutions Engineer, mabl ● Helping teams drive the adoption of automated testing ● Passionate about helping teams in their end-to-end test strategy
  • 3.
    The plan fortoday ● Importance of tracking metrics ● Align QA performance metrics with company goals ● What to measure in continuous testing ● Use data to increase collaboration and impact
  • 4.
    $1.3T Cost of poorquality software Consortium for IT Software Quality, “The Cost of Poor Quality Software in the US: a 2020 Report”
  • 5.
  • 6.
    The ongoing sagaof testing bottlenecks
  • 7.
    What people don’t understandthey ignore, and the more people that can talk the talk, they feel bought into quality. Stacey Kirk, CEO of QualityWorks
  • 8.
    Deliver better qualitysoftware faster ROI data based on customer case studies compared to Selenium frameworks and other commercial tools. 300% faster test creation 70% Less time spent on maintenance 80% cost savings over open source frameworks 600% faster test execution time BUILD FASTER IMPROVE EFFICIENCY SAVE MONEY INCREASE VELOCITY
  • 9.
    What do youmeasure?
  • 10.
    Three phases ofmeasurement Find the right metrics to manage your team Identify the metrics your leadership cares about Integrate measurement into your pipeline for continuous improvement.
  • 11.
    Find the Right TeamMetrics Look for the pain or friction across your team.
  • 12.
    Quantify QA teampain Questions to ask: 1. What’s driving testing delays? 2. How bugs are identified in each environment? Are they severe? 3. Can the team collaborate effectively? What to measure: 1. Manual regression hours, test execution time, maintenance time 2. Number of bugs identified in each environment, bugs by severity 3. Time spent resolving gaps in requirements, time spent communicating test results
  • 13.
    Quantify development teampain Questions to ask: 1. How much time is spent on new features vs rework? 2. What’s the depth of our backlog? How old is it? 3. Is testing holding up PRs or deployment to productions? How long do our tests take to run? What to measure: 1. Hours spent on issue resolution by headcount or environment 2. Issues in the backlog, age of issues 3. Bugs caught by stage, test execution time
  • 14.
    Quantify your users’pain Questions to ask: 1. Does current testing accurately reflect common customer journeys? 2. Is my application accessible to everyone? 3. Does my app perform under load? What to measure: 1. Automation test coverage 2. Critical accessibility issues identified 3. App load time
  • 15.
    Identify the Metrics Leadership is Focusedon It is likely different than the metrics you use to manage your team.
  • 16.
    What is yourcompany leadership focused on? They think about: 1. Revenue 2. New and renewing customers 3. Staying competitive 4. Team efficiency and collaboration 5. Product reliability What to measure: 1. Deployment frequency 2. Lead time for changes 3. Change failure rate 4. Time to restore service 5. Mean time between failures
  • 17.
    DevOps Research andAssessment Metrics DORA looks at 5 key metrics that measure a software team’s performance. Why is it important? ● Customer experience = revenue ● Your leadership is already tracking these metrics Save this for further reading Google, Accelerate State of DevOps 2020 Report
  • 18.
    Deployment frequency Big Picture: Measureshow often your organization deploys code to production. What it means for QA: ● Measuring if/when testing slows deployments ● Quantifying typical time needed to test DORA Metric
  • 19.
    Lead time forcode changes Big Picture: Look at how long it takes to go from code committed to code successfully running in production. What it means for QA: ● How efficient is our testing life cycle? ● Track the time needed to create and maintain tests DORA Metric
  • 20.
    Change failure rates Whatit means for QA: ● Number of bugs caught in production ● MTTR ● Team credibility DORA Metric Big Picture: The percentage of changes to production or released to users result in degraded service and subsequently require remediation.
  • 21.
    Time to restoreservice Big Picture: How long it takes to restore service when a service incident or a defect occurs. What it means for QA: ● Structure tests to easily identify failures ● Ability to test and monitor integrations to prevent outages ● Efficient, integrated load testing DORA Metric
  • 22.
    Reliability Big Picture: Looks atyour ability to meet or exceed application performance targets. What it means for QA: ● Shift performance testing to the left ● Synthetic monitoring DORA Metric
  • 23.
    Integrating QA Metrics intoYour Pipeline There are nuances to measurement, starting from the coding phase.
  • 24.
    Metrics in CT:putting it all together ● Code coverage ● Test pass rate ● Build quality ● Exploratory testing hours ● Issues identified via smoke testing ● Issue severity rate ● Defect leakage ● Issue rejection ratio ● Average or peak response time ● E2E test pass rate ● Test execution coverage ● Requirements coverage ● Issues identified, by priority ● Issue age
  • 25.
    The power ofreal-time dashboards ● Transparency can go a long way in building credibility with other teams and leadership ● Leverage your BI tool of choice to give visibility to each of your stakeholders
  • 26.
    Key takeaways Measure wherethe pain is. Find the right metrics for your team. Convey QAs value by using the metrics your leadership is using. Be transparent. Integrate testing into development so you can make continuous improvements.
  • 27.
    Impacting your KPIswith low-code testing Let’s dive into the mabl platform to see how mabl can positively impact some of the metrics that we talked about here today.
  • 28.
    Enterprise-grade scale, support, security Richintegrations with DevOps workflow Analytics identify issues proactively Unified platform enables consolidation Auto-healing reduces test maintenance Mabl is test automation that scales Low code framework for UI, API, Mobile, a11y
  • 29.